
 100% FREE ACCESS
12th Standard Syllabus & Materials
12th Standard
TN 12th Maths Applications of Matrices and Determinants Sample Question Papers Study Material - QB365 Set A
NEW12th Standard
TN 12th Computer Applications மின்னணு தரவு பரிமாற்றம் Sample Question Papers Study Material - QB365 Set A
NEW12th Standard
TN 12th Computer Applications மின் - வணிக பாதுகாப்பு அமைப்புகள் Sample Question Papers Study Material - QB365 Set A
NEW12th Standard
TN 12th Computer Applications மின்னணு செலுத்தல் முறைகள் Sample Question Papers Study Material - QB365 Set A
NEW12th Standard
TN 12th Computer Applications மின் - வணிகம் Sample Question Papers Study Material - QB365 Set A
NEW12th Standard
TN 12th Computer Applications திறந்த மூல கருத்துருக்கள் Sample Question Papers Study Material - QB365 Set A

Published on: 01/03/2021
12th Standard English medium Business Maths Reduced Syllabus Public Exam Model Question Paper With Answer Key - 2021
Download Tamil Nadu 12th Standard Business Maths and Statistics question papers, model tests, one-mark questions, important questions, and public exam papers in PDF format. Free study materials and answer keys for TN State Board students.
Questions + Answers key
Take MCQ Business Maths and Statistics Test
1.
Measurements of the weights of a random sample of 200 ball bearings made by certain machine during one week showed a mean of 0.824 newtons and a S.D. of 0.042 newton's. Find
a) 95% and
b) 99% confidence limits for the mean weight of all the ball bearings.
2.
Marks in an aptitude test given to 800 students of a school was found to be normally distributed 10% of the students scored below 40 marks and 10% of the students scored above 90 marks. Find the number of students scored between 40 and 90?
3.
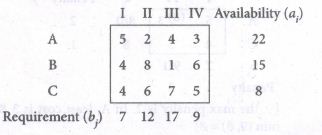
Obtain an initial basic feasible solution to the following transportation problem using Vogels' approximation method.
4.
Evaluate \(\int { \frac { 1 }{ { 3x }^{ 2 }+13x-10 } } dx\)
5.
Solve: x2\(\frac { dy }{ dx } \) = y2+2xy given that y = 1, when x = 1
6.
Using Newton’s formula for interpolation estimate the population for the year 1905 from the table:
| Year | 1891 | 1901 | 1911 | 1921 | 1931 |
| Population | 98.752 | 1,32,285 | 1,68,076 | 1,95,690 | 2,46,050 |
7.
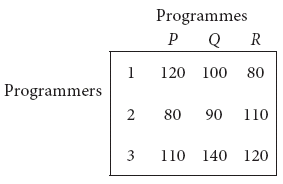
A computer centre has got three expert programmers. The centre needs three application programmes to be developed. The head of the computer centre, after studying carefully the programmes to be developed, estimates the computer time in minitues required by the experts to the application programme as follows.
Assign the programmers to the programme in such a way that the total computer time is least.
8.
The following are the sample means and ranges for 10 samples, each of size 5. Calculate the control limits for the mean chart and range chart and state whether the process is in control or not.
| Sample number | 1 | 2 | 3 | 4 | 5 | 6 | 7 | 8 | 9 | 10 |
| Mean | 5.10 | 4.98 | 5.02 | 4.96 | 4.96 | 5.04 | 4.94 | 4.92 | 4.92 | 4.98 |
| Range | 0.3 | 0.4 | 0.2 | 0.4 | 0.1 | 0.1 | 0.8 | 0.5 | 0.3 | 0.5 |
9.
You are given below the values of sample mean ( \(\bar{X}\) ) and the range ( R ) for ten samples of size 5 each. Draw mean chart and comment on the state of control of the process.
| Sample number | 1 | 2 | 3 | 4 | 5 | 6 | 7 | 8 | 9 | 10 |
| \(\overset{-}{X}\) | 43 | 49 | 37 | 44 | 45 | 37 | 51 | 46 | 43 | 47 |
| R | 5 | 6 | 5 | 7 | 7 | 4 | 8 | 6 | 4 | 6 |
Given the following control chart constraint for : n = 5, A2 = 0.58, D3 = 0 and D4 = 2.115
10.
The mean life time of a sample of 169 light bulbs manufactured by a company is found to be 1350 hours with a standard deviation of 100 hours. Establish 90% confidence limits within which the mean life time of light bulbs is expected to lie.
11.
In a particular university 40% of the students are having news paper reading habit. Nine university students are selected to find their views on reading habit. Find the probability that
(i) none of those selected have news paper reading habit
(ii) all those selected have news paper reading habit
(iii) atleast two third have news paper reading habit.
12.
The probability function of a random variable X is given by
\(p(x)=\left\{\begin{array}{l} \frac{1}{4}, \text { for } x=-2 \\ \frac{1}{4}, \text { for } x=0 \\ \frac{1}{2}, \text { for } x=10 \\ 0, \text { elsewhere } \end{array}\right.\)
Evaluate the following probabilities.
P(\(\le\))0
13.
Integrate the following with respect to x.
\(e^{x}\left[\frac{x-1}{(x+1)^{3}}\right]\)
14.
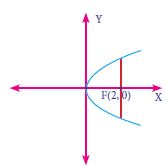
Find the area of the parabola \({ y }^{ 2 }=8x\) bounded by its latus rectum.
15.
In a market survey three commodities A, B and C were considered. In finding out the index number some fixed weights were assigned to the three varieties in each of the commodities. The table below provides the information regarding the consumption of three commodities according to the three varieties and also the total weight received by the commodity
| Commodity Variety | Variety | Total weight | ||
| I | II | III | ||
| A | 1 | 2 | 3 | 11 |
| B | 2 | 4 | 5 | 21 |
| C | 3 | 5 | 6 | 27 |
Find the weights assigned to the three varieties by using Cramer’s Rule.
16.
The normal equations for estimating a and b so that the line y = ax + b may be the line of best fit are __________
aΣx2 + bΣx = Σxy, aΣx + nb = Σy
aΣx + bΣx2 = Σxy, aΣx2 + nb = Σy
aΣx + nb = Σxy, aΣx2 + bΣx = Σy
aΣx2 + nb = Σxy, aΣx + bΣx = Σy
17.
Probability of rejecting null hypothesis. when it is true is _______
Type I error
Type II error
Sampling error
Standard error
18.
A coin is tossed 3 times. The probability of getting exactly 2 heads is _________
\(\frac{1}{2}\)
\(\frac{1}{8}\)
\(\frac{3}{8}\)
\(\frac{1}{4}\)
19.
If X is a discrete random variable. then P(X≥a)=________.
P(X
1-P(X≤a)
1-P(X
0
20.
The penalty is the difference between the ___ costs in each row and column.
smallest
biggest
minimum
least
21.
The solution of \(\frac { dp }{ dt } \) = ke-t (k is a constant) is _____________
c-\(\frac { k }{ { e }^{ t } } \) = p
p = ket+c
t = log\(\left( \frac { c-p }{ k } \right) \)
t = logc p
22.
For the set of values
| x | 1961 | 1971 | 1981 | 1991 | 2001 |
| y | 46 | 66 | 81 | 93 | 101 |
| A | B |
| 1) Δy | (a) -5 |
| 2) Δ2y | (b) 2 |
| 3) Δ3y | (c) -3 |
| 4) Δ4y | (d) 20 |
1 - a, 2 - b, 3 - c, 4 - d
1 - b, 2 - c, 3 - d, 4 - a
1 - d, 2 - a, 3 - b, 4 - c
1 - c, 2 - a, 3 - b, 4 - c
23.
\(\int { { a }^{ 3x+2 } } \) dx = _____________ +c
a3x+2
\(\frac { { a }^{ 3x+2 } }{ 3 } \)
\(\frac { { a }^{ 3x+2 } }{ 3loga } \)
3 log a (a3x+2)
24.
If A, B are two n x n non-singular matrices, then ___________
AB is non-singular
AB is singular
(AB)-1 = A-1 B-1
(AB)-1 does not exit
25.
The area enclosed by the curve y = cos2x in [0,\(\pi\)] the lines x=0, x = \(\pi\) and the X-axis is ________sq.units.
2\(\pi\)
2\(\pi\)
\(\frac{2}{\pi}\)
\(\frac{\pi}{2}\)
26.
If c is a constant then Δc = _______.
c
Δ
Δ2
0
27.
The purpose of a dummy row or column in an assignment problem is to _______.
prevent a solution from becoming degenerate
balance between total activities and total resources
provide a means of representing a dummy problem
none of the above
28.
Solution of \(\frac { dy }{ dx } \) + Px = 0 ______.
x = cepy
x = ce−py
x = py + c
x = cy
29.
R is calculated using ________.
xmax - xmin
xmin - xmax
\(\overset{-}{x}\)max - \(\overset{-}{x}\)min
\(\overset{=}{x}\)max - \(\overset{=}{x}\)min
30.
In simple random sampling from a population of N units, the probability of drawing any unit at the first draw is ______.
\(\frac{n}{N}\)
\(\frac{1}{N}\)
\(\frac{N}{n}\)
1
31.
\(\int \frac{\sin 5 x-\sin x}{\cos 3 x} d x\) is _______.
−cos 2x + c
−cos 2x + c
\(-\frac14\)cos2x + c
−4cos2x + c
32.
The weights of newborn human babies are normally distributed with a mean of 3.2 kg and a standard deviation of 1.1 kg. What is the probability that a randomly selected newborn baby weighs less than 2.0 kg?
0.138
0.428
0.766
0.262
33.
In a discrete probability distribution the sum of all the probabilities is always equal to ________.
zero
one
minimum
maximum
34.
For a demand function p, if \(\int \frac{d p}{p}=k \int \frac{d x}{x}\) then k is equal to ________.
\(\eta \)d
-\(\eta \)d
\(\frac{-1}{\eta_{d}}\)
\(\frac{1}{\eta_{d}}\)
35.
The rank of m x n matrix whose elements are unity is ________.
0
1
m
n
36.
The following data shows the value of sample mean (\(\bar{X}\)) and the range R for 10 samples of size 5 each. Calculate the control limits for : mean chart and range chart.
| Sample No. | 1 | 2 | 3 | 4 | 5 | 6 | 7 | 8 | 9 | 10 |
| Mean \(\bar{X}\) | 11.2 | 11.8 | 10.8 | 11.6 | 11.0 | 9.6 | 10.4 | 9.6 | 10.6 | 10.0 |
| Range | 7 | 4 | 8 | 5 | 7 | 4 | 8 | 4 | 7 | 9 |
(Given for n = 5, A2 = .577, D3 = 0, D4 = 2.115)
37.
Students of a class were given an aptitude test. Marks were found to be normally distributed with mean 60 and S.D. 5. Find the percentage of students who scored more than 60 marks.
38.
Find the missing term from the following data
| x | 1 | 2 | 3 | 4 |
| f(x) | 100 | - | 126 | 157 |
39.
Find the area under the curve y = 4x - x2 included between x = 0, x = 3 and the X-axis.
40.
Two newspapers A and B are published in a city . Their market shares are 15% for A and 85% for B of those who bought A the previous year, 65% continue to buy it again while 35% switch over to B. Of those who bought B the previous year, 55% buy it again and 45% switch over to A. Find their market shares after one year
41.
Find the order and degree of the following differential equations.
\(\frac { { d }^{ 3 }y }{ d{ x }^{ 3 } } =0\)
42.
Write mathematical form of transportation problem.
43.
What is an estimator?
44.
Using second fundamental theorem, evaluate the following:
\(\int_{0}^{\frac{1}{4}} \sqrt{1-4 x} \ d x\)
45.
Define Mathematical expectation in terms of discrete random variable.
46.
A random sample of marks in mathematics secured by 50 students out of 200 students showed a mean of 75 and a standard deviation of 10. Find the 95% confidence limits for the estimate of their mean marks.
47.
A player tosses two unbiased coins. He wins Rs. 5 if two heads appear, Rs. 2 if one head appear and Rs.1 if no head appear. Find the expected amount to win.
48.
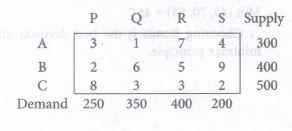
Determine an initial basic feasible solution to the following transportation problem using North West corner rule.
49.
Evaluate \(\int { \frac { { sec }^{ 2 }x }{ 3+tanx } } dx\)
50.
Find the equation of the curve passing through (1, 0) and which has slope 1+ \(\frac { y }{ x } \) at (x, y).
51.
Find the rank of each of the following matrices.
\(\left( \begin{matrix} 1 & -2 & 3 \\ -2 & 4 & -1 \\ -1 & 2 & 7 \end{matrix}\begin{matrix} 4 \\ -3 \\ 6 \end{matrix} \right) \)
52.
Using graphic method, find the value of y when x = 38 from the following data:
| x | 10 | 20 | 30 | 40 | 50 | 60 |
| y | 63 | 55 | 44 | 34 | 29 | 22 |
53.
Suppose A and B are two equally strong table tennis players. Which of the following two events is more probable:
(a) A beats B exactly in 3 games out of 4 or
(b) A beats B exactly in 5 games out of 8 ?
54.
The marginal revenue function for a firm is given by MR = \(\frac { 2 }{ x+3 } -\frac { 2x }{ { \left( x+3 \right) }^{ 2 } } +5\). Show that the demand function is \(P=\frac{2}{x+3}+5\)
1.
Given sample size n = 200
Sample mean \(\bar { x } \) = 0.824
Sample S.D. s = 0.042
Standard error = \(\frac { s }{ \sqrt { n } } =\frac { 0.042 }{ \sqrt { 200 } } \)
= \(\frac { 0.042 }{ 14.14 } \) = 0.00270
(a) As the level of significance is α = 0.05, \(Z_{ \frac { \alpha }{ 2 } }\) = 1.96
∴ 95% confidence limits for μ are given by \(\bar { x } -Z_{ \frac { \alpha }{ 2 } }(S.E)\le \mu \le \bar { x } +Z_{ \frac { \alpha }{ 2 } }(S.E)\)
⇒ 0.824 - (1.96) (0.00270) ≤ μ ≤ 0.824 + (1.96) (0.00270)
⇒ 0.824 - 0.00582 ≤ μ ≤ 0.824 + 0.00582
⇒ 0.818 ≤ μ ≤ 0.832
Hence, the 95% confidence limits for μ is (0.818,0.832)
(b) As the level of significance is α =0.001, \(Z_{ \frac { \alpha }{ 2 } }\) = 2.58
∴ 99% confidence limits for μ are given by \(\bar { x } -Z_{ \frac { \alpha }{ 2 } }(S.E)\le \mu \le \bar { x } +Z_{ \frac { \alpha }{ 2 } }(S.E)\)
⇒ 0.824 - (2.58) (0.00270) ≤ μ ≤ 0.824 + (2.58) (0.00270)
⇒ 0.824 - 0.00582 ≤ μ ≤ 0.824 + 0.005825
⇒ 0.816 ≤ μ ≤ 0.832
Hence, the 99% confidence limits for μ is (0.816, 0.832)
2.
Let X denote the height of the student
Given P (X < 40) = 10% = \(\frac { 10 }{ 100 } \) =0.1
P(X> 90) = 10% = \(\frac { 10 }{ 100 } \) =0.1
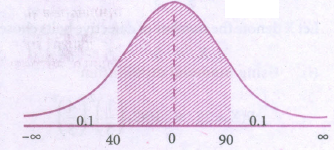
∴ P(40 < X < 90) = P(-∞ < X < ∞) - [P(X < 40) + P(X < 90)]
= 1 - (0.1 + 0.1)
= 1 - 0.2 = 0.8
∴ out of 800 students, number of students scored between 40 and 90 = 800 x 0.8
= 640 students.
3.
Here Σai = 22 + 15 + 8 = 45
Σbj = 7 + 12 + 17 + 9 = 45
Σai = Σbj
∴ The given problem is balanced transportation problem.
Hence, there exists a feasible solution to the given problem.
I-allocation:
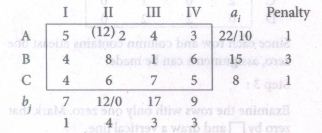
[∵ the max penalty is 4. In II, least cost is 2 & min (12,22) = 12]
II-allocation:
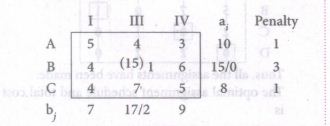
[∵ the max penalty is 3. In B, least cost is 1 & min (17,15) = 15]
III-allocation:
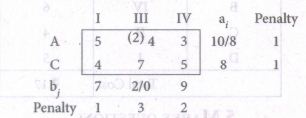
[∵ the max penalty is 3. In III, least cost is 4 & min (2, 10) = 2]
IV-allocation:
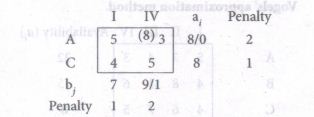
[∵ the max penalty is 2. In A, least cost is 3 & min (9, 8) = 8]
V-allocation:
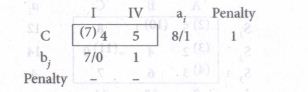
[∵ the max penalty is 1. In C, least cost is 4 & min (7, 8) = 7]
VI-allocation:
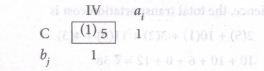
[∵ min (1,1) = 1]
Thus, the allocations are
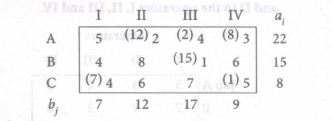
∴ The transportation schedule is
A → II, A → III, A → IV, B → III, C → I and C → IV
Hence, the total transportation cost is
= 12(2) + 2(4) + 8(3) + 15(1) + 7(4) + 1(5)
= 24 + 8 + 24 + 15 + 28 + 5 = Rs.104
4.
Let I = \(\int { \frac { 1 }{ { 3x }^{ 2 }+13x-10 } } dx\)
= \(\frac { 1 }{ 3 } \int { \frac { dx }{ { x }^{ 2 }+\frac { 13 }{ 3 } x-\frac { 10 }{ 3 } } } \)
= \(\frac { 1 }{ 3 } \int { \frac { dx }{ { x }^{ 2 }+\frac { 13 }{ 3 } x+\frac { 169 }{ 36 } -\frac { 169 }{ 36 } -\frac { 10 }{ 3 } } } \)
= \(\frac { 1 }{ 3 } \int { \frac { dx }{ { \left( x+\frac { 13 }{ 6 } \right) }^{ 2 }-\frac { 289 }{ 36 } } } \)
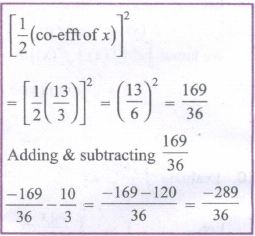
= \(\frac { 1 }{ 3 } \int { \frac { dx }{ { \left( x+\frac { 13 }{ 6 } \right) }^{ 2 }-{ \left( \frac { 17 }{ 16 } \right) }^{ 2 } } } \)
= \(\left[ \because \int { \frac { dx }{ { x }^{ 2 }-{ a }^{ 2 } } =\frac { 1 }{ 2a } log\left| \frac { x-a }{ x+a } \right| } +c \right] \)
= \(\frac { 1 }{ 3 } \times \frac { 1 }{ 2\times \frac { 17 }{ 6 } } log\left| \frac { x+\frac { 13 }{ 6 } -\frac { 17 }{ 6 } }{ x+\frac { 13 }{ 6 } +\frac { 17 }{ 6 } } \right| +c\)
= \(\frac { 1 }{ 17 } log\left| \frac { x-\frac { 2 }{ 5 } }{ x+5 } \right| +c\)
= \(\frac { 1 }{ 17 } log\left| \frac { 3x-2 }{ 3(x+5) } \right| +c\)
5.
Given x2\(\frac { dy }{ dx } \)= y2+2xy
⇒ \(\frac { dy }{ dx } =\frac { { y }^{ 2 }+2xy }{ x^{ 2 } } \)
The numerator and denominator are homogeneous function of degree
∴ put y = vx and \(\frac { dy }{ dx } =v+x\frac { dv }{ dx } \)
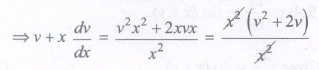
= v2+2v
⇒ v + x\(\frac { dv }{ dx } \) = v2+ 2v
⇒ x\(\frac { dv }{ dx } \) = v2+ 2v-v = v2+ v
Separating the variables,
\(\frac { dv }{ { v }^{ 2 }+v } =\frac { dx }{ x } \Rightarrow \frac { dv }{ v(v+1) } =\frac { dx }{ x } \)
[\(\frac { 1 }{ v(v+1) } =\frac { A }{ v } +\frac { B }{ v+1 } \)
1 = A(v+1)+Bv
put v = -1
1 = -B
put v = 0
1 = A
∴ \(\left( \frac { 1 }{ v } +\frac { 1 }{ v+v } \right) dv=\frac { dx }{ x } \)
Integrating
\(\int { \frac { dv }{ v } } -\int { \frac { dv }{ v+1 } } =\int { \frac { dx }{ x } } \)
⇒ log v - log (v + 1) - log x + log c
⇒ log\(\left( \frac { v }{ v+1 } \right) \)= log(xc)
⇒ \(\frac { v }{ v+1 } \)
Replacing v by \(\frac { y }{ x } \) we get,
\(\frac { \frac { y }{ x } }{ \frac { y }{ x } +1 } =xc\Rightarrow \frac { \frac { y }{ x } }{ \frac { x+y }{ x } } \) = xc
⇒ \(\frac { y }{ x+y } \) = xc
⇒ y = cx(x+y) ....(1)
Given, when x = -1, y = 1
∴ 1 = c(1) (1+1) ⇒ = 2c ⇒ c = \(\frac { 1 }{ 2 } \)
∴ (1) becomes, y = \(\frac { x }{ 2 } \)(x+y)
⇒ 2y = x(x+y)
6.
To find the population for the year 1905 (i.e) the value of y at x = 1905
Since the value of y is required near the beginning of the table, we use the Newton’s forward interpolation formula.
\({ y }_{ \left( x={ x }_{ 0 }+nh \right) }={ y }_{ 0 }+\cfrac { n }{ n! } \Delta { y }_{ 0 }+\cfrac { n(n-1) }{ 2! } { \Delta }^{ 2 }{ y }_{ 0 }+\cfrac { n(n-)(n-2) }{ 3! } { \Delta }^{ 3 }{ y }_{ 0 } + ...\)
To find y at x = 1905
\(\therefore\) x0+nh = 1905 , x0 = 1891, h = 10
1891+n(10) = 1905 \(\Rightarrow\) n = 1.4
| x | y | \(\Delta y\) | \(\Delta ^{ 2 }y\) | \(\Delta ^{ 3 }y\) | \(\Delta ^{ 4 }y\) |
|---|---|---|---|---|---|
| 1891 | 98,752 | ||||
| 33,533 | |||||
| 1901 | 1,32,285 | 2,258 | |||
| 35,791 | –10,435 | ||||
| 1911 | 1,68,076 | -8,177 | 41,376 | ||
| 27,614 | |||||
| 1921 | 1,95,690 | 30,941 | |||
| 22,764 | |||||
| 50,360 | |||||
| 1931 | 2,46,050 |
y(x=1905) = \(98,752+(1.4)(33533)+\frac { (1.4)(0.4) }{ 2 } (2258)+\frac { (1.4)(0.4)(-0.6) }{ 6 } (-10435)+\frac { (1.4)(0.6)(-0.6)(-1.6) }{ 24 } (41358)\)
= 98,752 + 46946.2 + 632.4 + 584.36 + 1389.63
= 1,48,304.43
= 1,48,304
7.
Here, the number of rows and columns are equal
∴ The given assignment problem is balanced.
Step I : Select a smallest element in each row and subtract this from all the elements in its row.
∴ The given assignment problem is
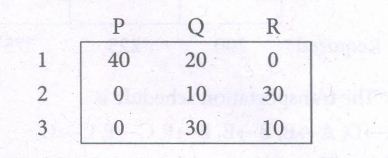
Here column 2 has no zero. Go to Step 2.
Step 2 : Select the smallest element (10) and subtract it from all the elements in its column.
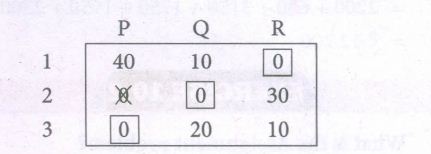
Step 3 : Examine the rows with only one zero mark that zero by Ԡ. Mark other zeros in its column by X.
Row 1 and Row 3 contains only one zero. Mark the other zeros by X
Column 2 contains exactly one zero. Mark it by Ԡ
Thus, all the 3 assignments have been made.
Hence, the optimal assignment schedule and total cost is
| Programmers | Programmes | Cost |
| 1 | R | 80 |
| 2 | Q | 90 |
| 3 | P | 110 |
Total cost = Rs. 280
Thus, the optimal assignment (minimum) cost = Rs. 280
8.
\(\overline {\overline{X}} = \frac {5.10+4.98+5.02+4.96+4.96+5.04+4.94+4.92+4.92+4.98}{10}\)
\(\overline {\overline{X}}\) = \(\frac {49.82}{10} = 4.982\)
\(\overline {\overline{R}} = \frac {0.3+.4+.2+.4+.1+.1+.8+.5+.3+.5}{10}\)
\(\overline {R}\) = \(\frac {3.6}{10}\) = 0.36
The control limits of mean chart are
UCL = \(\overline {\overline{X}} + A_{2} \overline{R}\)
= 4.982 + .577(.36)
= 4.982+ .208 = 5.19
CL = 4.982
LCL = \(\overline {\overline{X}} - A_{2} \overline{R}\)
= 4.982 - .208 = 4.774
The control limits of R-chart are
UCL = D4\(\overline {R}\) = 2.114 (.36) = 0.761
CL = \(\overline {R}\) = .36
LCL = D3\(\overline {R}\) = 0
Mean Chart
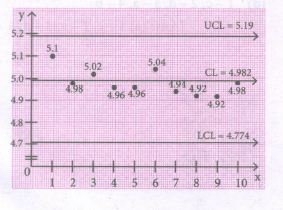
Range chart
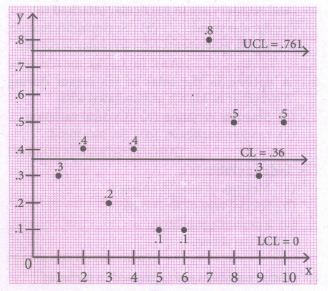
Conclusion: The above diagram shows all the control lines with the data points plotted.
Since one in Range chart, lie outside the control limits, we can say that the process is out of control.
9.
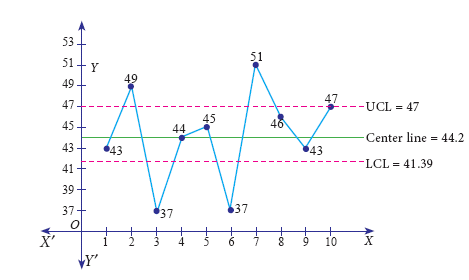
\(\overset { = }{ X } =\frac { \sum { \bar { X } } }{ 10 } =\frac { 442 }{ 10 } =44.2\)
\(\bar { R } =\frac { \sum { R } }{ n } =\frac { 58 }{ 10 } =5.8\)
\(UCL=\overset { = }{ X } +{ A }_{ 2 }\bar { R } \)
= 44.2 + 0.483(5.8) = 47.00
\(CL=\overset { = }{ X } =44.2\)
\(LCL=\overset { = }{ X } -{ A }_{ 2 }\bar { R } =44.2-0.483(5.8)=41.39\)
The above diagram shows all the three control lines with the data points plotted, since four points falls out of the control limits, we can say that the process is out of control.
10.
Given: n = 169, \(\bar x\) =1350 hours, \(\sigma\) =100 hours, since the level of significance is (100-90)% =10% thus \(\alpha\) is 0.1, hence the significant value at 10% is \({ Z }_{ \frac { \alpha }{ 2 } }\)=1.645
\(S.E.=\frac { \sigma }{ \sqrt { n } } =\frac { 100 }{ \sqrt { 169 } } =7.69\)
Hence 90% confidence limits for the population mean are
\(\bar { x } -{ Z }_{ \frac { \sigma }{ 2 } }<\mu <\bar { x } +{ Z }_{ \frac { \sigma }{ 2 } }SE\)
\(\begin{gathered} 1350-(1.645 \times 7.69) \leq \mu \leq 1350+(1.645 \times 7.69) \end{gathered}\)
\(1337.35 \leq \mu \leq 1362.65\)
Hence the mean life time of light bulbs is expected to lie between the interval (1337.35, 1362.65).
11.
Let the probability of student having reading habit
p = 40% = \(\frac { 40 }{ 100 } \) = 0.4
⇒ q = 1-p = 1-0.4 = 0.6
n = 9
(i) P (none of those who have selected having reading habit)
= P(X = 0)
= 9C0(0.4)0 (0.6)9
= (1)(1)(0.6)9 [∵ nCx pxqn-x = p(x), n = 9, x = 0]
= (0.6)9 [ ∵ 9C0 = 1 ]
= 0.01008
(ii) P (all those who have selected have newspaper reading habit)
= P(X = 9)
= 9C9(0.4)9 (0.6)0 [∵ p(x) =nCx pxqn-x, n = 9, x = 9]
= (0.4)9 [ ∵ 9C9 = 1 ]
= 0.000261
(iii) Two thirds of 9 = \(\frac{2}{3}\) x 9 = 6
∴ P(atleast two third have newspaper reading habit)
= P (atleast 6 have newspaper reading habit)
= P(X≥6)
= P(X = 6)+P(X = 7)+P(X = 8)+P(X = 9)
= 9C6 (0.4)6 (0.6)3 + 9C7 (0.4)7 (0.6)2 + 9C8 (0.4)8 (0.6)1 + 9C9 (0.4)9 (0.6)0
= (0.4)6 [9C6 (0.6)3 + 9C7 (0.4) (0.6)2 + 9C8 (0.4)2 (0.6) + (0.4)3 ]
= (0.4)6 [9C3 (0.216) + 9C2 (0.144) + 9C1 (0.096)+0.64 [∵ nCr = nCn-r ]
= (0.4)6 \(\left[ \frac { 9\times 8\times 7 }{ 3\times 2\times 1 } (0.216)+\frac { 9\times 8 }{ 2\times 1 } (0.144)+9(0.096)+.064 \right] \)
= (0.4)6 [18.144 + 5.184 + 0.864 + 0.064]
= (0.4)6 [24.256] = (0.0041) (24.256)
∴ P(X≥6) = 0.0994
12.
Given probability function is
\(p(x)=\left\{\begin{array}{l} \frac{1}{4}, \text { for } x=-2 \\ \frac{1}{4}, \text { for } x=0 \\ \frac{1}{2}, \text { for } x=10 \\ 0, \text { elsewhere } \end{array}\right.\)
| X=x | -2 | 0 | 10 |
| P(X=x) | \(\frac{1}{4}\) | \(\frac{1}{4}\) | \(\frac{1}{2}\) |
P(X≤0)=P(X=-2)+P(X=0)
=\(\frac{1}{4}\)+\(\frac{1}{4}\)=\(\frac{1}{2}\)
13.
\(Let\ I=\int { { e }^{ x } } \left[ \frac { x-1 }{ { \left( x+1 \right) }^{ 3 } } \right] \)
\(=\int { { e }^{ x } } \left[ \frac { x-1+1-1 }{ { \left( x+1 \right) }^{ 3 } } \right] dx\)
[Adding and subtracting 1 in the numerator]
\(=\int { { e }^{ x } } \left[ \frac { x+1-2 }{ { \left( x+1 \right) }^{ 3 } } \right] dx\)
\(=\int { { e }^{ x } } \left( \frac { x+1 }{ { \left( x+1 \right) }^{ 3 } } -\frac { 2 }{ { \left( x+1 \right) }^{ 3 } } \right) dx\)
\(=\int { { e }^{ x } } \left( \frac { 1 }{ { \left( x+1 \right) }^{ 3 } } -\frac { 2 }{ { { \left( x+1 \right) } }^{ 3 } } \right) dx\)
\(Let\ f\left( x \right) =\frac { 1 }{ { \left( x+1 \right) }^{ 2 } } ={ \left( x+1 \right) }^{ -2 }\)
\(\Rightarrow f^{ ' }\left( x \right) =-2{ \left( x+1 \right) }^{ -2-1 }\)
\(=-2{ \left( x+1 \right) }^{ -3' }\)
\(=\frac { -2 }{ { \left( x+1 \right) }^{ 3 } } \)
\(\therefore I=\int { { e }^{ x }\left[ f\left( x \right) +f^{ ' }\left( x \right) \right] } dx\)
\(={ e }^{ x }\quad f\left( x \right) +c\)
\(={ e }^{ x }\frac { 1 }{ { \left( x+1 \right) }^{ 2 } } +c\)
\(=\frac { { e }^{ x } }{ { \left( x+1 \right) }^{ 2 } } +c\)
14.
\({ y }^{ 2 }=8x\) (1)
Comparing this with the standard form \({ y }^{ 2 }=4x\),
4a = 8
a = 2
Equation of latus rectum is x = 2
Since equation (1) is symmetrical about x- axis
Required Area = 2[Area in the first quadrant between the limits x = 0 and x = 2]
\(=2\int _{ 0 }^{ 2 }{ y } dx\)
\(2\int _{ 0 }^{ 2 }{ \sqrt { 8xdx } } =2(2\sqrt { 2 } )\int _{ 0 }^{ 2 }{ { x }^{ 1/2 } } dx\)
\(=4\sqrt { 2 } { \left[ \frac { { 2x }^{ \frac { 3 }{ 2 } } }{ 3 } \right] }_{ 0 }^{ 2 }=4\sqrt { 2 } \times 2 \times \frac { { 2 }^{ \frac { 3 }{ 2 } } }{ 3 } \)
\(=\frac { 32 }{ 3 } \) sq. units.
15.
Let the weight assigned to the three varieties be Rs. x, Rs. y and Rs. z respectively By the given data,
x + 2y + 3z = 11
2x + 4y + 5z = 21
3x + 5y + 6z = 27
\(\Delta =\left| \begin{matrix} 1 & 2 & 3 \\ 2 & 4 & 5 \\ 3 & 5 & 6 \end{matrix} \right| =1\left| \begin{matrix} 4 & 5 \\ 5 & 6 \end{matrix} \right| -2\left| \begin{matrix} 2 & 5 \\ 3 & 6 \end{matrix} \right| +3\left| \begin{matrix} 2 & 4 \\ 3 & 5 \end{matrix} \right| \)
= 1(24 - 25) -2(12 - 15) + 3(10 - 12)
= 1(-1) -2 (-3) + 3(-2)
= -1+6 - 6 = -1\(\neq \) 0.
Since \(\Delta \neq 0\) the system is consistent with unique solution and Cramer's rule can be applied.
\(\Delta x=\left| \begin{matrix} 11 & 2 & 3 \\ 21 & 4 & 5 \\ 27 & 5 & 6 \end{matrix} \right| \)
\(=11\left| \begin{matrix} 4 & 5 \\ 5 & 6 \end{matrix} \right| -2\left| \begin{matrix} 21 & 5 \\ 27 & 6 \end{matrix} \right| +3\left| \begin{matrix} 21 & 4 \\ 27 & 5 \end{matrix} \right| \)
= 11(24 - 25) - 2(126 - 135) + 3(105 - 108)
= 11(-1) - 2(-9) + 3 (-3)
= 11+18-9
= -2
\(\Delta y=\left| \begin{matrix} 1 & 11 & 3 \\ 2 & 21 & 5 \\ 3 & 27 & 6 \end{matrix} \right| \)
= \(\left| \begin{matrix} 21 & 5 \\ 27 & 6 \end{matrix} \right| -11\left| \begin{matrix} 2 & 5 \\ 3 & 6 \end{matrix} \right| +3\left| \begin{matrix} 2 & 21 \\ 3 & 27 \end{matrix} \right| \)
= 1(126 - 135) - 11(12 -15) + 3(54 - 63)
= - 9 - 11(-3) + 3(-9)
= - 9 + 33 - 27
= 3
\(\Delta z=\left| \begin{matrix} 1 & 2 & 11 \\ 2 & 4 & 21 \\ 3 & 5 & 27 \end{matrix} \right| =1\left| \begin{matrix} 4 & 21 \\ 5 & 27 \end{matrix} \right| -2\left| \begin{matrix} 2 & 21 \\ 3 & 27 \end{matrix} \right| +11\left| \begin{matrix} 2 & 4 \\ 3 & 5 \end{matrix} \right| \)
= 1(108 - 105) - 2(54 - 63) + 11(10 - 12)
= 1(3) - 2(-9) + 11(-2)
= 3 + 18 - 22
= -1
\(x=\cfrac { \Delta x }{ \Delta } =\cfrac { -2 }{ -1 } =2\)
\(y=\cfrac { \Delta y }{ \Delta } =\cfrac { -3 }{ 1 } =3\)
and \(z=\cfrac { \Delta z }{ \Delta } =\cfrac { -1 }{ -1 } =1\)
Hence, the weights assigned to the three varieties are 2, 3 and 1 respectively
16.
(a)
aΣx2 + bΣx = Σxy, aΣx + nb = Σy
17.
(a)
Type I error
18.
(c)
\(\frac{3}{8}\)
19.
(c)
1-P(X
20.
(b)
biggest
21.
(a)
c-\(\frac { k }{ { e }^{ t } } \) = p
22.
(c)
1 - d, 2 - a, 3 - b, 4 - c
23.
(a)
a3x+2
24.
The non-homogeneous equation are
2x - y + z = 7, 3x + y - 5z = 13, x + y + z = 5
| Augmented matrix [A,B] |
Elementary Transformation |
|---|---|
| \(\left( \begin{matrix} 2 & -1 & 1 \\ 3 & 1 & -5 \\ 1 & 1 & 1 \end{matrix}\begin{matrix} 7 \\ 13 \\ 5 \end{matrix} \right) \) | |
| \(-\left( \begin{matrix} 1 & 1 & 1 \\ 3 & 1 & -5 \\ 2 & -1 & 1 \end{matrix}\begin{matrix} 5 \\ 13 \\ 7 \end{matrix} \right) \) | \({ R }_{ 1 }\leftrightarrow { R }_{ 3 }\) |
| \(\sim \left( \begin{matrix} 1 & 1 & 1 \\ 0 & -2 & -8 \\ 0 & -3 & -1 \end{matrix}\begin{matrix} 5 \\ -2 \\ -3 \end{matrix} \right) \) | \({ R }_{ 2 }\rightarrow { R }_{ 2 }-3{ R }_{ 1 }\) \({ R }_{ 3 }\rightarrow { R }_{ 3 }-2{ R }_{ 1 }\) |
| \(\sim \left( \begin{matrix} 1 & 1 & 1 \\ 0 & -2 & -8 \\ 0 & 0 & 11 \end{matrix}\begin{matrix} 5 \\ -2 \\ 0 \end{matrix} \right) \) | \({ R }_{ 3 }\rightarrow { R }_{ 3 }-\cfrac { 3 }{ 2 } { R }_{ 2 }\) |
Clearly \(\rho (A)=3\) and \(\rho (A,B)\) = 3 = Number of unknowns
\(\therefore\) The given system is consistent and has unique solution.
25.
(d)
\(\frac{\pi}{2}\)
26.
(d)
0
27.
(b)
balance between total activities and total resources
28.
(b)
x = ce−py
29.
(a)
xmax - xmin
30.
(b)
\(\frac{1}{N}\)
31.
(a)
−cos 2x + c
32.
(a)
0.138
33.
(b)
one
34.
(c)
\(\frac{-1}{\eta_{d}}\)
35.
(b)
1
36.
\(\bar{\bar{X}}\) = \(\frac{11.2 + 11.8 + 10.8 + 11.6 + 11.0+ 9.6 + 10.4 + 9.6 + 10.6 + 10.0}{10}\)
\(=\frac{106.6}{10}=10.66\)
\(\bar{R}=\frac{7+4+8+5+7+4+8+4+7+9}{10}\)
\(=\frac{63}{10}=6.3\)
Control limits for mean chart
UCL = \(\bar{\bar{X}}\) + A2\(\bar{R}\)
= 10.66 + .577(6.3) = 14.295
CL = \(\bar{\bar{X}}\) = 10.66
Control limits for R-chart
UCL = D2\(\bar{R}\) = 2.115 \(\times\) 6.3
= 13.324
CL = \(\bar{R}\) = 6.3
LCL = D3\(\bar{R}\) = 0
37.
Given mean μ = 60 and S.D. σ = 5
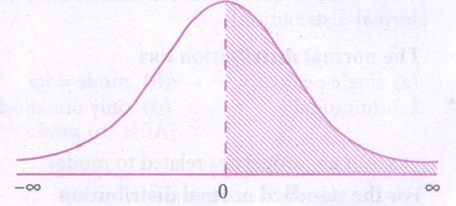
To find P(X > 60)
When X = 60, Z =\(\frac { X-\mu }{ \sigma } =\frac { 60-60 }{ 5 } \) = 0
∴ P(X > 60) = P(Z > 0) = P (0 < Z < ∞)
= 0.5
∴ 50% of students scored more than 60 marks
38.
Since three values of f(x) are given, we assume that the polynomial is of degree two.
⇒ Δ3(f(x0)) = 0
⇒ ∆3(yo) = 0
⇒ (E - 1)3 yo= 0
⇒ (E3 - 3E2 + 3E - 1) yo= 0
⇒ y3- 3y2+ 3y1 - yo= 0
⇒ 157 - 3 (126) + 3y1 - 100 = 0
⇒ y1 = 107
∴ The missing term is 107.
39.
Given curve is y = 4x - X2
The limits are from x = 0 to x = 3
∴ Area \(\int _{ 0 }^{ 3 }{ y } dx=\int _{ 0 }^{ 3 }{ (4x-{ x }^{ 2 }) } dx\)
\({ \left[ \frac { 4{ x }^{ 2 } }{ 2 } -\frac { { x }^{ 3 } }{ 3 } \right] }_{ 0 }^{ 3 }=2(9)-\frac { 27 }{ 3 } \)
=18 - 9
Area = 9 sq.units
40.
Transition probability matrix
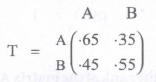
Given present market shares are 15% for A and 85% for B
\(\therefore\) Market shares after one year
= \(\left( \cdot 15\cdot 85 \right) \left( \begin{matrix} \cdot 65 & \cdot 35 \\ \cdot 45 & \cdot 55 \end{matrix} \right) \)
= ((-15)(-65)+(-85)(-45) ·15x·35+·85x·55)
= (-0975 + 0.3825 .0525 + 4675)
= (0 .48 0.52)
\(\therefore\) Market shares after one year for A is 48% and for B is 52%
41.
The highest derivative is of third order and its power is 1.
Order is 3 and degree is 1.
42.
The objective function is minimize Z = \(\overset { m }{ \underset { i=1 }{ \Sigma } } \overset { n }{ \underset { j=1 }{ \Sigma } } { { C }_{ ij } }{ x }_{ ij }\) subject to the constraints
\(\overset { n }{ \underset { j=1 }{ \Sigma } }{ x }_{ ij } = a_i, i=1,2,.....m\) (Supply constraints)
\(\overset { m }{ \underset { i=1 }{ \Sigma } }{ x }_{ ij } = b_j, j=1,2,.....n\) (demand constraints)
xij ≥, 0 for all i, j (non-negative restrictions)
43.
Any sample statistic which is used to estimate an unknown population parameter is called an estimator (i.e.,). an estimator is a sample statistic used to estimate a population parameter.
44.
\(\int _{ 0 }^{ \frac { 1 }{ 4 } }{ { \sqrt { 1-4x } } } dx=\int _{ 0 }^{ \frac { 1 }{ 4 } }{ { \left( 1-4x \right) }^{ \frac { 1 }{ 2 } } } dx\)
\(={ { { \left[ \frac { { \left( 1-4x \right) }^{ \frac { 1 }{ 2 } +1 } }{ -4\left( \frac { 1 }{ 2 } +1 \right) } \right] }_{ 0 } } }^{ \frac { 1 }{ 4 } }={ { \left[ \frac { { \left( 1-4x \right) }^{ \frac { 3 }{ 2 } } }{ -4\left( \frac { 3 }{ 2 } \right) } \right] }_{ 0 } }^{ \frac { 1 }{ 4 } }\)
\(={ { \left[ \frac { { \left( 1-4x \right) }^{ \frac { 3 }{ 2 } } }{ -6 } \right] }_{ 0 } }^{ \frac { 1 }{ 4 } }\)
\(=\frac { -1 }{ 6 } \left[ { \left( 1-4\left( \frac { 1 }{ 4 } \right) \right) }^{ \frac { 3 }{ 2 } }-{ \left( 1-4(0) \right) }^{ \frac { 3 }{ 2 } } \right] \)
\(=\frac { -1 }{ 6 } \left[ { 0 }^{ \frac { 3 }{ 2 } }-{ 1 }^{ \frac { 3 }{ 2 } } \right] \)
\(=\frac { -1 }{ 6 } (0-1)=\frac { 1 }{ 6 } \)
45.
Let X be a discrete random variable with probability mass function p(x), then its expected value is defined by
E(X) =\(\sum _{ x }^{ }{ x.p(x) } \)
46.
Sample size n = 50
Sample mean \(\bar { x } \) = 75
Sample S.D. s = 10
Standard error (S.E) = \(\frac { s }{ \sqrt { n } } =\frac { 10 }{ \sqrt { 50 } } =\frac { 10 }{ 7.07 } \)
= 1.414
As the significance level is α = 0.005, \(Z_{ \frac { \alpha }{ 2 } }\) = 1.96
∴ 95% confidence limits for the population mean is \(\bar { X } -Z_{ \frac { \alpha }{ 2 } }(S.E)\le \bar { X } -Z_{ \frac { \alpha }{ 2 } }(S.E)\)
⇒ 75 - (1.96)(1.414) ≤ μ ≤ 75 + (1.96)(1.414)
⇒ 75-2.771 ≤ μ ≤ 75 + 2.771
⇒ 72.23 ≤ μ ≤ 77.77
Hence, the 95% confidence interval of the population mean is (72.23, 77.77)
47.
When 2 coins are tossed, sample space S={HH, HT, TH, TT} ⇒ n(s) = 4
∴P(X = 5) = p(getting 2 heads) =\(\frac{1}{4}\)
P(X = 2) = p(getting 1 head) = \(\frac{2}{4}=\frac{1}{2}\)
P(X = 1) = p(getting no head) = \(\frac{1}{4}\)
Hence the probability distribution function is
| X | 1 | 2 | 5 |
| P(X=x) | \(\frac{1}{4}\) | \(\frac{1}{2}\) | \(\frac{1}{4}\) |
\(\therefore E(x)=\sum { { x }_{ i }{ p }_{ i }=1(\frac { 1 }{ 4 } ) } +2(\frac { 1 }{ 2 } )+5(\frac { 1 }{ 4 } )\)
\(=\frac { 1 }{ 4 } +1+\frac { 5 }{ 4 } =\frac { 1+4+5 }{ 4 } \)
\(=\frac { 10 }{ 4 } =2.50\)
Hence the expected money to win is Rs. 2.50
48.
Here total supply = 300 + 400 + 500 = 1200
Total demand = 250 + 350 + 400 + 200 =1200
∴ Total supply = total demand
The given problem is a balanced transportation problem.
Hence, there exists a feasible solution to the given problem
I-allocation:
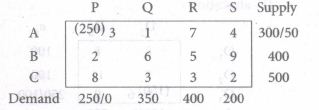
[∵ Min (250, 300) = 250]
II-allocation:
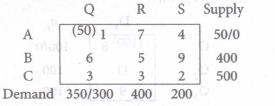
[∵ Min (50,350) = 50]
III-allocation:
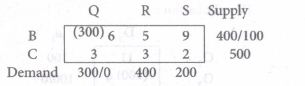
[∵ Min (300,400) = 300]
IV-allocation:
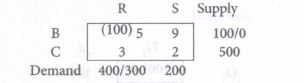
[∵ Min (400,100) = 100]
V-allocation:
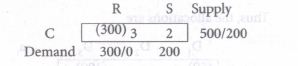
[∵ Min (300, 500) = 300]
VI-allocation:
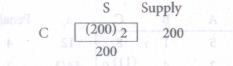
[∵ Min (200, 200) = 200]
Thus, the allocations are
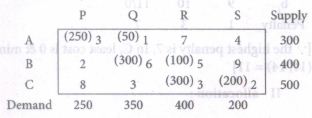
∴ The transportation schedule is
A → P, A → Q, B → Q, B → R, C → R, C → S
Hence, the total transportation cost is
= 250 (3) + 50 (1) + 300 (6) + 100 (5) + 300 (3) + 200 (2)
= 750 + 50 + 1800 + 500 + 900 + 400
= Rs. 4400
49.
Let \(I=\int { \frac { { sec }^{ 2 }x }{ 3+tanx } } dx\)
Put 3 + tan x = t
⇒ 0 + sec2x dx = dt
⇒ sec2 x dx = dt
\(\therefore I={ \int { \frac { dt }{ t } } }\)
= log |t| + c
= log |3 + tan x| + c
[∵ t = 3 + tan x]
50.
Given slope is 1+\(\frac { y }{ x } \)
⇒ \(\frac { dy }{ dx } =1+\frac { y }{ x } \Rightarrow \frac { dy }{ dx } =\frac { x+y }{ x } \)
The numerator and denominator homogeneous functions of degree 1
So put y = vx and \(\frac { dy }{ dx } =v+x\frac { dv }{ dx } \)
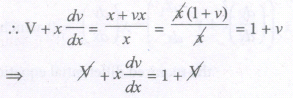
⇒ x\(\frac { dv }{ dx } \) = 1
Separating the variables we get,
dv = \(\frac { dx }{ x } \)
Integrating, \(\int { dv } =\int { \frac { dv }{ x } } \)
⇒ v = log x + log c
⇒ v = log x c
Replacing V by \(\frac { y }{ x } \) we get,
\(\frac { y }{ x } \) log x c ⇒ y - x log c x...(1)
Since the Curve passes through (1, 0),
0 = 1 logc ⇒ log c =0 ⇒ c = e0 =1
∴ c = 1
∴ (1) becomes, y = x logx.
51.
A =\(\left( \begin{matrix} 1 & -2 & 3 \\ -2 & 4 & -1 \\ -1 & 2 & 7 \end{matrix}\begin{matrix} 4 \\ -3 \\ 6 \end{matrix} \right) \)
The order of A is 3 x 4
\(\therefore \rho (A)\le \text{minimum} \ of(3,4)\)
\(\rho (A)\le 3\)
Let us transform the matrix A to an echelon form
| Matrix A | Elementary Transformation |
|---|---|
| \(A=\left( \begin{matrix} 1 & -2 & 3 \\ -2 & 4 & -1 \\ -1 & 2 & 7 \end{matrix}\begin{matrix} 4 \\ -3 \\ 6 \end{matrix} \right) \) | |
| \(\sim \left( \begin{matrix} 1 & -2 & 3 \\ 0 & 0 & 5 \\ -1 & 2 & 7 \end{matrix}\begin{matrix} 4 \\ 5 \\ 6 \end{matrix} \right) \) | \({ R }_{ 2 }-{ R }_{ 2 }+2{ R }_{ 1 }\) |
| \(\left( \begin{matrix} 1 & -2 & 3 \\ 0 & 0 & 5 \\ 0 & 0 & 10 \end{matrix}\begin{matrix} 4 \\ 5 \\ 10 \end{matrix} \right) \) | \({ R }_{ 3 }\rightarrow { R }_{ 3 }+{ R }_{ 1 }\) |
| \(\left( \begin{matrix} 1 & -2 & 3 \\ 0 & 0 & 5 \\ 0 & 0 & 0 \end{matrix}\begin{matrix} 4 \\ 5 \\ 0 \end{matrix} \right) \) | \({ R }_{ 3 }\rightarrow { R }_{ 3 }-2{ R }_{ 2 }\) |
The matrix is in echelon form and the number of non- zero rows is 2
\(\therefore \rho (A)=2\)
52.
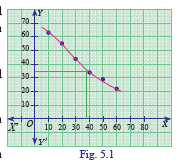
(i) Take a suitable scale for the values of x and y, and plot the various points on the graph paper for given values of x and y.
(ii) Draw a suitable curve passing through the plotted points.
(iii) Find the point corresponding to the value x = 38 on the curve and then read the corresponding value of y on the y- axis, which will be the required interpolated value.
From the graph in Figure we find that for x = 38, the value of y is equal to 35
53.
Here p = q = 1/2
(a) probability of A beating B in exactly 3 games out of 4
\(\left( \begin{matrix} 4 \\ 3 \end{matrix} \right) { (\frac { 1 }{ 2 } ) }^{ 3 }\left( \frac { 1 }{ 2 } \right) ^{ 4-3 }\)
= 1/4 = 25%
(b) probability of A beating B in exactly 5 games out of 8
\(\left( \begin{matrix} 8 \\ 5 \end{matrix} \right) { (\frac { 1 }{ 2 } ) }^{ 5 }\left( \frac { 1 }{ 2 } \right) ^{ 8-5 }\)
\(=\frac { 7 }{ 32 } \) = 21.875%
Clearly, the first event is more probable.
54.
Given \(MR=\frac { 2 }{ x+3 } -\frac { 2x }{ (x+{ 3) }^{ 2 } } +5\)
\(\Rightarrow \int { MR } =\int { \left( \frac { 2 }{ x+3 } -\frac { 2x }{ (x+{ 3) }^{ 2 } } +5 \right) dx } \)
\(\Rightarrow R=2log(x+3)-2\int { \frac { x }{ { (x+3) }^{ 2 } } dx+5x+k } \)
\(\Rightarrow R=2log(x+3)-2\left[ \int { \frac { x+3-3 }{ { (x+3) }^{ 2 } } dx } \right] +5x+k\)
\(\Rightarrow R=21log(x+3)-2\left[ \int { \frac { 1 }{ x+3 } dx-3\int { \frac { dx }{ { (x+3) }^{ 2 } } } } \right] +5x+k\)

\(\Rightarrow R=\frac { -6 }{ x+3 } +5x+k\)
When x = 0, R = 0 ⇒ k = 0
\(0=\frac { -6 }{ 3 } +0+k\Rightarrow k=+2\)
\(\therefore R=\frac { -6 }{ x+3 } +5x-2\)
Demand function \(P=\frac { R }{ x } \)
\(\Rightarrow P=\frac { -6 }{ x(x+3) } +5+\frac { 2 }{ x } \)
\(\Rightarrow P=\frac { -6+2(x+3) }{ x(x+3) } +5\)
\(\Rightarrow P=\frac { -6+2x+6 }{ x(x+3) } +5\)
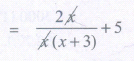
\(\Rightarrow P=\frac { 2 }{ x+3 } +5\)

12th Standard Syllabus & Materials
12th Standard
TN 12th Computer Applications வலையமைப்பு வடமிடல் Sample Question Papers Study Material - QB365 Set A
NEW12th Standard
TN 12th Computer Applications களப்பெயர் முறைமை (DNS) Sample Question Papers Study Material - QB365 Set A
NEW12th Standard
TN 12th Computer Applications வலையமைப்பு எடுத்துக்காட்டுகள் மற்றும் நெறிமுறைகள் Sample Question Papers Study Material - QB365 Set A
NEW12th Standard
TN 12th Computer Applications கணினி வலையமைப்பு ஓர் அறிமுகம் Sample Question Papers Study Material - QB365 Set A



Tamilnadu Stateboard 12th Standard Subjects

Maths

Chemistry

Physics

Biology

Computer Science
Business Maths and Statistics

Economics

Commerce

Accountancy

History

Computer Applications
Biology
Computer Technology
Computer Applications
Computer Science
Business Maths and Statistics
Commerce
Economics
Maths
Chemistry
Physics
Computer Technology
History
Accountancy

Tamil

English

French
Tamilnadu Stateboard Standards
