
 100% FREE ACCESS
12th Standard Syllabus & Materials
12th Standard
TN 12th Computer Applications மின்னணு தரவு பரிமாற்றம் Sample Question Papers Study Material - QB365 Set A
NEW12th Standard
TN 12th Computer Applications மின் - வணிக பாதுகாப்பு அமைப்புகள் Sample Question Papers Study Material - QB365 Set A
NEW12th Standard
TN 12th Computer Applications மின்னணு செலுத்தல் முறைகள் Sample Question Papers Study Material - QB365 Set A
NEW12th Standard
TN 12th Computer Applications மின் - வணிகம் Sample Question Papers Study Material - QB365 Set A
NEW12th Standard
TN 12th Computer Applications திறந்த மூல கருத்துருக்கள் Sample Question Papers Study Material - QB365 Set A
NEW12th Standard
TN 12th Computer Applications வலையமைப்பு வடமிடல் Sample Question Papers Study Material - QB365 Set A

Published on: 23/06/2021
QB365 provides detailed and simple solution for every
Creative Questions in class 12 Business Maths Subject.It will helps to get more idea about question pattern in
every Creative questions with solution.
Download Tamil Nadu 12th Standard Business Maths and Statistics question papers, model tests, one-mark questions, important questions, and public exam papers in PDF format. Free study materials and answer keys for TN State Board students.
Questions + Answers key
Take MCQ Business Maths and Statistics Test
1.
Using Lagrange's formula and y(x) from the following table.
| x | 6 | 7 | 10 | 12 |
| y | 13 | 14 | 15 | 17 |
2.
Using Lagrange's formula, find the value of y when x = 42 from the following table
| x | 40 | 50 | 60 | 70 |
| y | 31 | 73 | 124 | 159 |
3.
Estimate the population for the year 1995.
| year (x) | 1961 | 1971 | 1981 | 1991 | 2001 |
| population in thousands (y) | 46 | 66 | 81 | 93 | 101 |
4.
Find the number of men getting wages between Rs. 30 and Rs. 35 from the following table.
| Wages (x) | 20 - 30 | 30 - 40 | 40 - 50 | 50 - 60 |
| No. of men (y) | 9 | 30 | 35 | 42 |
5.
From the following data, estimate the population for the year 1986 graphically.
| year | 1960 | 1970 | 1980 | 1990 | 2000 |
| Population (in thousands) | 12 | 15 | 20 | 26 | 33 |
1.
Given
xo = 6, x1 = 7, x2 = 10, x3 = 12
yo = 13, y1 = 14, y2 = 15, y3 = 17
Using Lagrange's formula,
y(11) = \(13\frac { (4)(1)(-1) }{ (-1)(-4)(-6) } +14\frac { (5)(1)(-1) }{ (1)(-3)(-5) } +5\frac { (5)(4)(-1) }{ (4)(3)(-2) } +17\frac { (5)(4)(1) }{ (6)(5)(2) } \)
= 2.1666 - 4.6666 + 12.5 + 5.6666
= 15.6666
∴ y(x) = 15.6666
2.
By data, we have
xo = 40, x1 = 50, x2 = 60, x3 = 70
yo = 31, y1 = 73, y2 = 124, y3 = 159.
Using Lagrange's formula, we get
\(y={ y }_{ 0 }\frac { (x-{ x }_{ 1 })(x-{ x }_{ 2 })(x-{ x }_{ 3 }) }{ ({ x }_{ 0 }-{ x }_{ 1 })({ x }_{ 0 }-{ x }_{ 2 })({ x }_{ 0 }-{ x }_{ 3 }) } +{ y }_{ 1 }\frac { (x-{ x }_{ 0 })(x-{ x }_{ 2 })(x-{ x }_{ 3 }) }{ ({ x }_{ 1 }-{ x }_{ 0 })({ x }_{ 1 }-{ x }_{ 2 })({ x }_{ 1 }-{ x }_{ 3 }) } { y }_{ 2 }+\frac { (x-{ x }_{ 0 })(x-{ x }_{ 1 })(x-{ x }_{ 3 }) }{ ({ x }_{ 2 }-{ x }_{ 0 })({ x }_{ 2 }-{ x }_{ 1 })({ x }_{ 2 }-{ x }_{ 3 }) } +{ y }_{ 3 }\frac { (x-{ x }_{ 0 })(x-{ x }_{ 1 })(x-{ x }_{ 3 }) }{ ({ x }_{ 3 }-{ x }_{ 0 })({ x }_{ 3 }-{ x }_{ 1 })({ x }_{ 3 }-{ x }_{ 2 }) } \)
∴ y(42) = 31\(\frac { (-8)(-18)(-28) }{ (-10)(-20)(-30) } +73\frac { (2)(-18)(-28) }{ (10)(-10)(-20) } +124\frac { (2)(-8)(-28) }{ (20)(10)(-10) } +59\frac { (2)(-8)(-28) }{ (30)(20)(10) } \)
= 20. 832 + 36. 792 - 27. 776 + 7.632
y = 37. 48
3.
Since 1995 lies at the table of the table, use Newton's backward interpolation formula.
Also, xn + nh ⇒ x 2001 + n (10) = 1995
⇒ 10n = 1995 - 2001 ⇒ n = \(\frac{-6}{10}\) ⇒ n = -0.6
\(\Rightarrow { y }_{ n }+\frac { n }{ n! } \nabla { y }_{ n }+\frac { n(n+1) }{ 2! } { \nabla }^{ 2 }{ y }_{ n }+\frac { n(n+1)(n-2) }{ 3! } { \nabla }^{ 3 }{ (y }_{ n })\)
The difference table is
| x | y | ∇y | ∇2y | ∇3y | ∇4y |
|---|---|---|---|---|---|
| 1961 | 46 | ||||
| 1971 | 66 | 20 | |||
| 1981 | 81 | 15 | -5 | ||
| 1991 | 93 | 12 | -3 | -2 | |
| 2001 | 101 | 8 | -4 | -1 | -3 |
∴ \(y=101+\frac { (0.6) }{ 1! } (8)+\frac { (-0.6)(-0.6+1) }{ 2! } (-4)+\frac { (-0.6)(-0.6+1)(-0.6+2) }{ 3! } (-1)+\frac { (-0.6)(-0.6+1)(-0.6+2)(-0.6+3) }{ 4! } (-3)\)
= 101 - (0.6)8 + \(\frac { (-0.6)(0.4) }{ 2 } (-4)+\frac { (-0.6)(0.4)(1.4) }{ 6 } (-1)+\frac { (0.6)(0.4)(1.4)(2.4)(-3) }{ 24 } \)
= 96.8368
Hence, population for the year 1995 is 96.837 thousands.
4.
Let us calculate the number of men whose wages is less than Rs. 35 by using Newton's forward interpolation formula
xo + nh = x ⇒ 30 + n (10) = 35
⇒ 10n = 35 - 30 = 5
⇒ n = \(\frac{5}{10}\) = 0.5
The difference table is
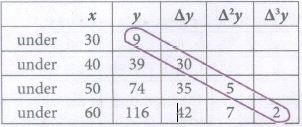
\(\Rightarrow { y }_{ o }+\frac { n }{ n! } \triangle { y }_{ o }+\frac { n(n+1) }{ 2! } { \triangle }^{ 2 }{ y }_{ o }+\frac { n(n+1)(n-2) }{ 3! } { \triangle }^{ 3 }{ (y }_{ o })\)
\(y(35)=9+\frac { 0.5 }{ 1! } (30)+\frac { (0.5)(0.5-1) }{ 2 } (5)+\frac { (0.5)(0.5-1)(0.5-2) }{ 6 } (2)\)
= 9 + 15 - 0.6 + 0.1 = 24 (approximately)
∴ Number of men getting wages between Rs. 30 and Rs. 35 is y(35) - y(30) = 24 - 9 = 15.
5.
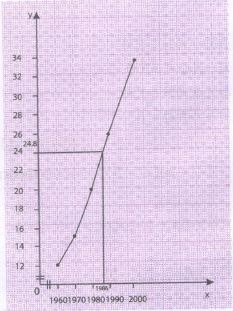
From the graph, it is found that the population for 1986 was 24 thousands.

12th Standard Syllabus & Materials
12th Standard
TN 12th Computer Applications களப்பெயர் முறைமை (DNS) Sample Question Papers Study Material - QB365 Set A
NEW12th Standard
TN 12th Computer Applications வலையமைப்பு எடுத்துக்காட்டுகள் மற்றும் நெறிமுறைகள் Sample Question Papers Study Material - QB365 Set A
NEW12th Standard
TN 12th Computer Applications கணினி வலையமைப்பு ஓர் அறிமுகம் Sample Question Papers Study Material - QB365 Set A
NEW12th Standard
TN 12th Computer Applications PHP-உடன் MySQL-ஐ இணைத்தல் Sample Question Papers Study Material - QB365 Set A



Tamilnadu Stateboard 12th Standard Subjects

Maths

Chemistry

Physics

Biology

Computer Science
Business Maths and Statistics

Economics

Commerce

Accountancy

History

Computer Applications
Biology
Computer Technology
Computer Applications
Computer Science
Business Maths and Statistics
Commerce
Economics
Maths
Chemistry
Physics
Computer Technology
History
Accountancy

Tamil

English

French
Tamilnadu Stateboard Standards


