
 100% FREE ACCESS
12th Standard Syllabus & Materials
12th Standard
TN 12th Computer Applications மின்னணு தரவு பரிமாற்றம் Sample Question Papers Study Material - QB365 Set A
NEW12th Standard
TN 12th Computer Applications மின் - வணிக பாதுகாப்பு அமைப்புகள் Sample Question Papers Study Material - QB365 Set A
NEW12th Standard
TN 12th Computer Applications மின்னணு செலுத்தல் முறைகள் Sample Question Papers Study Material - QB365 Set A
NEW12th Standard
TN 12th Computer Applications மின் - வணிகம் Sample Question Papers Study Material - QB365 Set A
NEW12th Standard
TN 12th Computer Applications திறந்த மூல கருத்துருக்கள் Sample Question Papers Study Material - QB365 Set A
NEW12th Standard
TN 12th Computer Applications வலையமைப்பு வடமிடல் Sample Question Papers Study Material - QB365 Set A

Published on: 03/12/2019
Data Visualization Using Pyplot: Line Chart, Pie Chart and Bar Chart
Download Tamil Nadu 12th Standard Computer Science question papers, model tests, one-mark questions, important questions, and public exam papers in PDF format. Free study materials and answer keys for TN State Board students.
Questions + Answers key
Take MCQ Computer Science Test
1.
Which of the following is a collection of resources assembled to create a single unified visual display?
Info graphics
Dashboard
Graphics
Chats
2.
Which of the following is the representation of information in a graphic format?
Info graphics
Graphics
Dashboard
Charts
3.
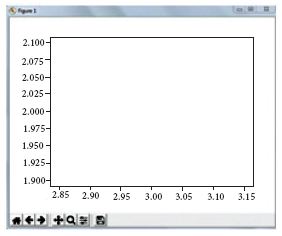
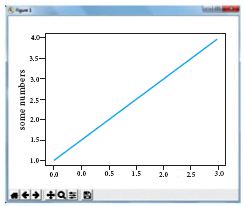
Read the code:
a. import matplotlib.pyplot as plt
b. plt.plot(3,2)
c. plt.show()
Identify the output for the above coding
4.
To install matplotlib, the following function will be typed in your command prompt. What does “-U”represents?
Python –m pip install –U pip
downloading pip to the latest version
upgrading pip to the latest version
removing pip
upgrading matplotlib to the latest version
5.
Identify the package manager for Python packages, or modules.
Matplotlib
PIP
plt.show()
python package
6.
Define scatter plot.
7.
What is matplotlib?
8.
9.
List the types of Visualizations in Matplotlib.
10.
List the general types of data visualization.
11.
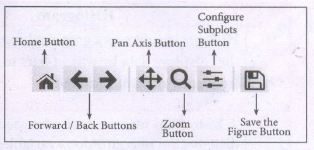
List the buttons in matlibplot window.
12.
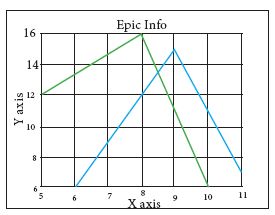
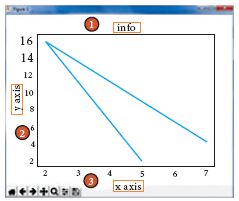
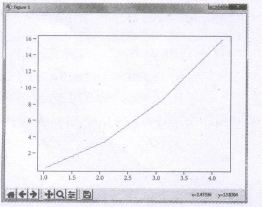
Write a python code to display the following plot.
13.
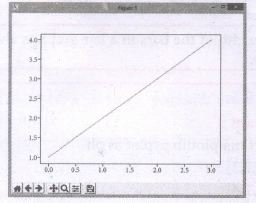
Write a python code to display the following plot.
14.
Write the coding for the following:
a. To check if PIP is Installed in your PC.
b. To Check the version of PIP installed in your PC.
c. To list the packages in matplotlib.
15.
Write any three uses of data visualization.
16.
Write the key differences between Histogram and bar graph.
17.
Explain the various buttons in a matplotlib window.
1.
(b)
Dashboard
2.
(a)
Info graphics
3.
(c)
4.
(b)
upgrading pip to the latest version
5.
(b)
PIP
6.
Scatter plot: A scatter plot is a type of plot that shows the data as a collection of points. The position of a point depends on its two dimensional value, where each value is a position on either the horizontal or vertical dimension.
7.
Matplotlib is the most popular data visualization library in Python. It allows to create charts in few lines of code.
8.
9.
(i) Line plot
(ii) Scatter plot
(iii) Histogram
(iv) Box plot
(v) Bar chart and
(vi) Pie chart
10.
(i) Charts
(ii) Tables
(iii) Graphs
(iv) Maps
(v) Infographics
(vi) Dashboards
11.
12.
Program:
For example, to plot x versus y, you can issue the command:
import matplotlib. pyplot as plt
pIt.plot([1,2,3,4], [1,4,9,16])
plt.show ( )
Output:
13.
Program:
import matplotlib.pyplot as plt
pIt.plot([1, 2, 3, 4]) ,
plt.show ( )
Output:
14.
(a) Check if PIP is Installed:
To check if PIP is already installed in our system, navigate our command line to the location of Python's script directory.
Command:
Python m pip install - U pip.
(b) To check PIP version:
To check the version of PIP in our system, type the command as:
C: \Users\Your Name\App Data\Local\Programs\Python\Python 36-32\Scripts> Pip--version.
(c) List packages:
To view the list of installed packages on our system, use the list command:
C:\Users\Your Name\App Data\Local\Programs\Python\Python 36-32\scripts> Pip list
15.
(i) Data Visualization help users to analyze and interpret the data easily.
(ii) It makes complex data understandable and usable.
(iii) Various Charts in Data Visualization helps to show relationship in the data for one or more variables.
16.
| S.No | Histogram | Bar graph |
| i) | Histogram refers to a graphical representation; that displays data by way of bars to show the frequency of numerical data. | A bar graph is a pictorial representation of data that uses bars to compare different categories of data. |
| ii) | A histogram represents the frequency distribution of continuous variables. | Conversely, a bar graph is a diagrammatic comparison of discrete variables. |
| iii) | Histogram presents numerical data | Bar graph shows categorical data |
| iv) | Items of the histogram are numbers, which are categorised together, to represent ranges of data. | As opposed to the bar graph, items are considered as individual entities. |
| v) | A histogram, this cannot be done, as they are shown in the sequence of classes. | In the case of a bar graph, it is quite common to rearrange the blocks, from highest to lowest. |
| vi) | The width of rectangular blocks in a histogram mayor may not be same | The width of the bars in a bar graph is always same. |
17.
(i) Home Button \(\rightarrow \) The Home Button will help one to begun navigating the chart. If you ever want to return back to the original view, you can click on this.
(ii) Forward/Back buttons \(\rightarrow \) These buttons can be used like the Forward and Back buttons in browser. Click these to move back to the previous point you were at, or forward again.
(iii) Pan Axis \(\rightarrow \) This cross-looking button allows you to click it, and then click and drag graph around.
(iv) Zoom \(\rightarrow \) The Zoom button lets you click on it, then click and drag a square would like to zoom into specifically. Zooming in will require a left click and drag. Zoom out with a right click and drag.
(v) Configure Subplots\(\rightarrow \) This button allows you to configure various spacing options with figure and plot.
(vi) Save Figure \(\rightarrow \)This button will allow you to save figure in various forms

12th Standard Syllabus & Materials
12th Standard
TN 12th Computer Applications களப்பெயர் முறைமை (DNS) Sample Question Papers Study Material - QB365 Set A
NEW12th Standard
TN 12th Computer Applications வலையமைப்பு எடுத்துக்காட்டுகள் மற்றும் நெறிமுறைகள் Sample Question Papers Study Material - QB365 Set A
NEW12th Standard
TN 12th Computer Applications கணினி வலையமைப்பு ஓர் அறிமுகம் Sample Question Papers Study Material - QB365 Set A
NEW12th Standard
TN 12th Computer Applications PHP-உடன் MySQL-ஐ இணைத்தல் Sample Question Papers Study Material - QB365 Set A



Tamilnadu Stateboard 12th Standard Subjects

Maths

Chemistry

Physics

Biology
Computer Science

Business Maths and Statistics

Economics

Commerce

Accountancy

History

Computer Applications
Biology
Computer Technology
Computer Applications
Computer Science
Business Maths and Statistics
Commerce
Economics
Maths
Chemistry
Physics
Computer Technology
History
Accountancy

Tamil

English

French
Tamilnadu Stateboard Standards
