
 100% FREE ACCESS
12th Standard Syllabus & Materials
12th Standard
TN 12th Maths Applications of Matrices and Determinants Sample Question Papers Study Material - QB365 Set A
NEW12th Standard
TN 12th Computer Applications மின்னணு தரவு பரிமாற்றம் Sample Question Papers Study Material - QB365 Set A
NEW12th Standard
TN 12th Computer Applications மின் - வணிக பாதுகாப்பு அமைப்புகள் Sample Question Papers Study Material - QB365 Set A
NEW12th Standard
TN 12th Computer Applications மின்னணு செலுத்தல் முறைகள் Sample Question Papers Study Material - QB365 Set A
NEW12th Standard
TN 12th Computer Applications மின் - வணிகம் Sample Question Papers Study Material - QB365 Set A
NEW12th Standard
TN 12th Computer Applications திறந்த மூல கருத்துருக்கள் Sample Question Papers Study Material - QB365 Set A

Published on: 03/09/2022
QB365 provides a detailed and simple solution for every Possible Creative Questions in Class 12 Economics Subject - Introduction to Statistical Methods and Econometrics , English Medium. It will help Students to get more practice questions, Students can Practice these question papers in addition to score best marks.
Download Tamil Nadu 12th Standard Economics question papers, model tests, one-mark questions, important questions, and public exam papers in PDF format. Free study materials and answer keys for TN State Board students.
Questions + Answers key
Take MCQ Economics Test
1.
List the degrees of correlation corresponding to various values of r.
2.
Find out graphically, if there is any correlation between price yield per plot (qtls); denoted by Y and quantity of fertilizer used (kg); denote by X.
| Plot No: | 1 | 2 | 3 | 4 | 5 | 6 | 7 | 8 | 9 | 10 |
| Y: | 3.5 | 4.3 | 5.3 | 5.8 | 6.4 | 7.3 | 7.2 | 7.5 | 7.8 | 8.3 |
| X: | 6 | 8 | 9 | 12 | 10 | 15 | 17 | 20 | 18 | 24 |
3.
Given the following data on sales (in thousand units) and expenses (in thousand rupees) of a firm for 10 month.
| Month | J | F | M | A | M | J | J | A | S | O |
| Sales: | 50 | 50 | 55 | 60 | 62 | 65 | 68 | 60 | 60 | 50 |
| Expenses | 11 | 13 | 14 | 16 | 16 | 15 | 15 | 14 | 13 | 13 |
a) Make a Scatter Diagram
b) Do you think that there is a correlation between sales and expenses of the firm? Is it positive or negative? Is it high or low?
4.
Enumerate the methodology of econometrics?
5.
Fit two regression equation
X on Y and Y on X for the following data.
x̅ =12, y =10, σy = 0.2, σx = 0.1 and r = 0.85
6.
Distinguish between correlation and regression.
7.
Find the Karl Pearson coefficient of Correlation between X and Y from the following data:
| X: | 10 | 12 | 13 | 16 | 17 | 20 | 25 |
| Y: | 19 | 22 | 26 | 27 | 29 | 33 | 37 |
8.
Estimate the coefficient of correlation with actualmean method for the following data.
| Age of cars in years | 3 | 6 | 8 | 9 | 10 | 6 |
| Cost of Annual Maintains | 1 | 7 | 4 | 6 | 8 | 4 |
9.
Calculate Karl pearson's Cofficient of correlation form the followng data and interpret its value:
| Price:X | 10 | 12 | 14 | 15 | 19 |
| Supply:Y | 40 | 41 | 48 | 60 | 50 |
10.
Explain the steps involved computing the correlation Coefficient.
11.
What are the the Formula for computing Karl Pearson’s Coefficient of correlation?
12.
Distinguish between Qualitative and Quantitative data.
13.
Compare and contrast primary and secondary data.
14.
Discuss in detail about the limitations of statistics.
15.
Discuss the limitations of statistics.
1.
| Value of r | Degree of correlation |
| ±1 | Perfect correlation |
| ±0.90 or more | very high degree of correlation |
| ±0.75 to ± 0.90 | sufficiently high degree of correlation |
| ±0.60 to0.90 | moderate degree of correlation |
| ±0.30 to ± 0.60 | only the possibility of a correlation |
| less than ±0.30 | possibly no correlation |
| 0 | absence of correlation |
2.
The correlogram of the given data is show in Figure 4-3
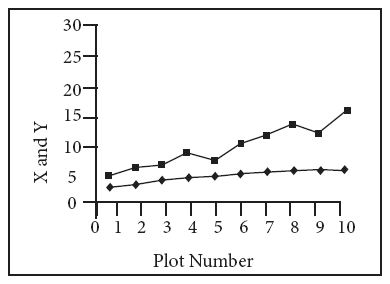
The figure shows that the two curves move in the same direction and, moreover, they are very close to each other, suggesting a close relationship between price yield per plot (qtls) and quantity of fertilizer used (kg).
3.
(a) The Scatter Diagram of the given data is shown in Figure
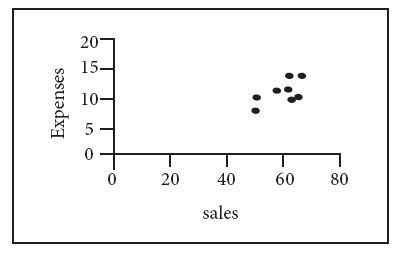
i. Figure shows that the plotted points are close to each other and reveal an upward trend.
ii. So there is a high degree of positive correlation between sales and expenses of the firm.
4.
Broadly speaking, traditional or classical econometric methodology consists of the following steps.
1) Statement of the theory or hypothesis
2) Specification of the mathematical model of the theory
3) Specification of the econometric model of the theory
4) Obtaining the data
5) Estimation of the parameters of the econometric model
6) Hypothesis testing
7) Forecasting or prediction
8) Using the model for control or policy purposes.
5.
he regression X on y is
\((X-\bar { X } )=r\times \frac { \sigma x }{ \sigma y } \times (Y-\bar { Y } )\)
Given x̅̅ = 12, \(\bar { Y } \) = 10
r = 0.85, σx = 0.1 and σy = 0.2
Then substituting the values in formula
(X-12) = 0.85 × (0.1/0.2) σy = 0.2
(X-12) = 0.85 × (0.5) × (Y-10)
X = 0.425 × (Y-10) + 12
X = 0.425y – 4.25 + 12
x = 0.425Y + 7.75
X on Y
Answer
X= 0.425Y + 7.75
The regression Y on X is
\((Y-\bar { Y } )=r\times \frac { \sigma x }{ \sigma y } \times (X-\bar { X } )\)
Given x̅ = 12, \(\bar { Y } \) = 10
r = 0.85, σx = 0.1 and σy =0.2
Then substituting the values in formula
(Y-10) = 0.85 × (0.2/0.1) × ( X–12)
(Y-10) = 0.85 × (2) × ( X–12)
Y = 1.7 × (X-12) + 10
Y = 1.7 X – 20.4 + 10
Y = 1.7 X + 10.4
Y on X
Y = 1.7 X – 10.4
6.
| S.No | Correlation | Regression |
| 1 | Correlation is the relationship between two or more variables, which vary with the other in the same or the opposite direction |
Regression means going back and it is a mathematical measure showing the average relationship between two variables |
| 2 | Both the variables X and Y are random variables |
Both the variables may be random variables |
| 3 | It finds out the degree of relationship between two variables and not the cause and effect relationship. |
It indicates the cause and effect relationship between the variables and establishes functional relationship. |
| 4 | It is used for testing and verifying the relation between two variables and gives limited information |
Besides verification it is used for the prediction of one value, in relation to the other given value. |
| 5 | The coefficient of correlation is a relative measure. The range of relationship lies between –1 and +1 |
Regression coefficient is an absolute figure. If we know the value of the independent variable, we can find the value of the dependent variable |
| 6 | There may be spurious correlation between two variables. |
In regression there is no such spurious regression |
| 7 | It has limited application, because it is confined only to linear relationship between the variables |
It has wider application, as it studies linear and nonlinear relationship between the variables |
| 8 | It is not very useful for further mathematical treatment. |
It is widely used for further mathematical treatment |
7.
Formula for Assumed Mean Deviation method.
\(r=\frac { N\sum { dxdy-(\sum { dx } )(\sum { dy } ) } }{ \sqrt { { N\sum { dx } }^{ 2 }-{ (\sum { dx } ) }^{ 2 } } \sqrt { { N\sum { dy } }^{ 2 }-{ (\sum { y } ) }^{ 2 } } } \)
| S.No | X | Y | (X - A) = dx | (Y - A) = dy | dx2 | dy2 | dxdy |
| 1 | 10 | 19 | -6 | -8 | 36 | 64 | 48 |
| 2 | 12 | 22 | -4 | -5 | 16 | 25 | 20 |
| 3 | 13 | 26 | -3 | -1 | 9 | 1 | 3 |
| 4 | 16 | 27 | 0 | 0 | 0 | 0 | 0 |
| 5 | 17 | 29 | 1 | 2 | 1 | 4 | 2 |
| 6 | 20 | 33 | 4 | 6 | 16 | 36 | 24 |
| 7 | 25 | 37 | 9 | 10 | 81 | 100 | 30 |
| N = 7 | Ex = 113 | ΣY= 193 | Σ | Σ(Y - A) = 1 | Σ(Y - A) = 4 | Σdx2 = 159 | Σdxdy = 187 |
\(\bar { X } =\frac { \sum { } }{ N } =\frac { 113 }{ 7 } =16\frac { 1 }{ 7 } \)
\(\bar { Y } =\frac { \sum { Y } }{ N } =\frac { 193 }{ 7 } =27\frac { 4 }{ 7 } \)
Take the assumed values A = 16 & B =27 therefore dx = X - A → X - 16 and Wdy = → Y - 27
\(r=\frac { N\sum { dxdy-(\sum { dx } )(\sum { dy } ) } }{ \sqrt { { N\sum { dx } }^{ 2 }-{ (\sum { dx } ) }^{ 2 } } \sqrt { { N\sum { dy } }^{ 2 }-{ (\sum { y } ) }^{ 2 } } } \)
\(=\frac { 7X187-1X4 }{ \sqrt { 7X159-{ (1) }^{ 2 } } \sqrt { 7X230-{ (4) }^{ 2 } } } \)
\(=\frac { 1309-4 }{ \sqrt { 1112 } \sqrt { 1610-16 } } \)
\(=\frac { 1305 }{ \sqrt { 1112 } \sqrt { 1594 } } =\frac { 1305 }{ \sqrt { 33.34 } \sqrt { 39.92 } } \)
\(=\frac { 1305 }{ 1330.9 } =0.9865\quad =0.986\)
8.
\(r=\frac { \sum { xy } }{ \sqrt { { \sum { x } }^{ 2 }-\sum { { y }^{ 2 } } } } Where\quad X=(X-\bar { X } ),y=\sum { (y-\bar { y } ) } \)
| S.No | X | X-\(\bar { X } \) X - 7 = X |
(X-X\(\bar { X } \))2= X2 | Y | Y-\(\bar { Y} \) Y - 5 = Y |
(y-\(\bar { Y} \))2 = y2 | XY | |||
| 1 | 3 | -4 | 16 | 1 | -4 | 1 | 16 | |||
| 2 | 6 | -1 | 1 | 7 | 2 | 49 | -2 | |||
| 3 | 8 | +1 | 1 | 4 | -1 | 16 | -1 | |||
| 4 | 9 | 2 | 4 | 6 | 1 | 36 | 2 | |||
| 5 | 10 | 3 | 9 | 8 | 3 | 64 | 9 | |||
| 6 | 6 | -1 | 1 | 4 | -1 | 16 | +1 | |||
| \(\bar { X } \) | 42 6 |
= 7 | 0 | 32 | \(\bar { Y} \) | 42 6 |
= 7 | 0 | 182 | 25 |
| Σx2 = 32 Σy2 = 182 Σxy = 25 | ||||||||||
Applying formula
\(r=\frac { \sum { xy } }{ \sqrt { { \sum { x } }^{ 2 } } \sqrt { \sum { { y }^{ 2 } } } } =\frac { 25 }{ \sqrt { 32 } \sqrt { 182 } } =\frac { 25 }{ 5.66x13.49 } =\frac { 25 }{ 76.35 } \)
r = 0.327, The car is getting old in years the cost of maintenane is also increasing. The age of Car and its maintenance are postively correlated.
9.
Let us take price as X and supply as Y
| Compulation of Pearson's Correlation Coefficient | ||||
| Price: X | Price: Y | XY | X2 | Y2 |
| 10 | 40 | 400 | 100 | 1600 |
| 12 | 41 | 492 | 144 | 1681 |
| 14 | 48 | 672 | 196 | 2304 |
| 15 | 60 | 900 | 2250 | 3600 |
| 19 | 50 | 950 | 3610 | 2560 |
| Σx=70 | Σy=239 | Σxy=3414 | Σx2=1026 | Σy2=11685 |
\(r=\frac { N\sum { XY-(\sum { X } )(\sum { Y } ) } }{ \sqrt { N\sum { { X }^{ 2 }-{ (\sum { X } ) }^{ 2 } } \sqrt { N\sum { { Y }^{ 2 }-{ (\sum { y } ) }^{ 2 } } } } } \)
\(r=\frac { (5x3414)-70x239) }{ \sqrt { (5x1026)-{ (70 })^{ 2 } } \sqrt { 5x11685-{ (239) }^{ 2 } } } \)
\(r=\frac { 17,070-16,730 }{ \sqrt { 230x } \sqrt { 1304 } } \)
\(r=\frac { 340 }{ 547.65 } =+0.621\)
Pirce of the product and supply for the product is positively correlated. When price of the product increases then the supply for the product also incresases.
10.
Procedure for Computing the Correlation Coefficient: (For Direct and Deviation from actual mean method).
Step- 1 Calculate the mean of two series ‘X’’Y’
Step- 2 Calculate the deviations ‘X’ and Y in two series from their respective mean.
Step- 3 Square each deviations of ‘X’ and ‘Y’ then obtain the sum of the Squared deviation,
Step- 4 Multiply each deviation under X with each deviation under Y and obtain the product of ‘xy’. Then obtain the sum of the product of X, Y. Then obtain the sum of the product of x,y is Σxy.
Step- 5 Substitute the value in the formula.
11.
1. \(r=\frac { N\sum { XY-(\sum { X } )(\sum { Y } ) } }{ \sqrt { { N\sum { X } }^{ 2 }-{ (\sum { X } ) }^{ 2 } } \sqrt { { N\sum { Y } }^{ 2 }-{ (\sum { Y } ) }^{ 2 } } } \)
'r' is calculated by Direct Method without taking deviation of terms either from actual mean or assumed mean.
2. r is calculated by taking the Deviation from acutual mean.
\(r=\frac { \sum { xy } }{ { N\sum { X } }^{ 2 }-{ \sum { Y } }^{ 2 } }Where X=(X-\bar { X } ),Y=(\bar { X } )\)
3. 'r' is calculated by taking assumed mean
\(r=\frac { N\sum { dxdy-(\sum { dx } )(\sum { dy } ) } }{ \sqrt { { N\sum { dx } }^{ 2 }-{ (\sum { dx } ) }^{ 2 } } \sqrt { { N\sum { dy } }^{ 2 }-{ (\sum { dy } ) }^{ 2 } } } \)
Where dx refers to deviations of x series from assumed mean (x-x̅), dy refers to
deviations of y series from an assumed mean of (y-y)
1. Σdxdy = Sum of product of the deviations x and y series from their assumed means.
2. Σdx2 = Sum of the squares of the deviations of x series from an assumed mean
3. Σdy2= Sum of the squares of the deviations of y series from an assumed mean
4. Σdx = Sum of the deviation of x series from an assumed mean of x
5. Σdy = Sum of the deviation of y series from an assumed mean of y
12.
1. Find out the actual mean of given data (x̅)
2. Find out the deviation of each value from the mean (x = X - x̅ )
3. Square the deviations and take the total of squared deviations Σx2
4. Divided the total Σx2 by the number of observation \(\left( { \frac { \sum { x } }{ n } }^{ 2 } \right) \)
5. The square root of \(\left( { \frac { \sum { x } }{ n } }^{ 2 } \right) \) is standard deviation.
| BASIS FOR COMPARISON |
QUALITATIVE DATA | QUANTITATIVE DATA |
| Meaning | Qualitative data is the data in which the classification of objects is based on attributes and properties. |
Quantitative data are those that can be quantified in definite units of measurement |
| Examples | Eg. Gender, Community, honesty | Age, income, number of firms etc |
| Approach | Subjective | Objective |
| Collection of data | Unstructured | Structured |
| Sample | Small number of nonrepresentative samples |
Large number of representative samples |
| Outcome | Develops initial understanding. | Recommends final course of action |
13.
| BASIS FOR COMPARISON |
PRIMARY DATA | SECONDARY DATA |
| Meaning | Those data which do not ready exist in any form, and thus have to be collected for the first time from the primary source(s). | They already exist in zome form: published or npublished in an identifiable secondary source. |
| Nature | Real time data - first-time collected | Past data - available from published source(s) |
| Process | Very involved | Quick and easy |
| Source | Surveys, observations, experiments, questionnaire, personal interview, etc. |
Government publications, websites, books, journal articles, internal records etc. Eg. Data from CSO, NSSO, RBI |
| Cost-effectiveness | Expensive | Economical |
| Collection time | Long | Short |
| Form | Crude form | Refined form |
| Accuracy and Reliability | More | Relatively less |
14.
1. Statistics is not suitable to the study of qualitative phenomenon:
i. Since statistics is basically a science and deals with a set of numerical data.
ii. It is applicable to the study of quantitative measurements.
iii. As a matter of fact, qualitative aspects like empowerment, leadership, honesty, poverty, intelligence etc., cannot be expressed numerically and statistical analysis cannot be directly applied on these qualitative phenomena.
2. Statistical laws are not exact:
i. It is well known that mathematical and physical sciences are exact.
ii. But statistical laws are not exact and statistical laws are only approximations. Statistical conclusions are not universally true.
iii. They are true only on an average.
3. Statistics table may be misused:
i. Statistics must be used only by experts; otherwise, statistical methods are the most dangerous tools on the hands of the inexpert.
ii. The use of statistical tools by the inexperienced and untrained persons might lead to wrong conclusions.
4. Statistics is only one of the methods of studying a problem:
i. Statistical method does not provide complete solution of the problems because problems are to be studied taking the background of the countries culture, philosophy, religion etc., into consideration.
ii. Thus the statistical study should be supplemented by other evidences.
15.
1. Statistics is not suitable to the study of qualitative phenomenon:
Since statistics is basically a science and deals with a set of numerical data. It is applicable to the study of quantitative measurements.
2. Statistical laws are not exact:
It is well known that mathematical and physical sciences are exact. But statistical laws are not exact and statistical laws are only approximations.
3. Statistics table may be misused:
Statistics must be used only by experts; otherwise, statistical methods are the most dangerous tools on the hands of the inexpert.
4. Statistics is only one of the methods of studying a problem:
Statistical method does not provide complete solution of the problems because problems are to be studied taking the background of the countries culture, philosophy, religion etc., into consideration.

12th Standard Syllabus & Materials
12th Standard
TN 12th Computer Applications வலையமைப்பு வடமிடல் Sample Question Papers Study Material - QB365 Set A
NEW12th Standard
TN 12th Computer Applications களப்பெயர் முறைமை (DNS) Sample Question Papers Study Material - QB365 Set A
NEW12th Standard
TN 12th Computer Applications வலையமைப்பு எடுத்துக்காட்டுகள் மற்றும் நெறிமுறைகள் Sample Question Papers Study Material - QB365 Set A
NEW12th Standard
TN 12th Computer Applications கணினி வலையமைப்பு ஓர் அறிமுகம் Sample Question Papers Study Material - QB365 Set A



Tamilnadu Stateboard 12th Standard Subjects

Maths

Chemistry

Physics

Biology

Computer Science

Business Maths and Statistics
Economics

Commerce

Accountancy

History

Computer Applications
Biology
Computer Technology
Computer Applications
Computer Science
Business Maths and Statistics
Commerce
Economics
Maths
Chemistry
Physics
Computer Technology
History
Accountancy

Tamil

English

French
Tamilnadu Stateboard Standards
