
 100% FREE ACCESS
12th Standard Syllabus & Materials
12th Standard
TN 12th Maths Applications of Matrices and Determinants Sample Question Papers Study Material - QB365 Set A
NEW12th Standard
TN 12th Computer Applications மின்னணு தரவு பரிமாற்றம் Sample Question Papers Study Material - QB365 Set A
NEW12th Standard
TN 12th Computer Applications மின் - வணிக பாதுகாப்பு அமைப்புகள் Sample Question Papers Study Material - QB365 Set A
NEW12th Standard
TN 12th Computer Applications மின்னணு செலுத்தல் முறைகள் Sample Question Papers Study Material - QB365 Set A
NEW12th Standard
TN 12th Computer Applications மின் - வணிகம் Sample Question Papers Study Material - QB365 Set A
NEW12th Standard
TN 12th Computer Applications திறந்த மூல கருத்துருக்கள் Sample Question Papers Study Material - QB365 Set A

Published on: 13/05/2022
QB365 provides detailed and simple solution for every Book back Questions in class 12 Business Maths Subject. It will helps to get more idea about question pattern in every book back questions with solution.
latest Book back QuestionsDownload Tamil Nadu 12th Standard Business Maths and Statistics question papers, model tests, one-mark questions, important questions, and public exam papers in PDF format. Free study materials and answer keys for TN State Board students.
Questions + Answers key
Take MCQ Business Maths and Statistics Test
1.
The following figures relates to the profits of a commercial concern for 8 years
| Year | 1986 | 1987 | 1988 | 1989 | 1990 | 1991 | 1992 | 1993 |
| Profit (Rs.) | 15,420 | 15,470 | 15,520 | 21,020 | 26,500 | 31,950 | 35,600 | 34,900 |
Find the trend of profits by the method of three yearly moving averages.
2.
Explain the method of fitting a straight line.
3.
Calculate four-yearly moving averages of number of students studying in a higher secondary school in a particular city from the following data.
| Year | 2001 | 2002 | 2003 | 2004 | 2005 | 2006 | 2007 | 2008 | 2009 |
| Sales | 124 | 120 | 135 | 140 | 145 | 158 | 162 | 170 | 175 |
4.
Fit a trend line by the method of semi-averages for the given data.
| Year | 2000 | 2001 | 2002 | 2003 | 2004 | 2005 | 2006 |
| Production | 105 | 115 | 120 | 100 | 110 | 125 | 135 |
5.
You are given below the values of sample mean ( \(\bar{X}\) ) and the range ( R ) for ten samples of size 5 each. Draw mean chart and comment on the state of control of the process.
| Sample number | 1 | 2 | 3 | 4 | 5 | 6 | 7 | 8 | 9 | 10 |
| \(\overset{-}{X}\) | 43 | 49 | 37 | 44 | 45 | 37 | 51 | 46 | 43 | 47 |
| R | 5 | 6 | 5 | 7 | 7 | 4 | 8 | 6 | 4 | 6 |
Given the following control chart constraint for : n = 5, A2 = 0.58, D3 = 0 and D4 = 2.115
1.
| Year X | Profit (Rs) Y | 3-yearly moving total | 3-yearly moving average |
| 1986 | 15420} | - | - |
| 1987 | {15470} | 46410 | 15470 (∴ 46410 / 3) |
| 1988 | {{11520} | 52010 | 17336.666 |
| 1989 | {{21020 | 63040 | 21013.333 |
| 1990 | {{26500 | 79470 | 26490 |
| 1991 | 31950 | 94050 | 31350 |
| 1992 | 35600 | 102450 | 34150 |
| 1993 | 34900 | - | - |
2.
The line of least fit is a line from which the sum of the deviations of various points is zero. This is the best method for obtaining the trend values.
(i) The straight line trend is represented by
Y = a + b X ...(1)
where Y is the actual value and X is time
(ii) The constants 'a' and 'b' are estimated by solving the following two normal Equations
\(\sum\) Y = n a + b \(\sum\) X
\(\sum\) XY = a\(\sum\) X + b \(\sum\) X2 where n is the number of years given in the data.
(iii) By substituting the values of 'a' and 'b' in the trend equation (1), we get the line of best fit.
3.
Computation of four- yearly moving averages.
| Year | Sales | 4-yearly centered moving total | 4-yearly moving Average | 4-yearly centered moving Average |
| 2001 | 124 | --- | -- | -- |
| 2002 | 120 | -- | -- | -- |
| 519 | 129.75 | |||
| 2003 | 135 | -- | 139.37 | |
| 540 | 135 | |||
| 2004 | 140 | -- | 139.75 | |
| 578 | 144.50 | |||
| 2005 | 145 | -- | 147.87 | |
| 605 | 151.25 | |||
| 2006 | 158 | -- | 162.50 | |
| 635 | 158.75 | |||
| 2007 | 162 | -- | 162.50 | |
| 665 | 166.25 | |||
| 2008 | 170 | -- | -- | - |
| 2009 | 175 | -- | -- | - |
4.
Since the number of years is odd(seven), we will leave the middle year’s production value and obtain the averages of first three years and last three years.
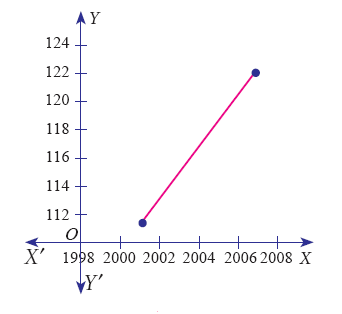
| Year | Production | Average |
| 2000 | 105 | \(\frac{105+115+120}{3}=113.33\) |
| 2001 | 115 | |
| 2002 | 120 | |
| 2003 | 100(left out) | |
| 2004 | 110 | \(\frac{110+125+135}{3}=123.33\) |
| 2005 | 125 | |
| 2006 | 135 |
5.
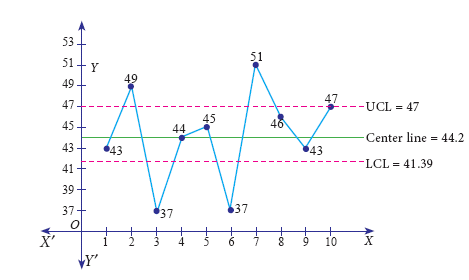
\(\overset { = }{ X } =\frac { \sum { \bar { X } } }{ 10 } =\frac { 442 }{ 10 } =44.2\)
\(\bar { R } =\frac { \sum { R } }{ n } =\frac { 58 }{ 10 } =5.8\)
\(UCL=\overset { = }{ X } +{ A }_{ 2 }\bar { R } \)
= 44.2 + 0.483(5.8) = 47.00
\(CL=\overset { = }{ X } =44.2\)
\(LCL=\overset { = }{ X } -{ A }_{ 2 }\bar { R } =44.2-0.483(5.8)=41.39\)
The above diagram shows all the three control lines with the data points plotted, since four points falls out of the control limits, we can say that the process is out of control.

12th Standard Syllabus & Materials
12th Standard
TN 12th Computer Applications வலையமைப்பு வடமிடல் Sample Question Papers Study Material - QB365 Set A
NEW12th Standard
TN 12th Computer Applications களப்பெயர் முறைமை (DNS) Sample Question Papers Study Material - QB365 Set A
NEW12th Standard
TN 12th Computer Applications வலையமைப்பு எடுத்துக்காட்டுகள் மற்றும் நெறிமுறைகள் Sample Question Papers Study Material - QB365 Set A
NEW12th Standard
TN 12th Computer Applications கணினி வலையமைப்பு ஓர் அறிமுகம் Sample Question Papers Study Material - QB365 Set A



Tamilnadu Stateboard 12th Standard Subjects

Maths

Chemistry

Physics

Biology

Computer Science
Business Maths and Statistics

Economics

Commerce

Accountancy

History

Computer Applications
Biology
Computer Technology
Computer Applications
Computer Science
Business Maths and Statistics
Commerce
Economics
Maths
Chemistry
Physics
Computer Technology
History
Accountancy

Tamil

English

French
Tamilnadu Stateboard Standards


