
 100% FREE ACCESS
12th Standard Syllabus & Materials
12th Standard
TN 12th Computer Applications மின்னணு தரவு பரிமாற்றம் Sample Question Papers Study Material - QB365 Set A
NEW12th Standard
TN 12th Computer Applications மின் - வணிக பாதுகாப்பு அமைப்புகள் Sample Question Papers Study Material - QB365 Set A
NEW12th Standard
TN 12th Computer Applications மின்னணு செலுத்தல் முறைகள் Sample Question Papers Study Material - QB365 Set A
NEW12th Standard
TN 12th Computer Applications மின் - வணிகம் Sample Question Papers Study Material - QB365 Set A
NEW12th Standard
TN 12th Computer Applications திறந்த மூல கருத்துருக்கள் Sample Question Papers Study Material - QB365 Set A
NEW12th Standard
TN 12th Computer Applications வலையமைப்பு வடமிடல் Sample Question Papers Study Material - QB365 Set A

Published on: 23/06/2021
QB365 provides detailed and simple solution for every
Creative Questions in class 12 Business Maths Subject.It will helps to get more idea about question pattern in
every Creative questions with solution.
Download Tamil Nadu 12th Standard Business Maths and Statistics question papers, model tests, one-mark questions, important questions, and public exam papers in PDF format. Free study materials and answer keys for TN State Board students.
Questions + Answers key
Take MCQ Business Maths and Statistics Test
1.
The followingdata relateto the life(inhours) of 10 samples of 6 electricbulbs each drawn at an intervalof one hour from a production process.Draw the controlchart for \(\overline { X } \) and \(\overline { R } \) and comment.
| Sample No | Lifetime (inhour) | |||||
| 1 | 2 | 3 | 4 | 5 | 6 | |
| 1 | 620 | 687 | 666 | 689 | 738 | 686 |
| 2 | 501 | 585 | 524 | 585 | 653 | 668 |
| 3 | 673 | 701 | 686 | 567 | 619 | 660 |
| 4 | 646 | 626 | 572 | 628 | 631 | 743 |
| 5 | 494 | 984 | 659 | 643 | 660 | 640 |
| 6 | 634 | 755 | 625 | 582 | 683 | 555 |
| 7 | 619 | 710 | 664 | 693 | 770 | 534 |
| 8 | 630 | 723 | 614 | 535 | 550 | 570 |
| 9 | 482 | 791 | 533 | 612 | 497 | 499 |
| 10 | 706 | 524 | 626 | 503 | 661 | 754 |
(For n = 6,A2= 0.483,D3 = 0,D4 = 2.004)
2.
Calculate Fisher's ideal index from the following data and verify that it satisfies both time reversal and factor reversal test
| Commodity | Price | Quantity | ||
| 1985 | 1986 | 1985 | 1986 | |
| A | 8 | 20 | 50 | 60 |
| B | 2 | 6 | 15 | 10 |
| C | 1 | 2 | 20 | 25 |
| D | 2 | 5 | 10 | 8 |
| E | 1 | 5 | 40 | 30 |
3.
Compute
(i) Laspeyre's
(ii) Paasche's
(iii) Fisher's price index number for 2000 from the following data.
| Commodity | Price | Quantity | ||
| 1990 | 2000 | 1990 | 2000 | |
| A | 2 | 4 | 8 | 6 |
| B | 5 | 6 | 10 | 5 |
| C | 4 | 5 | 14 | 10 |
| D | 2 | 2 | 19 | 13 |
4.
From the data given below, calculate seasonal indices.
| Quarter | Year | ||||
| 1984 | 1985 | 1986 | 1987 | 1988 | |
| I | 40 | 42 | 41 | 45 | 44 |
| II | 35 | 37 | 35 | 36 | 38 |
| III | 38 | 39 | 38 | 36 | 38 |
| IV | 40 | 38 | 40 | 41 | 42 |
5.
Fit a straight line trend to the following data using the method of least square. Estimate the trend for 2007.
| year | 2000 | 2001 | 2002 | 2003 | 2004 |
| Sales (in tonnes) | 1 | 1.8 | 3.3 | 4.5 | 6.3 |
1.
| Sample No | Total | \(\overline { X } \) | R = Xmax - Xmin |
| 1 | 4086 | 681 | 118 |
| 2 | 3516 | 586 | 167 |
| 3 | 3906 | 651 | 134 |
| 4 | 3846 | 641 | 171 |
| 5 | 4080 | 680 | 490 |
| 6 | 3834 | 639 | 200 |
| 7 | 3990 | 665 | 236 |
| 8 | 3622 | 604 | 188 |
| 9 | 3414 | 569 | 309 |
| 10 | 3774 | 629 | 251 |
| 6345 | 2264 |
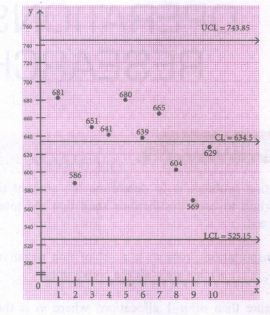
\(\bar{\bar{X}}\) = 634.5, \(\bar{R}\) = 226.4
Control limits for \(\overline { X } \) - chart are
UCL = \(\bar{\bar{X}}\) + A2\(\bar{R}\)
= 634.5+ 0.483x 226.4
= 743.85
CL = 634.5
LCL = \(\bar{\bar{X}}\)- A2\(\bar{R}\) = 525.15
Control limits of R-chart are
UCL = D4\(\bar{R}\) = 2.004 x226.4
= 453.7056
CL = 226.4
LCL = D3\(\bar{R}\) = 0
\(\overline { X } \)-chart
R - chart
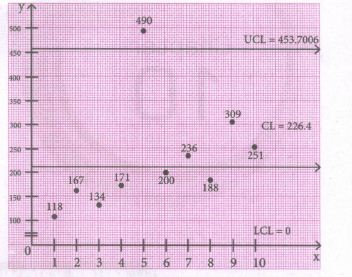
Conclusion: Since one point in R-chart lie outside the control limits, the given system is not in control
2.
| Commodity | 1985 | 1986 | ||
| p0 | q0 | p1 | q1 | |
| A | 8 | 50 | 20 | 60 |
| B | 2 | 15 | 6 | 10 |
| C | 1 | 20 | 2 | 25 |
| D | 2 | 10 | 5 | 8 |
| E | 1 | 40 | 5 | 30 |
| p1q0 | p0q0 | p1q1 | p0q1 |
| 1000 | 410 | 1200 | 480 |
| 90 | 30 | 60 | 20 |
| 40 | 20 | 50 | 25 |
| 50 | 20 | 40 | 16 |
| 200 | 40 | 150 | 30 |
| 1380 | 510 | 1500 | 571 |
Fisher's Ideal Index = \(\sqrt\frac{{\Sigma p_1q_0}\times{\Sigma p_1q_1}}{{\Sigma p_0q_0}\times{\Sigma p_0q_1}}\times100\)
\(= \sqrt\frac{1380\times1500}{510\times571}\times100\)
= 266.61
Time reversaltest:
\(P_{01}\times P_{10}=\sqrt\frac{{\Sigma p_1q_0}\times{\Sigma p_1q_1}\times{\Sigma p_0q_1}\times{\Sigma p_0q_0}}{{\Sigma p_0q_0}\times{\Sigma p_0q_1}\times{\Sigma p_1q_1}\times{\Sigma p_1q_0}}\)
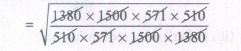
= \(\sqrt{1}=1\)
Hence, time reversal test is satisfied.
Factor reversaltest:
\(P_{01}\times Q_{01}=\sqrt\frac{{\Sigma p_1q_0}\times{\Sigma p_1q_1}\times{\Sigma q_1p_0}\times{\Sigma q_1p_1}}{{\Sigma p_0q_0}\times{\Sigma p_0q_1}\times{\Sigma q_0p_0}\times{\Sigma q_0p_1}}\)

\(P_{01}\times Q_{01}=\frac{{\Sigma p_1q_1}}{{\Sigma p_0q_0}}\)
Hence, Fisher's ideal index satisfies factor reversal test also.
3.
| Commodity | Price | Quantity | ||
| Base year p0 | Current year p1 | Base year q0 | Current year q1 | |
| A | 2 | 4 | 8 | 6 |
| B | 5 | 6 | 10 | 5 |
| C | 4 | 5 | 14 | 10 |
| D | 2 | 2 | 19 | 13 |
| p0q0 | p1q0 | p0q1 | p1q1 |
| 16 | 32 | 12 | 24 |
| 50 | 60 | 25 | 30 |
| 56 | 70 | 40 | 50 |
| 38 | 38 | 26 | 26 |
| 160 | 200 | 103 | 130 |
(i) Laspeyre's index number
\(P_{01}^{L} = \frac{\Sigma p_1q_0}{\Sigma p_0q_0}\times100\)
\(=\frac{200}{160}\times100=125\)
(ii) Paasche's Price index number
\(P_{01}^{P} = \frac{\Sigma p_1q_1}{\Sigma p_0q_1}\times100\)
\(=\frac{130}{103}\times100=126.21\)
(iii) Fisher's price index number
\(P_{01}^{F} =\sqrt {{P_{01}^{L}}\times{P_{01}^{P}}}=125.6\)
4.
| Year | Quarters | |||
| I | II | III | IV | |
| 1984 | 40 | 35 | 38 | 40 |
| 1985 | 42 | 37 | 39 | 38 |
| 1986 | 41 | 35 | 38 | 40 |
| 1987 | 44 | 38 | 38 | 42 |
| 1988 | 44 | 38 | 38 | 42 |
| Total | 212 | 181 | 189 | 201 |
| Average | 42.4 | 36.2 | 37.8 | 40.2 |
Grand average = \(\frac{42.4+36.2+37.8+40.2}{4}\)
= 39.15
Seasonal Index (S.1) = \(\frac{Quarterlyaverage}{Grand average}\times 100\)
Hence,
S.1 or I quarter = \(\frac{42.4}{39.15}\times100=108.30\)
S.1 or II quarter = \(\frac{36.2}{39.15}\times100=92.54\)
S.1 or III quarter = \(\frac{37.8}{39.15}\times100=96.55\)
S.1 or IV quarter = \(\frac{40.2}{39.15}\times100=102.68\)
5.
| Year x | Sales y | X = x-2002 | XY | X2 |
| 2000 | 1 | -2 | -2 | 4 |
| 2001 | 1.8 | -1 | -1.8 | 1 |
| 2002 | 3.3 | 0 | 0 | 0 |
| 2003 | 4.5 | 1 | 4.5 | 1 |
| 2004 | 6.3 | 2 | 12.6 | 4 |
| 16.9 | 0 | 13.3 | 10 |
Let the required equation of the straight line trend is
y = a + bX
Since Σx = 0. \(a = \frac{\Sigma y}{x} = \frac{16.9}{5}\)
\(b = \frac{\Sigma xy}{\Sigma x^2} = \frac{13.3}{10} = 1.33\)
Hence, the straight line trend is
y = 3.38 + 1.33 (x - 2002)
∴ The trend for 2007 is
yt = 3.38 + 1.33 (2007 - 2002)
⇒ yt = 3.38 + 1.33 (5)
⇒ yt = 3.38 + 6.65
⇒ yt = 10.03

12th Standard Syllabus & Materials
12th Standard
TN 12th Computer Applications களப்பெயர் முறைமை (DNS) Sample Question Papers Study Material - QB365 Set A
NEW12th Standard
TN 12th Computer Applications வலையமைப்பு எடுத்துக்காட்டுகள் மற்றும் நெறிமுறைகள் Sample Question Papers Study Material - QB365 Set A
NEW12th Standard
TN 12th Computer Applications கணினி வலையமைப்பு ஓர் அறிமுகம் Sample Question Papers Study Material - QB365 Set A
NEW12th Standard
TN 12th Computer Applications PHP-உடன் MySQL-ஐ இணைத்தல் Sample Question Papers Study Material - QB365 Set A



Tamilnadu Stateboard 12th Standard Subjects

Maths

Chemistry

Physics

Biology

Computer Science
Business Maths and Statistics

Economics

Commerce

Accountancy

History

Computer Applications
Biology
Computer Technology
Computer Applications
Computer Science
Business Maths and Statistics
Commerce
Economics
Maths
Chemistry
Physics
Computer Technology
History
Accountancy

Tamil

English

French
Tamilnadu Stateboard Standards


