
 100% FREE ACCESS
12th Standard Syllabus & Materials
12th Standard
TN 12th Computer Applications மின்னணு தரவு பரிமாற்றம் Sample Question Papers Study Material - QB365 Set A
NEW12th Standard
TN 12th Computer Applications மின் - வணிக பாதுகாப்பு அமைப்புகள் Sample Question Papers Study Material - QB365 Set A
NEW12th Standard
TN 12th Computer Applications மின்னணு செலுத்தல் முறைகள் Sample Question Papers Study Material - QB365 Set A
NEW12th Standard
TN 12th Computer Applications மின் - வணிகம் Sample Question Papers Study Material - QB365 Set A
NEW12th Standard
TN 12th Computer Applications திறந்த மூல கருத்துருக்கள் Sample Question Papers Study Material - QB365 Set A
NEW12th Standard
TN 12th Computer Applications வலையமைப்பு வடமிடல் Sample Question Papers Study Material - QB365 Set A

Published on: 13/05/2022
QB365 provides detailed and simple solution for every Creative Questions in class 12 Economics Subject. It will helps to get more idea about question pattern in every Creative questions with solution.
latest Creative QuestionsDownload Tamil Nadu 12th Standard Economics question papers, model tests, one-mark questions, important questions, and public exam papers in PDF format. Free study materials and answer keys for TN State Board students.
Questions + Answers key
Take MCQ Economics Test1.
The height of a child increases at a rate given in the table below. Fit the straight line using the method of least-square and calculate the average increase and the standard error of estimate.
| Month | 1 | 2 | 3 | 4 | 5 | 6 | 7 | 8 | 9 | 10 |
| Height: | 52.5 | 58.7 | 65 | 70.2 | 75.4 | 81.1 | 87.2 | 95.5 | 102.2 | 108.4 |
2.
The data on price and quantity purchased relating to a commodity for 5 months is given below: Find the Pearsonian correlation coefficient between prices and quantity and comment on its sign and magnitude.
| Month | January | Febuary | March | April | May |
| Prices (Rs): | 10 | 10 | 11 | 12 | 12 |
| Quantity (Kg): | 5 | 6 | 4 | 3 | 3 |
3.
Given the following data on sales (in thousand units) and expenses (in thousand rupees) of a firm for 10 month.
| Month | J | F | M | A | M | J | J | A | S | O |
| Sales: | 50 | 50 | 55 | 60 | 62 | 65 | 68 | 60 | 60 | 50 |
| Expenses | 11 | 13 | 14 | 16 | 16 | 15 | 15 | 14 | 13 | 13 |
a) Make a Scatter Diagram
b) Do you think that there is a correlation between sales and expenses of the firm? Is it positive or negative? Is it high or low?
4.
Find the Karl Pearson coefficient of Correlation between X and Y from the following data:
| X: | 10 | 12 | 13 | 16 | 17 | 20 | 25 |
| Y: | 19 | 22 | 26 | 27 | 29 | 33 | 37 |
5.
Calculate Karl pearson's Cofficient of correlation form the followng data and interpret its value:
| Price:X | 10 | 12 | 14 | 15 | 19 |
| Supply:Y | 40 | 41 | 48 | 60 | 50 |
1.
For Egression Calculations, we draw the following table
| Month(X) | Height(Y) | X2 | XY |
| 1 | 52.5 | 1 | 52.5 |
| 2 | 58.7 | 4 | 117.4 |
| 3 | 65.0 | 9 | 195.0 |
| 4 | 70.2 | 16 | 280.8 |
| 5 | 75.4 | 25 | 377.0 |
| 6 | 81.1 | 36 | 486.6 |
| 7 | 87.2 | 49 | 610.4 |
| 8 | 95.5 | 64 | 764.0 |
| 9 | 102.2 | 81 | 919.8 |
| 10 | 108.4 | 100 | 1084.0 |
| ΣX = 55 | ΣU = 796.2 | ΣX2 = 385 | ΣXY= 4887.5 |
Considering the regression line as Y = a + bX, we can obtain the values of a and b from the above values.
\(a=\frac { \sum { Y } \sum { X } ^{ 2 } }{ { N\sum { X } }^{ 2 }-{ (\sum { X } ) }^{ 2 } } \)
\(a=\frac { 796.2x385-55x4887.5 }{ 10x385-55x55 } \)
\(b=\frac { N\sum { XY-\sum { X } \sum { Y } } }{ N{ \sum { X } }^{ 2 }-{ (\sum { X } ) }^{ 2 } } \)
\(a=\frac { 10x4887.5-55x796.2 }{ 10x385-55x55 } \)
= 6.16
Hence the regression line can be written as
Y = 45.73 + 6.16x
2.
Let price of the commodity be denoted by X and quantity be denoted by Y
Calculations for Coefficient of Correlation
| Month | X | Y | X2 | Y2 | XY |
| 1 | 10 | 5 | 100 | 25 | 50 |
| 2 | 10 | 6 | 100 | 36 | 60 |
| 3 | 11 | 4 | 121 | 16 | 44 |
| 4 | 12 | 3 | 144 | 9 | 36 |
| 5 | 12 | 3 | 144 | 9 | 36 |
| ΣX=55 | ΣY=21 | ΣX2=609 | ΣY2=95 | ΣXY=226 |
\({ r }_{ xy }=\frac { N\sum { XY-\sum { X\sum { Y } } } }{ \sqrt { N{ \sum { X } }^{ 2 }-{ (\sum { X } ) }^{ 2 } } \sqrt { N{ \sum { Y } }^{ 2 }-{ \left( \sum { Y } \right) }^{ 2 } } } \)
\({ r }_{ xy }=\frac { 5x226-55x21 }{ \sqrt { (5x609-55x55)(5x95-21x21) } } \)
\({ r }_{ xy }=\frac { 1130-1155 }{ \sqrt { 20x34 } } \)
\({ r }_{ xy }=\frac { 25 }{ \sqrt { 680 } } \)
\({ r }_{ xy }=-0.98\)
The negative sign of r indicate negative correlation and its large magnitude indicate a very
1. high degree of correlation.
2. So there is a high degree of negative correlation between pricesand quantity demanded.
3.
(a) The Scatter Diagram of the given data is shown in Figure
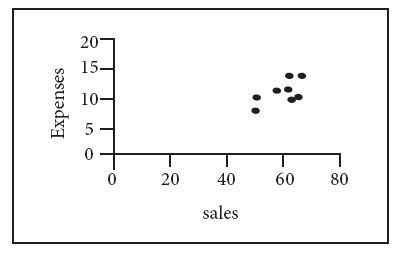
i. Figure shows that the plotted points are close to each other and reveal an upward trend.
ii. So there is a high degree of positive correlation between sales and expenses of the firm.
4.
Formula for Assumed Mean Deviation method.
\(r=\frac { N\sum { dxdy-(\sum { dx } )(\sum { dy } ) } }{ \sqrt { { N\sum { dx } }^{ 2 }-{ (\sum { dx } ) }^{ 2 } } \sqrt { { N\sum { dy } }^{ 2 }-{ (\sum { y } ) }^{ 2 } } } \)
| S.No | X | Y | (X - A) = dx | (Y - A) = dy | dx2 | dy2 | dxdy |
| 1 | 10 | 19 | -6 | -8 | 36 | 64 | 48 |
| 2 | 12 | 22 | -4 | -5 | 16 | 25 | 20 |
| 3 | 13 | 26 | -3 | -1 | 9 | 1 | 3 |
| 4 | 16 | 27 | 0 | 0 | 0 | 0 | 0 |
| 5 | 17 | 29 | 1 | 2 | 1 | 4 | 2 |
| 6 | 20 | 33 | 4 | 6 | 16 | 36 | 24 |
| 7 | 25 | 37 | 9 | 10 | 81 | 100 | 30 |
| N = 7 | Ex = 113 | ΣY= 193 | Σ | Σ(Y - A) = 1 | Σ(Y - A) = 4 | Σdx2 = 159 | Σdxdy = 187 |
\(\bar { X } =\frac { \sum { } }{ N } =\frac { 113 }{ 7 } =16\frac { 1 }{ 7 } \)
\(\bar { Y } =\frac { \sum { Y } }{ N } =\frac { 193 }{ 7 } =27\frac { 4 }{ 7 } \)
Take the assumed values A = 16 & B =27 therefore dx = X - A → X - 16 and Wdy = → Y - 27
\(r=\frac { N\sum { dxdy-(\sum { dx } )(\sum { dy } ) } }{ \sqrt { { N\sum { dx } }^{ 2 }-{ (\sum { dx } ) }^{ 2 } } \sqrt { { N\sum { dy } }^{ 2 }-{ (\sum { y } ) }^{ 2 } } } \)
\(=\frac { 7X187-1X4 }{ \sqrt { 7X159-{ (1) }^{ 2 } } \sqrt { 7X230-{ (4) }^{ 2 } } } \)
\(=\frac { 1309-4 }{ \sqrt { 1112 } \sqrt { 1610-16 } } \)
\(=\frac { 1305 }{ \sqrt { 1112 } \sqrt { 1594 } } =\frac { 1305 }{ \sqrt { 33.34 } \sqrt { 39.92 } } \)
\(=\frac { 1305 }{ 1330.9 } =0.9865\quad =0.986\)
5.
Let us take price as X and supply as Y
| Compulation of Pearson's Correlation Coefficient | ||||
| Price: X | Price: Y | XY | X2 | Y2 |
| 10 | 40 | 400 | 100 | 1600 |
| 12 | 41 | 492 | 144 | 1681 |
| 14 | 48 | 672 | 196 | 2304 |
| 15 | 60 | 900 | 2250 | 3600 |
| 19 | 50 | 950 | 3610 | 2560 |
| Σx=70 | Σy=239 | Σxy=3414 | Σx2=1026 | Σy2=11685 |
\(r=\frac { N\sum { XY-(\sum { X } )(\sum { Y } ) } }{ \sqrt { N\sum { { X }^{ 2 }-{ (\sum { X } ) }^{ 2 } } \sqrt { N\sum { { Y }^{ 2 }-{ (\sum { y } ) }^{ 2 } } } } } \)
\(r=\frac { (5x3414)-70x239) }{ \sqrt { (5x1026)-{ (70 })^{ 2 } } \sqrt { 5x11685-{ (239) }^{ 2 } } } \)
\(r=\frac { 17,070-16,730 }{ \sqrt { 230x } \sqrt { 1304 } } \)
\(r=\frac { 340 }{ 547.65 } =+0.621\)
Pirce of the product and supply for the product is positively correlated. When price of the product increases then the supply for the product also incresases.

12th Standard Syllabus & Materials
12th Standard
TN 12th Computer Applications களப்பெயர் முறைமை (DNS) Sample Question Papers Study Material - QB365 Set A
NEW12th Standard
TN 12th Computer Applications வலையமைப்பு எடுத்துக்காட்டுகள் மற்றும் நெறிமுறைகள் Sample Question Papers Study Material - QB365 Set A
NEW12th Standard
TN 12th Computer Applications கணினி வலையமைப்பு ஓர் அறிமுகம் Sample Question Papers Study Material - QB365 Set A
NEW12th Standard
TN 12th Computer Applications PHP-உடன் MySQL-ஐ இணைத்தல் Sample Question Papers Study Material - QB365 Set A



Tamilnadu Stateboard 12th Standard Subjects

Maths

Chemistry

Physics

Biology

Computer Science

Business Maths and Statistics
Economics

Commerce

Accountancy

History

Computer Applications
Biology
Computer Technology
Computer Applications
Computer Science
Business Maths and Statistics
Commerce
Economics
Maths
Chemistry
Physics
Computer Technology
History
Accountancy

Tamil

English

French
Tamilnadu Stateboard Standards



