
 100% FREE ACCESS
6th Standard CBSE Syllabus & Materials
6th Standard CBSE
CBSE 6th Social Science The Value of Work - New Sample Question Papers Study Material - QB365 Set A
NEW6th Standard CBSE
CBSE 6th Social Science Family and Community - New Sample Question Papers Study Material - QB365 Set A
NEW6th Standard CBSE
CBSE 6th Social Science India's Cultural Roots - New Sample Question Papers Study Material - QB365 Set A
NEW6th Standard CBSE
CBSE 6th Social Science India,That is Bharat - New Sample Question Papers Study Material - QB365 Set A
NEW6th Standard CBSE
CBSE 6th Social Science Timeline and sources of history - New Sample Question Papers Study Material - QB365 Set A
NEW6th Standard CBSE
CBSE 6th Social Science Oceans and Continents - New Sample Question Papers Study Material - QB365 Set A

Published on: 24/10/2025
Download CBSE Class 6th Standard CBSE Mathematics question papers, sample papers, important questions, and previous year solved papers in PDF format. Get free study materials, NCERT solutions, and exam preparation resources for Class 6th Standard CBSE Mathematics
Questions + Answers key
Take MCQ Mathematics Test
1.
Along with your friends, think of five more situations where we can have data. For this data, construct the tables and represent them using bar graphs.
2.
The following table shows the number of books in each shelf of different languages in a library. Study the table and answer the questions.
| Shelf number | Malay | Chinese | English | Tamil |
|---|---|---|---|---|
| 1 | 73 | 112 | 158 | 64 |
| 2 | 83 | 100 | 102 | 49 |
| 3 | 56 | 92 | 75 | 54 |
| 4 | 66 | 138 | 175 | 59 |
(i) What is the total number of English books in the library?
(ii) Which language book is the least in number?
(iii) What is the difference between the least number of language books and greatest number of language books and greatest number of language books?
(iv) How many more Chinese books than Malay books are there in shelf number 4?
(v) What is the total number of books in shelf number 2?
3.
The following pictograph shows the sale of scooters during 5 months of 2010.
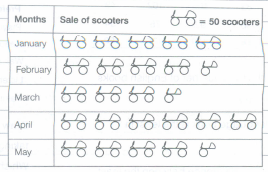
Answer the following questions
(i) In which month, the sale of scooters in maximum?
(ii) In which month, sale of scooters is minimum?
(iii) How many scooters were sold in May?
(iv) Find the revenue in March, if each scooter's cost is Rs.25000.
4.
The following graph gives the information about the number of railway tickets sold for different cities on a railway ticket counter between 6 : 00 am to 10 : 00 am.
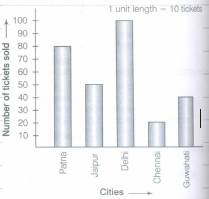
Read the bar graph and answer the following questions .
(a) How many tickets were sold in all?
(b) For which city, were the maximum number of tickets sold?
(c) For which city, were the minimum number of tickets sold?
(d) Name the cities for which the number of tickets sold is more than 20.
(e) Fill in the blank.
Number of tickets sold for Delhi and Jaipur together exceeds the total number of tickets sold for Patna and Chennai by___________
5.
The following table gives information about the circulation of newspapers (dailies) in a town in five languages.
| Language | English | Hindi | Tamil | Punjabi | Gujarati |
| Number of newspapers | 5000 | 8500 | 500 | 2500 | 1000 |
Prepare a pictograph of the above data, using a symbol of your choice.
6.
Soniya saves Rs 500 in January, Rs 700 in February, Rs 600 in March, Rs 750 in April and Rs 900 in May.
(a) Draw a bar graph to represent Soniya's saving.
(b) In which month, her saving is maximum?
(c) What value is depicted by Soniya?
7.
Number of persons in various age groups in a town is given in the following table
| Age group | Number of persons |
| 1 - 14 | 2 lakh |
| 15 - 29 | 1 lakh 60 thousand |
| 30 - 44 | 1 lakh 20 thousand |
| 45 - 59 | 1 lakh 20 thousand |
| 60 - 74 | 80 thousand |
| 75 and above | 40 thousand |
Draw a bar graph to represent the above information and answer the following questions.
(take 1 unit length = 20 thousands)
(a) Which two age groups have same population?
(b) All persons in the age group of 60 and above are called senior citizens. How many senior citizens are therein the town?
8.
Total number of students of a school in different years is shown in the following table.
| Years | Number of students |
| 1996 | 400 |
| 1998 | 535 |
| 2000 | 472 |
| 2002 | 600 |
| 2004 | 623 |
(A) Prepare a pictograph of students using one symbol to represent 100 students and answer the following questions.
(a) How many symbols represent total number of students in the year 2002?
(b) How many symbols represent total number of students in the year 1998?
(B) Prepare another pictograph of students using any other symbol each representing 50 students. Which pictograph do you find more informative?
9.
In a Mathematics test, the following marks were obtained by 40 students. Arrange these marks in a table using tally marks.
| 8 | 1 | 3 | 7 | 6 | 5 | 5 | 4 | 4 | 2 |
| 4 | 9 | 5 | 3 | 7 | 1 | 6 | 5 | 2 | 7 |
| 7 | 3 | 8 | 4 | 2 | 8 | 9 | 5 | 8 | 6 |
| 7 | 4 | 5 | 6 | 9 | 6 | 4 | 4 | 6 | 6 |
(a) Find how many students obtained marks equal to or more than 7.
(b) How many students obtained marks below 4?
10.
The number of girl students in each class of a co-educational middle school is depicted by the pictograph.
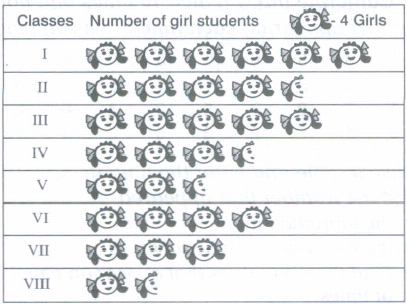
Observe this pictograph and answer the following questions.
(a) Which class has the minimum number of girl students?
(b) Is the number of girls in Class VI less than the number of girls in Class V?
(c) How many girls are there in Class VII?
1.
Five more situations are as follows:
1. In a school in class 6, the number of students coming in working days is shown below:
| Working days | Number of students |
|---|---|
| Monday | 50 |
| Tuesday | 45 |
| Wednesday | 40 |
| Thursday | 45 |
| Friday | 50 |
| Saturday | 40 |
2. The marks obtained by Meenu in different subjects in annual examination are shown below:
| Subjects | Marks obtained |
|---|---|
| Mathematics | 80 |
| Science | 70 |
| English | 60 |
| Hindi | 50 |
| Social Science | 60 |
3. The weights of five students are shown below:
| Students | Weight (in kg) |
|---|---|
| A | 40 |
| B | 30 |
| C | 35 |
| D | 30 |
| E | 40 |
4. The heights of five girls are shown below:
| Girls | Height (in cm) |
|---|---|
| A | 150 |
| B | 140 |
| C | 130 |
| D | 120 |
| E | 140 |
5. The monthly pocket expenditure of Manish during an year is shown below:
| Months | Pocket expenditure (in Rs) |
|---|---|
| January | 500 |
| February | 400 |
| March | 300 |
| April | 350 |
| May | 400 |
| June | 600 |
| July | 200 |
| August | 150 |
| September | 400 |
| October | 350 |
| November | 300 |
| December | 300 |
1. Bar graphs for solution 1 to 5 are as follows:
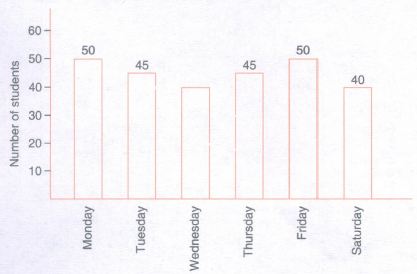
2
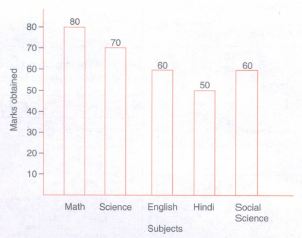
3.
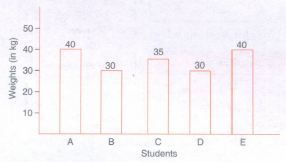
4.
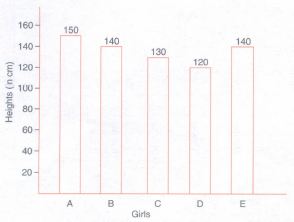
5.
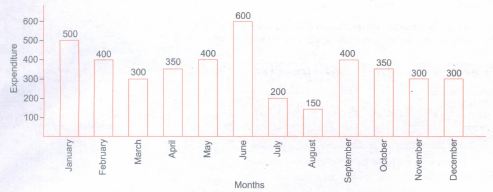
2.
(i) 510 (ii) Tamil (iii) 284 (iv) 72 (v) 334
3.
(i) April (ii) March (iii) 225 (iv) Rs. 4375000
4.
(a) 290 (b) Delhi (c) Chennai (d) Patna, Jaipur, Guwahati (e) 50
5.
1000 newspapers can be represented by \(\boxplus\) and 500 newspaper represented by \(\Box\)
For English language,
5000 newspapers can be represented by 5 complete symbols.
For Hindi language,
8500 newspapers can be represented by 8 complete and 1 incomplete symbol.
For Tamil language,
500 newspapers can be represented by 1 incomplete symbol.
For Punjabi language,
2500 newspapers can be represented by 2 complete symbols and 1 incomplete symbol.
For Gujarati language,
1000 newspapers can be represented by 1 complete symbol.
Hence, the required pictograph of given data is shown below:
Take \(\boxplus\) = 1000 newspapers and \(\Box\) = 500 newspaper.
ii.png)
6.
(a) Let 1 unit length = Rs 100
.png)
(b) In May, her saving is maximum.
(c) Economy saving for future planning.
7.
To draw the bar graph, we will use the following steps:
(i) Firstly, draw two perpendicular lines, one is horizontal and one is vertical. Along the horizontal line, mark 'age-group' and along vertical line mark 'number of persons'.
(ii) Now, take scale of 1 unit length = 20000 along the vertical line and then mark the corresponding values.
Also, the heights of bars for various groups are as follows:
| 1-14 | \(\frac{200000}{20000}=10\) units |
| 15-29 | \(\frac{160000}{20000}=8\) units |
| 30-44 | \(\frac{120000}{20000}=6\) units |
| 45-59 | \(\frac{120000}{20000}=6\) units |
| 60-74 | \(\frac{80000}{20000}=4\) units |
| 75 and above | \(\frac{40000}{20000}=2\) units |
(iii) Draw bar of equal width and of height calculated in Step (ii) on the horizontal line with equal gaps between them.
Thus,we get the following bar graph
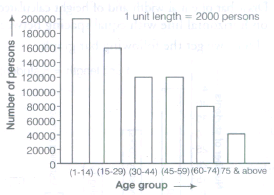
(a) From bar graph, we see that the lengths of bars for age group 30-44 and 45-59 are same, so age group (30 - 44) and (45 - 59) have the same population.
(b) Persons having age 60 or above are called senior citizens.
\(\therefore\) Number of senior citizens in the town
= Number of persons of age group (60 - 74) + Number of persons of age 75 and above
= 80000 + 40000 = 120000.
8.
(A) According to the question, 100 students can be represented by = 1symbol .png)
\(\therefore\) 1 student can be represented by \(\frac{1}{100}\) symbols
Now, for year 1996,
400 students can be represented by \(\frac{400\times 1}{100}\)
= 4 symbols
For year 1998,
535 students can be represented by \(\frac{535\times 1}{100}\)
= 5 complete symbols + 35 students
= 5 complete symbols and 1 incomplete symbol
For year 2000,
472 students can be represented by \(\frac{472\times 1}{100}\)
= 4 complete symbols + 72 students
= 4 complete symbols and 1 incomplete symbol
For year 2002,
600 students can be represented by \(\frac{600\times 1}{100}\)
= 6 complete symbols
For year 2004,
623 students can be represented by \(\frac{623\times 1}{600}\)
6 complete symbol + 23 students = = 6 complete symbols and 1 incomplete symbol
Hence, the required pictograph of given data is shown below
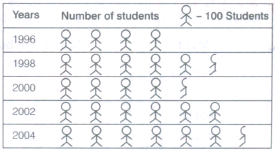
(a) 6 symbols represent total number of students in the year 2002.
(b) 5 complete symbols and 1 incomplete symbol represent total number of students for the year 1998.
(B) According to the question, 50 students can be represented by 1symbol
\(\therefore\) 1 student can be represented by \(\frac{1}{50}\) symbols
Now, for year 1996,
400 students can be represented by \(\frac{400\times 1}{50}\) symbols
= \(\frac{400}{50}\)
= 8 complete symbols.
For year 1998,
535 students can be represented by \(\frac{535\times 1}{50}\)
= \(\frac{535}{50}\) symbols
= 10 complete symbols + 1 incomplete symbol
For year 2000,
472 students can be represented by \(\frac{472\times 1}{50}\) symbols
= \(\frac{472}{50}\)
= 9 complete symbols + 1 incomplete symbol
For year 2002,
600 students can be represented by \(\frac{600\times 1}{50}\) symbols
= \(\frac{600}{50}\)
= 12 complete symbol
For year 2004,
623 students can be represented by \(\frac{623\times 1}{50}\) symbols
= \(\frac{623}{50}\)
= 12 complete symbols + 1 incomplete symbol
Hence, the required pictograph of given data is shown below
.png)
Therefore, we observe that pictograph B is more informative because it gives better approximation.
9.
The table with tally marks is shown below:
| Marks | Tally marks | Number of students |
| 1 | II | 2 |
| 2 | III | 3 |
| 3 | III | 3 |
| 4 | .png) |
7 |
| 5 | .png) |
6 |
| 6 | |
7 |
| 7 | .png) |
5 |
| 8 | IIII | 4 |
| 9 | III | 3 |
| Total | 40 |
(a) Here, we have to find out the students, who obtained marks equal to 7 or more than 7. So, we have to add the number of students who obtained marks equal to 7 or more than 7 i.e. 7, 8 and 9.
\(\therefore\) Number of those students = 5 + 4 + 3 = 12
Hence, 12 students obtained marks equal to 7 or more than 7.
(b) Here, we have to find out the students who obtained marks below 4.
So, we have to add the number of students who obtained marks below 4 i.e. 1, 2 and 3.
\(\therefore\) Number of those students = 3 + 3 + 2 = 8
Hence, 8 students obtained marks below 4.
10.
In the given pictograph, 1 picture = 4 girls, half picture = 2 girls
(a) Observing the pictograph, it is clear that the minimum number of girl students are in class VIII i.e. 4 + 2 = 6
(b) Observing the pictograph, it is clear that Number of girls in class VI = 4 x 4 = 16 and number of girls in class V = 2 x 4 + 1 x 2 = 8 + 2 = 10
\(\therefore\) 10 < 16
So, it is clear that number of girls in class VI is not Iess than the number of girls in class V.
(c) Observing the pictograph, number of girls in class VII = 3 x 4 = 12.

6th Standard CBSE Syllabus & Materials
6th Standard CBSE
CBSE 6th Social Science Locating Places on the Earth - New Sample Question Papers Study Material - QB365 Set A
NEW6th Standard CBSE
CBSE 6th Science A Journey Through States of Water - New Sample Question Papers Study Material - QB365 Set A
NEW6th Standard CBSE
CBSE 6th Science Temperature and its Measurement - New Sample Question Papers Study Material - QB365 Set A
NEW6th Standard CBSE
CBSE 6th Science Materials Around Us - New Sample Question Papers Study Material - QB365 Set A



NCERT Books

Syllabus

Exam Pattern

Sample Question Papers

Previous year Question Papers

Important Notes

MCQ Practice test

NCERT Exemplers

Case study Questions

Image Based Questions

Passage based Questions

HOT Questions

Value Based Questions

Model Questions Papers
NCERT ( Book Back ) Questions

Assertion and Reason
Important Questions And Answers

CBSE 6th Standard CBSE Subjects
CBSE Standards


