
 100% FREE ACCESS
6th Standard CBSE Syllabus & Materials
6th Standard CBSE
CBSE 6th Social Science The Value of Work - New Sample Question Papers Study Material - QB365 Set A
NEW6th Standard CBSE
CBSE 6th Social Science Family and Community - New Sample Question Papers Study Material - QB365 Set A
NEW6th Standard CBSE
CBSE 6th Social Science India's Cultural Roots - New Sample Question Papers Study Material - QB365 Set A
NEW6th Standard CBSE
CBSE 6th Social Science India,That is Bharat - New Sample Question Papers Study Material - QB365 Set A
NEW6th Standard CBSE
CBSE 6th Social Science Timeline and sources of history - New Sample Question Papers Study Material - QB365 Set A
NEW6th Standard CBSE
CBSE 6th Social Science Oceans and Continents - New Sample Question Papers Study Material - QB365 Set A

Published on: 24/10/2025
Download CBSE Class 6th Standard CBSE Mathematics question papers, sample papers, important questions, and previous year solved papers in PDF format. Get free study materials, NCERT solutions, and exam preparation resources for Class 6th Standard CBSE Mathematics
Questions + Answers key
Take MCQ Mathematics Test
1.
Along with your friends, think of five more situations where we can have data. For this data, construct the tables and represent them using bar graphs.
2.
A survey of 100 school students was done to find which activity they prefer to do in their free time.
| Preferred activity | Number of students |
|---|---|
| Playing | 35 |
| Reading story books | 20 |
| Watching TV | 30 |
| Listening to music | 10 |
| Painting | 5 |
Draw a bar graph to illustrate the above data taking scale of 1 unit length=5 students. Which activity is preferred by most of the students other than playing?
3.
The following pictograph shows the sale of scooters during 5 months of 2010.
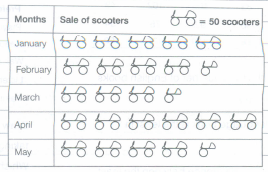
Answer the following questions
(i) In which month, the sale of scooters in maximum?
(ii) In which month, sale of scooters is minimum?
(iii) How many scooters were sold in May?
(iv) Find the revenue in March, if each scooter's cost is Rs.25000.
4.
In a botanical garden, the number of different types of plants are found as follows:
| Type of the plants | Number of plants |
| Herb | 50 |
| Shrub | 60 |
| Creeper | 20 |
| Climber | 45 |
| Tree | 95 |
Draw a bar graph to represent the above information and answer the following questions.
(a) Which type of plant is maximum in number in the garden?
(b) Which type of plant is minimum in number in the garden?
5.
The number of scouts in a school is depicted by the following pictograph.
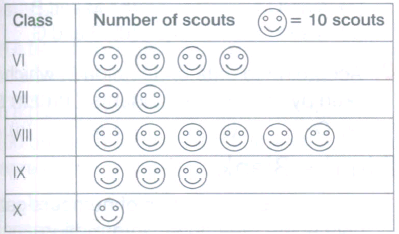
Observe the pictograph and answer the following questions.
(a) Which class has the minimum number of scouts?
(b) Which class has the maximum number of scouts?
(c) How many scouts are there in class VI?
(d) Which class has exactly four times the scouts as that of class X?
(e) What is the total number of scouts in the classes VI to X?
6.
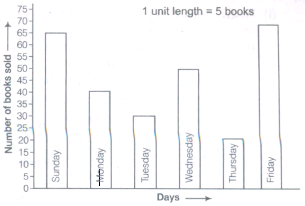
The number of Mathematics books sold by a shopkeeper on six consecutive days is shown below:
| Days | Sunday | Monday | Tuesday | Wednesday | Thursday | Friday |
| Number of books sold | 65 | 40 | 30 | 50 | 20 | 70 |
Draw a bar graph to represent the above information choosing the scale of your choice.
7.
Total number of students of a school in different years is shown in the following table.
| Years | Number of students |
| 1996 | 400 |
| 1998 | 535 |
| 2000 | 472 |
| 2002 | 600 |
| 2004 | 623 |
(A) Prepare a pictograph of students using one symbol to represent 100 students and answer the following questions.
(a) How many symbols represent total number of students in the year 2002?
(b) How many symbols represent total number of students in the year 1998?
(B) Prepare another pictograph of students using any other symbol each representing 50 students. Which pictograph do you find more informative?
8.
In a Mathematics test, the following marks were obtained by 40 students. Arrange these marks in a table using tally marks.
| 8 | 1 | 3 | 7 | 6 | 5 | 5 | 4 | 4 | 2 |
| 4 | 9 | 5 | 3 | 7 | 1 | 6 | 5 | 2 | 7 |
| 7 | 3 | 8 | 4 | 2 | 8 | 9 | 5 | 8 | 6 |
| 7 | 4 | 5 | 6 | 9 | 6 | 4 | 4 | 6 | 6 |
(a) Find how many students obtained marks equal to or more than 7.
(b) How many students obtained marks below 4?
9.
The sale of electric bulbs on different days of a week is shown below
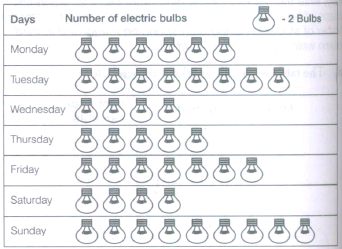
Observe the pictograph and answer the following questions.
(a) How many bulbs were sold on Friday?
(b) On which day, were the maximum number of bulbs sold?
(c) On which of the days, same number of bulbs were sold?
(d) On which of the days, minimum number of bulbs were sold?
(e) If one big carton can hold 9 bulbs. How many cartons were needed in the given week?
10.
Following pictograph shows the number of tractors in five villages.
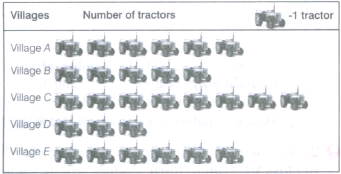
Observe the pictograph and answer the following questions.
(i) Which village has the minimum number of tractors?
(ii) Which village has the maximum number of tractors?
(iii) How many more tractors village C has as compared to village B?
(iv) What is the total number of tractors in all the five villages?
1.
Five more situations are as follows:
1. In a school in class 6, the number of students coming in working days is shown below:
| Working days | Number of students |
|---|---|
| Monday | 50 |
| Tuesday | 45 |
| Wednesday | 40 |
| Thursday | 45 |
| Friday | 50 |
| Saturday | 40 |
2. The marks obtained by Meenu in different subjects in annual examination are shown below:
| Subjects | Marks obtained |
|---|---|
| Mathematics | 80 |
| Science | 70 |
| English | 60 |
| Hindi | 50 |
| Social Science | 60 |
3. The weights of five students are shown below:
| Students | Weight (in kg) |
|---|---|
| A | 40 |
| B | 30 |
| C | 35 |
| D | 30 |
| E | 40 |
4. The heights of five girls are shown below:
| Girls | Height (in cm) |
|---|---|
| A | 150 |
| B | 140 |
| C | 130 |
| D | 120 |
| E | 140 |
5. The monthly pocket expenditure of Manish during an year is shown below:
| Months | Pocket expenditure (in Rs) |
|---|---|
| January | 500 |
| February | 400 |
| March | 300 |
| April | 350 |
| May | 400 |
| June | 600 |
| July | 200 |
| August | 150 |
| September | 400 |
| October | 350 |
| November | 300 |
| December | 300 |
1. Bar graphs for solution 1 to 5 are as follows:
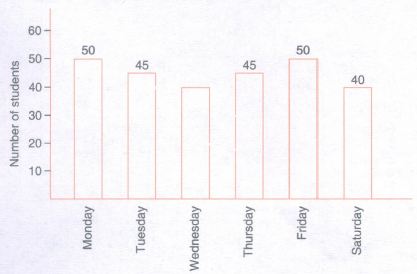
2
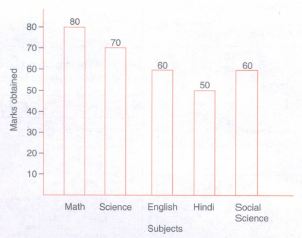
3.
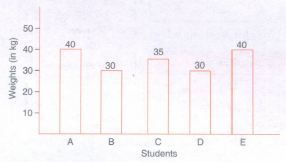
4.
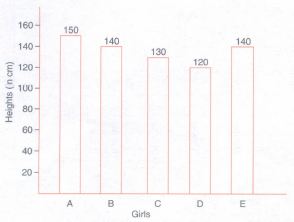
5.
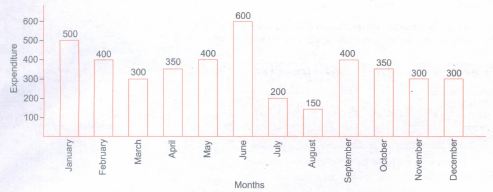
2.
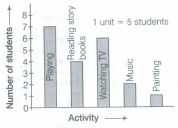
Watching TV is preferred by most of the studentsother than playing.
3.
(i) April (ii) March (iii) 225 (iv) Rs. 4375000
4.
.png)
(a) Tree is maximum in number in the garden.
(b) Creeper is minimum in number in the garden.
5.
(a) Class X has minimum number of scouts i.e. 10.
(b) Class VIII has maximum number of scouts i.e. 60.
(c) Number of scouts in class VI = 40
(d) Number of scouts in class X =10
Hence. class VI has exactly four times the scouts as that of class X.
(e) Total number of scouts in classes VI to X
= 40 + 20 + 60 + 30 + 10 = 160.
6.
To draw a bar graph, we will use the following steps:
(i) Firstly, draw two perpendicular lines, one is horizontal and one is vertical. Along the horizontal line, mark 'days' and along the vertical line mark 'number of books sold'.
(ii) Now, take scale of 1 unit length = 5 books, along the vertical line and then mark the corresponding values.
Also, the heights of the bars for various days are as follows:
| Sunday | \(\frac{65}{5}=13\) units |
| Monday | \(\frac{40}{5}=8\) units |
| Tuesday | \(\frac{30}{5}=6\) units |
| Wednesday | \(\frac{50}{5}=10\) units |
| Thursday | \(\frac{20}{5}=4\) units |
| Friday | \(\frac{70}{5}=14\) units |
(iii) Drawbars of equal width and of height calculated in Step (ii) on the horizontal line with equal spacing (or gap) between them.
Thus, we get the following bar graph.
7.
(A) According to the question, 100 students can be represented by = 1symbol .png)
\(\therefore\) 1 student can be represented by \(\frac{1}{100}\) symbols
Now, for year 1996,
400 students can be represented by \(\frac{400\times 1}{100}\)
= 4 symbols
For year 1998,
535 students can be represented by \(\frac{535\times 1}{100}\)
= 5 complete symbols + 35 students
= 5 complete symbols and 1 incomplete symbol
For year 2000,
472 students can be represented by \(\frac{472\times 1}{100}\)
= 4 complete symbols + 72 students
= 4 complete symbols and 1 incomplete symbol
For year 2002,
600 students can be represented by \(\frac{600\times 1}{100}\)
= 6 complete symbols
For year 2004,
623 students can be represented by \(\frac{623\times 1}{600}\)
6 complete symbol + 23 students = = 6 complete symbols and 1 incomplete symbol
Hence, the required pictograph of given data is shown below
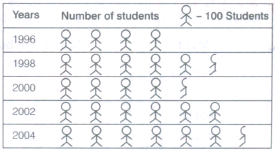
(a) 6 symbols represent total number of students in the year 2002.
(b) 5 complete symbols and 1 incomplete symbol represent total number of students for the year 1998.
(B) According to the question, 50 students can be represented by 1symbol
\(\therefore\) 1 student can be represented by \(\frac{1}{50}\) symbols
Now, for year 1996,
400 students can be represented by \(\frac{400\times 1}{50}\) symbols
= \(\frac{400}{50}\)
= 8 complete symbols.
For year 1998,
535 students can be represented by \(\frac{535\times 1}{50}\)
= \(\frac{535}{50}\) symbols
= 10 complete symbols + 1 incomplete symbol
For year 2000,
472 students can be represented by \(\frac{472\times 1}{50}\) symbols
= \(\frac{472}{50}\)
= 9 complete symbols + 1 incomplete symbol
For year 2002,
600 students can be represented by \(\frac{600\times 1}{50}\) symbols
= \(\frac{600}{50}\)
= 12 complete symbol
For year 2004,
623 students can be represented by \(\frac{623\times 1}{50}\) symbols
= \(\frac{623}{50}\)
= 12 complete symbols + 1 incomplete symbol
Hence, the required pictograph of given data is shown below
.png)
Therefore, we observe that pictograph B is more informative because it gives better approximation.
8.
The table with tally marks is shown below:
| Marks | Tally marks | Number of students |
| 1 | II | 2 |
| 2 | III | 3 |
| 3 | III | 3 |
| 4 | .png) |
7 |
| 5 | .png) |
6 |
| 6 | |
7 |
| 7 | .png) |
5 |
| 8 | IIII | 4 |
| 9 | III | 3 |
| Total | 40 |
(a) Here, we have to find out the students, who obtained marks equal to 7 or more than 7. So, we have to add the number of students who obtained marks equal to 7 or more than 7 i.e. 7, 8 and 9.
\(\therefore\) Number of those students = 5 + 4 + 3 = 12
Hence, 12 students obtained marks equal to 7 or more than 7.
(b) Here, we have to find out the students who obtained marks below 4.
So, we have to add the number of students who obtained marks below 4 i.e. 1, 2 and 3.
\(\therefore\) Number of those students = 3 + 3 + 2 = 8
Hence, 8 students obtained marks below 4.
9.
In the given pictograph, 1 picture = 2 bulbs
Now, number of bulbs sold on Monday = 6 pictures
= 6 x 2 = 12bulbs
Number of bulbs sold on Tuesday = 8 x 2 = 16 bulbs
Number of bulbs sold on Wednesday = 4 x 2 = 8 bulbs
Number of bulbs sold on Thursday = 5 x 2 = 10 bulbs
Number of bulbs sold on Friday = 7 x 2 = 14 bulbs
Number of bulbs sold on Saturday = 4 x 2 = 8 bulbs
Number of bulbs sold on Sunday = 9 x 2 = 18 bulbs
(a) Number of bulbs sold on Friday = 7 x 2 = 14 bulbs
(b) Maximum number of bulbs were sold on Sunday i.e. 18 bulbs.
(c) The same number of bulbs were sold on Wednesday and Saturday i.e. 8 bulbs.
(d) The minimum number of bulbs were sold on Wednesday and Saturday i.e. 8 bulbs.
(e) Total number of bulbs sold in a week
= 12 + 16 + 8 + 10 + 14 + 8 + 18 = 86
Now, number of cartons which can hold 9 bulbs = 1 and number of carton which can hold 1 bulb = \(\frac{1}{9}\)
\(\therefore\) Number of cartons which can hold 86 bulbs = \(\frac{1\times 86}{9}\)
= \(\frac{86}{9}=9\frac{5}{9}=10\)
Hence, 10 cartons were needed in the given week.
10.
(i) Observing the pictograph, it is clear that village D has the minimum number of tractors i.e. only 3 tractors.
(ii) Observing the pictograph, it is clear that village C has the maximum number of tractors i.e. 8 tractors.
(iii) Observing the pictograph, it is clear that village C has 8 tractors and village B has 5 tractors. So, village C has 8 - 5 = 3 more tractors as compared to village B.
(iv) Total number of tractors in all the five villages = Sum of all tractors in villages A, B, C, D and E = 6 + 5 + 8 + 3 + 6 = 28. Hence, there are 28 tractors in all the five villages.

6th Standard CBSE Syllabus & Materials
6th Standard CBSE
CBSE 6th Social Science Locating Places on the Earth - New Sample Question Papers Study Material - QB365 Set A
NEW6th Standard CBSE
CBSE 6th Science A Journey Through States of Water - New Sample Question Papers Study Material - QB365 Set A
NEW6th Standard CBSE
CBSE 6th Science Temperature and its Measurement - New Sample Question Papers Study Material - QB365 Set A
NEW6th Standard CBSE
CBSE 6th Science Materials Around Us - New Sample Question Papers Study Material - QB365 Set A



NCERT Books

Syllabus

Exam Pattern

Sample Question Papers

Previous year Question Papers

Important Notes

MCQ Practice test

NCERT Exemplers

Case study Questions

Image Based Questions

Passage based Questions

HOT Questions

Value Based Questions

Model Questions Papers
NCERT ( Book Back ) Questions

Assertion and Reason
Important Questions And Answers

CBSE 6th Standard CBSE Subjects
CBSE Standards


