
 100% FREE ACCESS
6th Standard CBSE Syllabus & Materials
6th Standard CBSE
CBSE 6th Social Science The Value of Work - New Sample Question Papers Study Material - QB365 Set A
NEW6th Standard CBSE
CBSE 6th Social Science Family and Community - New Sample Question Papers Study Material - QB365 Set A
NEW6th Standard CBSE
CBSE 6th Social Science India's Cultural Roots - New Sample Question Papers Study Material - QB365 Set A
NEW6th Standard CBSE
CBSE 6th Social Science India,That is Bharat - New Sample Question Papers Study Material - QB365 Set A
NEW6th Standard CBSE
CBSE 6th Social Science Timeline and sources of history - New Sample Question Papers Study Material - QB365 Set A
NEW6th Standard CBSE
CBSE 6th Social Science Oceans and Continents - New Sample Question Papers Study Material - QB365 Set A

Published on: 24/10/2025
Download CBSE Class 6th Standard CBSE Mathematics question papers, sample papers, important questions, and previous year solved papers in PDF format. Get free study materials, NCERT solutions, and exam preparation resources for Class 6th Standard CBSE Mathematics
Questions + Answers key
Take MCQ Mathematics Test
1.
Which method is more useful when information from a much larger data is required?
2.
What does one (\(\surd \)) mark indicate?
3.
What are pictographs?
4.
In a pictograph, if symbol .png) represents 100 books in a library shelf, then how many books, this symbol
represents 100 books in a library shelf, then how many books, this symbol .png) represent?
represent?
5.
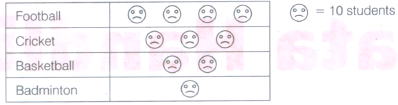
Rajesh was asked to find the number of students playing different games in the school. The information collected by him is as follows:
Football 40, Cricket 30, Basketball 20, Badminton 10 Represent the given information with a pictograph.
6.
The number of scouts in a school is depicted by the following pictograph.
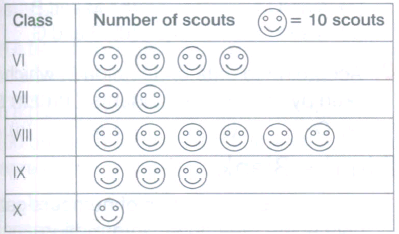
Observe the pictograph and answer the following questions.
(a) Which class has the minimum number of scouts?
(b) Which class has the maximum number of scouts?
(c) How many scouts are there in class VI?
(d) Which class has exactly four times the scouts as that of class X?
(e) What is the total number of scouts in the classes VI to X?
7.
In a Mathematics test, the following marks were obtained by 40 students. Arrange these marks in a table using tally marks.
| 8 | 1 | 3 | 7 | 6 | 5 | 5 | 4 | 4 | 2 |
| 4 | 9 | 5 | 3 | 7 | 1 | 6 | 5 | 2 | 7 |
| 7 | 3 | 8 | 4 | 2 | 8 | 9 | 5 | 8 | 6 |
| 7 | 4 | 5 | 6 | 9 | 6 | 4 | 4 | 6 | 6 |
(a) Find how many students obtained marks equal to or more than 7.
(b) How many students obtained marks below 4?
8.
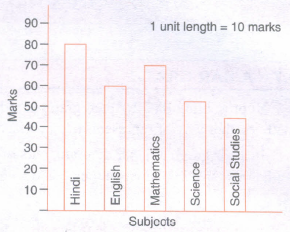
Observe this bar graph which shows the marks obtained by Aziz in half-yearly examination in different subjects.
Answer the given questions.
(a) What information does the bar graph give?
(b) Name the subject in which Aziz scored maximum marks.
(c) Name the subject in which he has scored minimum marks.
(d) State the name of the subjects and marks obtained in each of them.
9.
A survey was done to find out the number of hours students spend on homework per day. The results are tabulate as shown in the table.
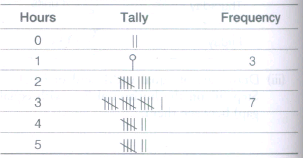
a)Complete the table and represent the results using a bar graph.
b) How many students were surveyed?
10.
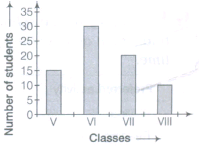
This bar graph shows the number of students in a coaching centre. Use the bar graph to answer the following questions.
(a) How many students are there in class VII?
(b) How many more students in class V than class VIII are there?
(c) How many students are there in the coaching centre?
(d) How many more class VI students than class VII are there?
11.
Adjoining bar graph shows the number of students in different classes of a school. Read the graph and answer the following questions.
(a) How many students are in class X?
(b) How many students are in class VII?
(c) How many students are in class IX?
12.
The pictogram shows the number of persons using various brands of perfumes.
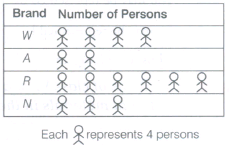
(a) How many persons use R brand?
(b) Which brand is used by maximum number of persons?
13.
Observe the following bar graph and answer the related questions:
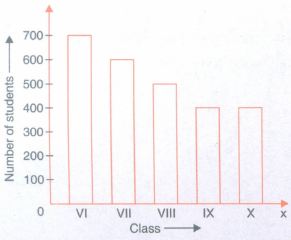
What is the ratio of the number of students of class X and class IX?
1 : 1
1 : 2
2 : 1
1 : 4
14.
Observe the following bar graph and answer the related questions:
In which class/classes is the number of students minimum?
IX, X
VIII
VI
VII
15.
Observe the following bar graph and answer the related questions:
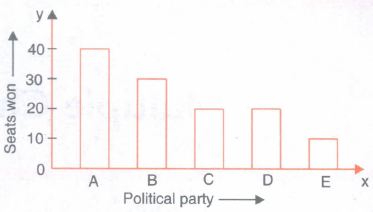
How many parties won less than 60 seats?
2
3
5
4
16.
Observe the following bar graph and answer the related questions:
Which two political parties won the same number of seats?
C,D
C,E
D,E
B, D
17.
Observe the following table and answer the related questions:
| Blood groups | Number of students |
|---|---|
| A | 9 |
| B | 6 |
| O | 12 |
| AB | 3 |
| Total | 30 |
Which blood group is the rarest?
AB
B
A
O
18.
The marks obtained by 10 students in Mathematics test are given below:
| 55 | 36 | 95 | 73 | 62 |
| 42 | 25 | 78 | 75 | 62 |
Answer the following related questions:
How many students got marks between 60 and 75?
1
2
3
4
19.
The choices of the fruits of 42 students in a class are as follows.
A, O, B, M, A, G, B, G, A, G, B, M, A, G, M, A, B, G, M, B, A, O, M, O, G, B, O, M, G, A, A, B, M, O, M, G, B, A, M, O, M, O
Where A, B, G, M and O stand for the fruits Apple, Banana, Grapes, Mango and Orange respectively. Which fruit is liked by most of the students?
O
G
M
A
20.
The marks obtained by 10 students in Science test are given below:
53, 36, 95, 73, 62, 42, 25, 78, 75, 62
Answer the following questions that are related to the given data.
How many students got marks below 62?
3
4
5
2
21.
The marks obtained by 10 students in Science test are given below:
53, 36, 95, 73, 62, 42, 25, 78, 75, 62
Answer the following questions that are related to the given data.
How many students got the same marks?
3
4
2
None of these
22.
The marks (out of 10) obtained by 28 students in a Mathematics test are listed as given below:
8, 1, 2, 6, 5, 5, 5, 0, 1, 9, 7, 8, 0, 5, 8, 3, 0, 8, 10, 10, 3, 4, 8, 7, 8, 9, 2, 0
The number of students who obtained marks more than or equal to 5 is
13
15
16
17
23.
On the scale of 1 unit length = 10 crore, the bar of length 6 units will represent _________ crore and of ________ units will represent 75 crore.
24.
In a pictograph, if a symbol * represents 20 flowers in a basket, then *** stands for _________ flowers.
25.
In a bar graph, bars of __________ width can be drawn horizontally or vertically with ________ spacing between them.
26.
Representation of data in form of pictures is called ___________.
27.
The data can be arranged in a tabular form using _________ marks.
1.
Ronald's table method is more useful.
2.
One (\(\surd \)) mark indicates one student.
3.
The pictorial representation of the numerical data using pictures or symbols is called the pictograph of the data.
4.
75 books.
5.
Given, information by Rajesh
Football \(\rightarrow\) 40, Cricket \(\rightarrow\) 30, Basketball \(\rightarrow\) 20, Badminton \(\rightarrow\) 10
The given data can be represented by a pictograph as shown below:
6.
(a) Class X has minimum number of scouts i.e. 10.
(b) Class VIII has maximum number of scouts i.e. 60.
(c) Number of scouts in class VI = 40
(d) Number of scouts in class X =10
Hence. class VI has exactly four times the scouts as that of class X.
(e) Total number of scouts in classes VI to X
= 40 + 20 + 60 + 30 + 10 = 160.
7.
The table with tally marks is shown below:
| Marks | Tally marks | Number of students |
| 1 | II | 2 |
| 2 | III | 3 |
| 3 | III | 3 |
| 4 | .png) |
7 |
| 5 | .png) |
6 |
| 6 | |
7 |
| 7 | .png) |
5 |
| 8 | IIII | 4 |
| 9 | III | 3 |
| Total | 40 |
(a) Here, we have to find out the students, who obtained marks equal to 7 or more than 7. So, we have to add the number of students who obtained marks equal to 7 or more than 7 i.e. 7, 8 and 9.
\(\therefore\) Number of those students = 5 + 4 + 3 = 12
Hence, 12 students obtained marks equal to 7 or more than 7.
(b) Here, we have to find out the students who obtained marks below 4.
So, we have to add the number of students who obtained marks below 4 i.e. 1, 2 and 3.
\(\therefore\) Number of those students = 3 + 3 + 2 = 8
Hence, 8 students obtained marks below 4.
8.
(a) This bar graph shows the marks obtained by Aziz in half-yearly examination in different subjects.
(b) Hindi
(c) Social Studies
(d) Hindi-80, English-60, Mathematics-70, Science-50 and Social Studies-40.
9.
(a)
| Hours | Tally | Frequency |
| 0 | I I | 2 |
| 1 | I I I | 3 |
| 2 | I I I I I I I I | 9 |
| 3 | I I I I I I I I I I I I I |
16 |
| 4 | I I I I I I | 7 |
| 5 | I I I I I I | 7 |
.png)
(b) 44.
10.
(a) 20
(b) 5
(c) 75
(d) 10.
11.
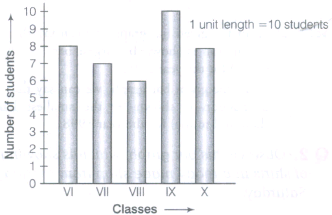
(a) Number of students in class X = 80
(b) Number of students in class VII = 70
(c) Number of students in class IX = 100.
12.
(a) 24 persons
(b) R brand.
13.
(a)
1 : 1
14.
(a)
IX, X
15.
(c)
5
16.
(a)
C,D
17.
(a)
AB
18.
(c)
3
19.
(c)
M
20.
(b)
4
21.
(c)
2
22.
(d)
17
23.
()
60, \(7\frac{1}{2}\)
24.
()
60
25.
()
Uniform, equal
26.
()
Pictograph
27.
()
tally

6th Standard CBSE Syllabus & Materials
6th Standard CBSE
CBSE 6th Social Science Locating Places on the Earth - New Sample Question Papers Study Material - QB365 Set A
NEW6th Standard CBSE
CBSE 6th Science A Journey Through States of Water - New Sample Question Papers Study Material - QB365 Set A
NEW6th Standard CBSE
CBSE 6th Science Temperature and its Measurement - New Sample Question Papers Study Material - QB365 Set A
NEW6th Standard CBSE
CBSE 6th Science Materials Around Us - New Sample Question Papers Study Material - QB365 Set A



NCERT Books

Syllabus

Exam Pattern

Sample Question Papers

Previous year Question Papers

Important Notes

MCQ Practice test

NCERT Exemplers

Case study Questions

Image Based Questions

Passage based Questions

HOT Questions

Value Based Questions

Model Questions Papers
NCERT ( Book Back ) Questions

Assertion and Reason
Important Questions And Answers

CBSE 6th Standard CBSE Subjects
CBSE Standards


