
 100% FREE ACCESS
6th Standard CBSE Syllabus & Materials
6th Standard CBSE
CBSE 6th Social Science The Value of Work - New Sample Question Papers Study Material - QB365 Set A
NEW6th Standard CBSE
CBSE 6th Social Science Family and Community - New Sample Question Papers Study Material - QB365 Set A
NEW6th Standard CBSE
CBSE 6th Social Science India's Cultural Roots - New Sample Question Papers Study Material - QB365 Set A
NEW6th Standard CBSE
CBSE 6th Social Science India,That is Bharat - New Sample Question Papers Study Material - QB365 Set A
NEW6th Standard CBSE
CBSE 6th Social Science Timeline and sources of history - New Sample Question Papers Study Material - QB365 Set A
NEW6th Standard CBSE
CBSE 6th Social Science Oceans and Continents - New Sample Question Papers Study Material - QB365 Set A

Published on: 24/09/2019
Data Handling
Download CBSE Class 6th Standard CBSE Mathematics question papers, sample papers, important questions, and previous year solved papers in PDF format. Get free study materials, NCERT solutions, and exam preparation resources for Class 6th Standard CBSE Mathematics
Questions + Answers key
Take MCQ Mathematics Test
1.
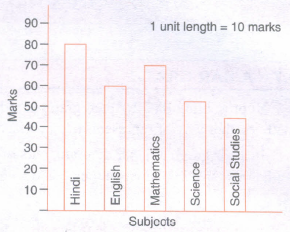
Observe this bar graph which shows the marks obtained by Aziz in half-yearly examination in different subjects.
Answer the given questions.
(a) What information does the bar graph give?
(b) Name the subject in which Aziz scored maximum marks.
(c) Name the subject in which he has scored minimum marks.
(d) State the name of the subjects and marks obtained in each of them.
2.
Rakesh is playing with a dice. He threw thedi 40 times and noted the outcomes as follows.
1, 2, 1, 5, 3, 5, 5, 3, 2, 2, 1, 6, 6, 6, 4, 6, 3, 5, 2, 3, 3, 5, 4, 1, 5, 5, 2, 4, 5, 5, 2, 4, 1, 6, 6, 1, 5, 6, 1, 5
Prepare a table using tally marks.
3.
The blood groups of 25 students are recorded as follows:
A, B, 0, A, AB, 0, A, 0, B, A, O, B, A, AB, AB, A, A, B, B, O, B, AB, O, A, B.
Arrange the information in a table using tally marks.
4.
The following graph shows the runs scored by some cricketersin a selection test. Study the graph carefully and answer the questions.
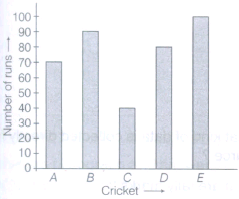
(a) If 50 is the qualifying run, who failed the test?
(b) Who scored highest in the test?
5.
The following table shows the ages of 5 people. Illustrate this date using a bar graph and answer the following questions.
| Name of the person | A | B | C | D | E |
| Ages (in years) | 35 | 25 | 40 | 30 | 50 |
(a) Who is twice as old as B?
(b) Who is the youngest of all?
(c) By how many years, is A older than D?
6.
This graph shows the number of boys, who have different types of hobbies.
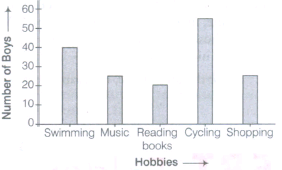
Use the graph to answer the following questions.
(a) Which is the most popular hobby among the boys?
(b) Which is the least popular hobby among the boys?
(c) What is the total number of boys, who participated in the survey?
(d) Which two hobbies ae equally popular among the boys?
7.
The following bar graph shows the number of people'TAJ MAHAL' over a period of 5 months.
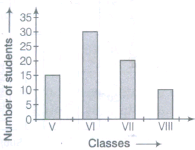
Use the graph to answer the following questions.
(a) How many people visited the 'TAJ MAHAL' in April?
(b) How many more people visited the 'TAJ MAHAL' in May than in January?
(c) In which month, were there as many visitors as in March?
(d) In which month, were there 1500 more visitors than in January?
(e) How many visitors were there in 5 months?
8.
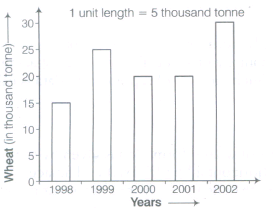
The bar graph given below shows the amount of wheat purchased by government during the year 1998 - 2002.
Read the bar graph and write down your observations. In which year was
(a) the wheat production maximum?
(b) the wheat production minimum?
9.
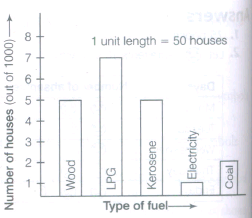
The Adjoining bar graph shows the number of houses (out of 1000) in a town using different types of fuels for cooking. Read the bar graph and answer the following questions.
(a) Which fuel is used in maximum number of houses?
(b) How many houses using coal as fuel?
(c) How many houses using LPG as fuel?
10.
The number of tablets sold by a company during a week are given below:
| Days | Mon | Tue | Wed | Thu | Fri | Sat |
| Number of tables sold | 4 | 16 | 24 | 8 | 12 | 20 |
Draw a pictogaph using scale  tablets and answer the following questions.
(a) How many tablets sold during the week?
(b) On which day, was the sale maximum?
(c) How many tablets were sold on Wednesday?
(d) How many tablets were sold on Monday?
11.
The number of tins of paint sold by three different shops are given below:
| Shops | Number of tins of paint |
| Shop A | 80 |
| Shop B | 140 |
| Shop C | 180 |
Draw a pictograph and answer the following questions.
(a) What is the total profit of shop A, if the profit gained on each tin is 150?
(b) If the total number of tins sold is 400, how many figures must be drawn for shop C?
(c) Find the difference between the number of tins sold by shop B and the number of tins sold by shop C. Use scale  = 20 tins.
12.
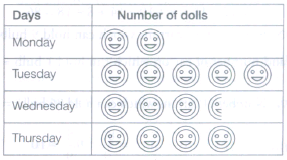
A factory made 200 dolls on Monday, 500 dolls on Tuesday, 350 dolls on Wednesday and 400 dolls on Thursday. Represent the information in the form of pictograph.
13.
Following is the choice of sports for 20 students of class VI. Cricket, Football, Cricket, Tennis, Cricket, Badminton, Football, Cricket, Football, Tennis, Cricket, Badminton, Basketball, Football, Golf, Football, Hockey, Football Hockey, Cricket
Arrange the names of sports in a table using tally marks.
14.
The following are the weight in kg of 20 students of a class 25, 16, 17, 15, 23, 10, 9, 15, 16, 17, 15, 16, 23, 25, 16, 15, 23, 9, 10, 16
Prepare a frequency distribution table for the given data.
15.
Following pictograph represents some surnames of people listed in the telephone directory of a city.
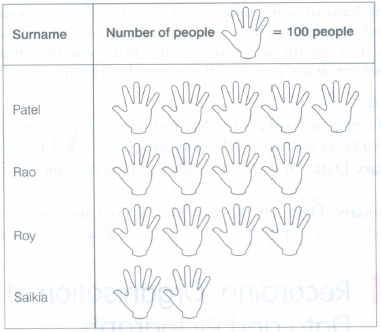
Observe the pictograph and answer the following questions:
(a) How many people have surname 'Roy'?
(b) Which surname appears the maximum number of times in the telephone directory?
(c) Which surname appears the least number of times in the telephone directory?
(d) Which two surnames appear an equal number of times?
1.
(a) This bar graph shows the marks obtained by Aziz in half-yearly examination in different subjects.
(b) Hindi
(c) Social Studies
(d) Hindi-80, English-60, Mathematics-70, Science-50 and Social Studies-40.
2.
We draw the following table using tally marks from given information.
| Numbers | Tally marks | Number of times |
| 1 | .png) |
7 |
| 2 | .png) |
6 |
| 3 | .png) |
5 |
| 4 | I I I I | 4 |
| 5 | .png) |
11 |
| 6 | |
7 |
3.
| Blood group | Tally marks | Number of students |
| A | .png) |
8 |
| B | .png) |
7 |
| O | |
6 |
| AB | I I I I | 4 |
4.
(a) C
(b) E.
5.
.png)
(a) E
(b) B
(c) 5 yr.
6.
(a) Cycling
(b) Reading books
(c) 160
(d) Music and shopping.
7.
(a) 3500
(b) 500
(c) January
(d) April
(e) 55.
8.
(a) From the given bar graph, we can say that maximum production is shown by largest bar (i.e. 30 thousand tonne) for the year 2002.
(b) From the given bar graph, we can say that minimum production is shown by the smallest bar (i.e. 15 thousand tonne) for the year 1998.
9.
(a) LPG is used in maximum number of houses.
(b) 100 houses use coal as fuel.
(c) 350 houses use LPG as fuel.
10.
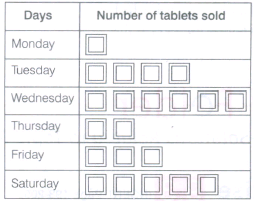
(a) 84 tablets
(b) Wednesday
(c) 24 tablets
(d) 4 tablets.
11.
Let represents 20 tins of paint.
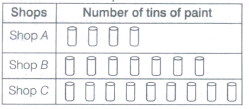
(a) Rs 12000
(b) 9 tins
(c) 40 tins.
12.
Here, given production of dolls. Monday - 200, Tuesday - 500 Wednesday - 350, Thursday - 400
Let us assume that
100 may be represented by .png)
50 may be represented by .png)
Thus, the pictograph would be
13.
| Sports | Tally marks | Number of students |
| Cricket | I I I I I | 6 |
| Football | I I I I I | 6 |
| Tennis | I I | 2 |
| Badminton | I I | 2 |
| Basketball | I | 1 |
| Golf | I | 1 |
| Hockey | I I | 2 |
| Total | 20 |
14.
| Weight of students | Tally marks | Number of students |
| 9 | I I | 2 |
| 10 | I I | 2 |
| 15 | I I I I | 4 |
| 16 | I I I I | 5 |
| 17 | I I | 2 |
| 23 | I I I | 3 |
| 25 | I I | 2 |
15.
(a) The number of people having surname 'Roy' are 400. Because in the given pictograph, the picture symbol represents 100 people.
(b) Surname 'Patel' appears maximum number of times. Because in the given pictograph, the picture symbol represents 100 people. According to this, surname Patel appears 500 times.
(c) The surname 'Saikia' appears the least number of times. Because in the given pictograph, the picture symbol represents 100 people. According to this, surname 'Saikia' appears 200 times.
(d) The surname 'Rao' and 'Roy' appears an equal number of times.

6th Standard CBSE Syllabus & Materials
6th Standard CBSE
CBSE 6th Social Science Locating Places on the Earth - New Sample Question Papers Study Material - QB365 Set A
NEW6th Standard CBSE
CBSE 6th Science A Journey Through States of Water - New Sample Question Papers Study Material - QB365 Set A
NEW6th Standard CBSE
CBSE 6th Science Temperature and its Measurement - New Sample Question Papers Study Material - QB365 Set A
NEW6th Standard CBSE
CBSE 6th Science Materials Around Us - New Sample Question Papers Study Material - QB365 Set A



CBSE 6th Standard CBSE Subjects
CBSE Standards




