
 100% FREE ACCESS
6th Standard CBSE Syllabus & Materials
6th Standard CBSE
CBSE 6th Social Science The Value of Work - New Sample Question Papers Study Material - QB365 Set A
NEW6th Standard CBSE
CBSE 6th Social Science Family and Community - New Sample Question Papers Study Material - QB365 Set A
NEW6th Standard CBSE
CBSE 6th Social Science India's Cultural Roots - New Sample Question Papers Study Material - QB365 Set A
NEW6th Standard CBSE
CBSE 6th Social Science India,That is Bharat - New Sample Question Papers Study Material - QB365 Set A
NEW6th Standard CBSE
CBSE 6th Social Science Timeline and sources of history - New Sample Question Papers Study Material - QB365 Set A
NEW6th Standard CBSE
CBSE 6th Social Science Oceans and Continents - New Sample Question Papers Study Material - QB365 Set A

Published on: 16/09/2019
Data Handling
Download CBSE Class 6th Standard CBSE Mathematics question papers, sample papers, important questions, and previous year solved papers in PDF format. Get free study materials, NCERT solutions, and exam preparation resources for Class 6th Standard CBSE Mathematics
Questions + Answers key
Take MCQ Mathematics Test
1.
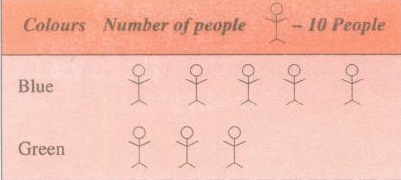

In the above example, the number of people who like red colour was taken as 50 + 5. If your friend wishes to take it as 50 + 8, is it acceptable?
2.
Which method is more useful when information from a much larger data is required?
3.
Which method is the best? Why?
4.
Complete the following table
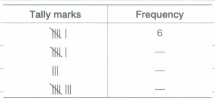
5.
Observe the following table and answer the related questions.
| Blood group | Number of students |
|---|---|
| A | 10 |
| B | 8 |
| O | 12 |
| AB | 15 |
(a) Which blood group is the most common?
(b) Which blood group is the rarest?
(c) What is the total number of students?
6.
In a pictograph, a symbol  represents 5 persons, then how many symbols represent 20 persons.
7.
What kind of data is collected directly from a source?
8.
Find the range of data 9, 7, 2, 6, 1, 3, 4, 12.
9.
What is the range of data?
10.
What are pictographs?
11.
What are bar graphs?
12.
What does represent in tally marks?
13.
What is data?
14.
How many values in bar graph is represented by each bar.
15.
Using tally marks, represent the numbers as symbol, 20, 19, 22, 21.
1.
No
2.
Ronald's table method is more useful.
3.
Ronald's table method is the best because it briefs the data.
4.

5.
(a) AB (b) b (c) 45
6.
Given, = 5 persons
\(\therefore\) 4 symbols. i.e, ii.png) represent 20 persons.
represent 20 persons.
7.
Primary data is collected directly from a source.
8.
Range of data = 12 - 1 = 11.
9.
The difference of maximum and minimum value of given data is called the range of data.
10.
The pictorial representation of the numerical data using pictures or symbols is called the pictograph of the data.
11.
Bar graph is a pictorial representation of data using bars of uniform width, with equal space in between two bars.
12.
It represents 5 (frequency).
13.
Information in raw or unorganised form (such as alphabets. numbers or symbols) that refer to, or represent conditions, ideas or objects.
14.
One
15.


6th Standard CBSE Syllabus & Materials
6th Standard CBSE
CBSE 6th Social Science Locating Places on the Earth - New Sample Question Papers Study Material - QB365 Set A
NEW6th Standard CBSE
CBSE 6th Science A Journey Through States of Water - New Sample Question Papers Study Material - QB365 Set A
NEW6th Standard CBSE
CBSE 6th Science Temperature and its Measurement - New Sample Question Papers Study Material - QB365 Set A
NEW6th Standard CBSE
CBSE 6th Science Materials Around Us - New Sample Question Papers Study Material - QB365 Set A



CBSE 6th Standard CBSE Subjects
CBSE Standards




