
 100% FREE ACCESS
6th Standard CBSE Syllabus & Materials
6th Standard CBSE
CBSE 6th Social Science The Value of Work - New Sample Question Papers Study Material - QB365 Set A
NEW6th Standard CBSE
CBSE 6th Social Science Family and Community - New Sample Question Papers Study Material - QB365 Set A
NEW6th Standard CBSE
CBSE 6th Social Science India's Cultural Roots - New Sample Question Papers Study Material - QB365 Set A
NEW6th Standard CBSE
CBSE 6th Social Science India,That is Bharat - New Sample Question Papers Study Material - QB365 Set A
NEW6th Standard CBSE
CBSE 6th Social Science Timeline and sources of history - New Sample Question Papers Study Material - QB365 Set A
NEW6th Standard CBSE
CBSE 6th Social Science Oceans and Continents - New Sample Question Papers Study Material - QB365 Set A

Published on: 13/08/2019
Data Handling
Download CBSE Class 6th Standard CBSE Mathematics question papers, sample papers, important questions, and previous year solved papers in PDF format. Get free study materials, NCERT solutions, and exam preparation resources for Class 6th Standard CBSE Mathematics
Questions + Answers key
Take MCQ Mathematics Test
1.
Observe the following table and answer the related questions.
| Blood group | Number of students |
|---|---|
| A | 10 |
| B | 8 |
| O | 12 |
| AB | 15 |
(a) Which blood group is the most common?
(b) Which blood group is the rarest?
(c) What is the total number of students?
2.
Find the range of data 9, 7, 2, 6, 1, 3, 4, 12.
3.
What are pictographs?
4.
What is data?
5.
How many values in bar graph is represented by each bar.
6.
Following are the number of electric bulbs purchased for a lodging house during the first four months of a year
| Months | Number of bulbs |
| January | 100 |
| February | 250 |
| March | 350 |
| April | 200 |
Represent the details by a pictograph.
7.
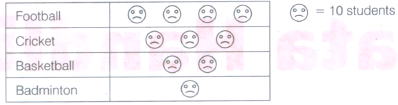
Rajesh was asked to find the number of students playing different games in the school. The information collected by him is as follows:
Football 40, Cricket 30, Basketball 20, Badminton 10 Represent the given information with a pictograph.
8.
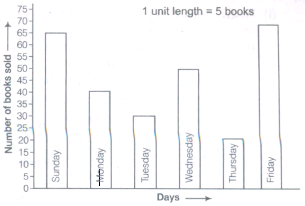
The number of Mathematics books sold by a shopkeeper on six consecutive days is shown below:
| Days | Sunday | Monday | Tuesday | Wednesday | Thursday | Friday |
| Number of books sold | 65 | 40 | 30 | 50 | 20 | 70 |
Draw a bar graph to represent the above information choosing the scale of your choice.
9.
In a Mathematics test, the following marks were obtained by 40 students. Arrange these marks in a table using tally marks.
| 8 | 1 | 3 | 7 | 6 | 5 | 5 | 4 | 4 | 2 |
| 4 | 9 | 5 | 3 | 7 | 1 | 6 | 5 | 2 | 7 |
| 7 | 3 | 8 | 4 | 2 | 8 | 9 | 5 | 8 | 6 |
| 7 | 4 | 5 | 6 | 9 | 6 | 4 | 4 | 6 | 6 |
(a) Find how many students obtained marks equal to or more than 7.
(b) How many students obtained marks below 4?
10.
The number of girl students in each class of a co-educational middle school is depicted by the pictograph.
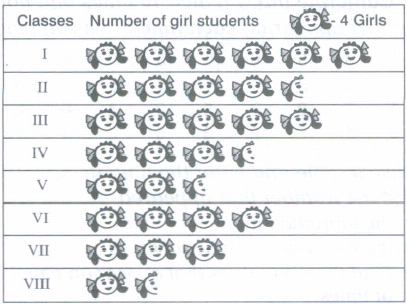
Observe this pictograph and answer the following questions.
(a) Which class has the minimum number of girl students?
(b) Is the number of girls in Class VI less than the number of girls in Class V?
(c) How many girls are there in Class VII?
11.
The following are the weight in kg of 20 students of a class 25, 16, 17, 15, 23, 10, 9, 15, 16, 17, 15, 16, 23, 25, 16, 15, 23, 9, 10, 16
Prepare a frequency distribution table for the given data.
12.
Following is the choice of sweets for 30 students of class VI. Ladoo, Batii, Ladoo, Jalebi, Ladoo, Rasgu1la, Jalebi, Ladoo, Barii, Rasgulla, Ladoo, Jalebi, Jalebi, Rasgulla, Ladoo, Rasgulla, Jalebi, Ladoo, Rasgulla, Ladoo, Ladoo, Batti, Rasgulla, Rasgulla, Jalebi, Rasgulla, Ladoo, Rasgulla, Jalebi and Ladoo.
(a) Arrange the names of sweets in a table using tally marks.
(b) Which sweet is preferred by most of the students?
13.
Observe the following pictograph and answer the related questions :
| Day | Number of students present |
|---|---|
| \(\Box\) = 10 students | |
| Monday | \(\Box\) \(\Box\) \(\Box\) \(\Box\) \(\Box\) \(\Box\) |
| Tuesday | \(\Box\) \(\Box\) \(\Box\) \(\Box\) \(\Box\) |
| Wednesday | \(\Box\) \(\Box\) \(\Box\) \(\Box\) |
| Thursday | \(\Box\) \(\Box\) \(\Box\) \(\Box\) \(\Box\) \(\Box\) \(\Box\) \(\Box\) |
| Friday | \(\Box\) |
| Saturday | \(\Box\) \(\Box\) |
On which day were the maximum number of students present?
Monday
Thursday
Tuesday
Saturday
14.
The marks obtained by 10 students in Mathematics test are given below:
| 55 | 36 | 95 | 73 | 62 |
| 42 | 25 | 78 | 75 | 62 |
Answer the following related questions:
How many students got marks between 60 and 75?
1
2
3
4
15.
The marks obtained by 10 students in Mathematics test are given below:
| 55 | 36 | 95 | 73 | 62 |
| 42 | 25 | 78 | 75 | 62 |
Answer the following related questions:
The difference between the maximum and minimum marks obtained is
60
50
70
80
16.
The marks obtained by 10 students in Science test are given below:
53, 36, 95, 73, 62, 42, 25, 78, 75, 62
Answer the following questions that are related to the given data.
How many students got marks below 62?
3
4
5
2
17.
The marks obtained by 10 students in Science test are given below:
53, 36, 95, 73, 62, 42, 25, 78, 75, 62
Answer the following questions that are related to the given data.
The minimum marks obtained by any student is
42
36
25
73
18.
Using tally marks, which one of the following represents the number eight?
IIII II
.png)
.png)
.png)
19.
On the scale of 1 unit length = 10 crore, the bar of length 6 units will represent _________ crore and of ________ units will represent 75 crore.
20.
An observation occurring seven times in a data is represented as ________ using tally marks.
21.
In bar graph, width of rectangle is always ___________.
22.
The data can be arranged in a tabular form using _________ marks.
23.
In a bar graph, the gap between two consecutive bars may not be the same.
24.
In a bar graph, bars of uniform width are drawn vertically only.
25.
Tally marks |||| representnts 4.
26.
An observation occurring five times in a data is recorded as IIIII, using tally marks.
27.
To represent the population of different towns using bar graph, it is convenient to take one unit length to represent one person.
1.
(a) AB (b) b (c) 45
2.
Range of data = 12 - 1 = 11.
3.
The pictorial representation of the numerical data using pictures or symbols is called the pictograph of the data.
4.
Information in raw or unorganised form (such as alphabets. numbers or symbols) that refer to, or represent conditions, ideas or objects.
5.
One
6.
Let i.png) represents 100 bulbs.
represents 100 bulbs.
ii.png)
7.
Given, information by Rajesh
Football \(\rightarrow\) 40, Cricket \(\rightarrow\) 30, Basketball \(\rightarrow\) 20, Badminton \(\rightarrow\) 10
The given data can be represented by a pictograph as shown below:
8.
To draw a bar graph, we will use the following steps:
(i) Firstly, draw two perpendicular lines, one is horizontal and one is vertical. Along the horizontal line, mark 'days' and along the vertical line mark 'number of books sold'.
(ii) Now, take scale of 1 unit length = 5 books, along the vertical line and then mark the corresponding values.
Also, the heights of the bars for various days are as follows:
| Sunday | \(\frac{65}{5}=13\) units |
| Monday | \(\frac{40}{5}=8\) units |
| Tuesday | \(\frac{30}{5}=6\) units |
| Wednesday | \(\frac{50}{5}=10\) units |
| Thursday | \(\frac{20}{5}=4\) units |
| Friday | \(\frac{70}{5}=14\) units |
(iii) Drawbars of equal width and of height calculated in Step (ii) on the horizontal line with equal spacing (or gap) between them.
Thus, we get the following bar graph.
9.
The table with tally marks is shown below:
| Marks | Tally marks | Number of students |
| 1 | II | 2 |
| 2 | III | 3 |
| 3 | III | 3 |
| 4 | .png) |
7 |
| 5 | .png) |
6 |
| 6 | |
7 |
| 7 | .png) |
5 |
| 8 | IIII | 4 |
| 9 | III | 3 |
| Total | 40 |
(a) Here, we have to find out the students, who obtained marks equal to 7 or more than 7. So, we have to add the number of students who obtained marks equal to 7 or more than 7 i.e. 7, 8 and 9.
\(\therefore\) Number of those students = 5 + 4 + 3 = 12
Hence, 12 students obtained marks equal to 7 or more than 7.
(b) Here, we have to find out the students who obtained marks below 4.
So, we have to add the number of students who obtained marks below 4 i.e. 1, 2 and 3.
\(\therefore\) Number of those students = 3 + 3 + 2 = 8
Hence, 8 students obtained marks below 4.
10.
In the given pictograph, 1 picture = 4 girls, half picture = 2 girls
(a) Observing the pictograph, it is clear that the minimum number of girl students are in class VIII i.e. 4 + 2 = 6
(b) Observing the pictograph, it is clear that Number of girls in class VI = 4 x 4 = 16 and number of girls in class V = 2 x 4 + 1 x 2 = 8 + 2 = 10
\(\therefore\) 10 < 16
So, it is clear that number of girls in class VI is not Iess than the number of girls in class V.
(c) Observing the pictograph, number of girls in class VII = 3 x 4 = 12.
11.
| Weight of students | Tally marks | Number of students |
| 9 | I I | 2 |
| 10 | I I | 2 |
| 15 | I I I I | 4 |
| 16 | I I I I | 5 |
| 17 | I I | 2 |
| 23 | I I I | 3 |
| 25 | I I | 2 |
12.
(a) The table with tally marks is shown below:
| Sweets | Tally marks | Number of students |
| Ladoo | .png) |
11 |
| Barfi | III | 3 |
| Jalebi | .png) |
7 |
| Rasgulia | .png) |
9 |
| Total | 30 |
(b) By examine the above table, we see that Ladoo is preferred by most of the students. i.e. 11 students.
13.
(b)
Thursday
14.
(c)
3
15.
(c)
70
16.
(b)
4
17.
(c)
25
18.
(d)
19.
()
60, \(7\frac{1}{2}\)
20.
()
21.
()
same
22.
()
tally
23.
(b)
24.
(b)
25.
(a)
26.
(b)
27.
(b)

6th Standard CBSE Syllabus & Materials
6th Standard CBSE
CBSE 6th Social Science Locating Places on the Earth - New Sample Question Papers Study Material - QB365 Set A
NEW6th Standard CBSE
CBSE 6th Science A Journey Through States of Water - New Sample Question Papers Study Material - QB365 Set A
NEW6th Standard CBSE
CBSE 6th Science Temperature and its Measurement - New Sample Question Papers Study Material - QB365 Set A
NEW6th Standard CBSE
CBSE 6th Science Materials Around Us - New Sample Question Papers Study Material - QB365 Set A



CBSE 6th Standard CBSE Subjects
CBSE Standards




