
 100% FREE ACCESS
6th Standard CBSE Syllabus & Materials
6th Standard CBSE
CBSE 6th Social Science The Value of Work - New Sample Question Papers Study Material - QB365 Set A
NEW6th Standard CBSE
CBSE 6th Social Science Family and Community - New Sample Question Papers Study Material - QB365 Set A
NEW6th Standard CBSE
CBSE 6th Social Science India's Cultural Roots - New Sample Question Papers Study Material - QB365 Set A
NEW6th Standard CBSE
CBSE 6th Social Science India,That is Bharat - New Sample Question Papers Study Material - QB365 Set A
NEW6th Standard CBSE
CBSE 6th Social Science Timeline and sources of history - New Sample Question Papers Study Material - QB365 Set A
NEW6th Standard CBSE
CBSE 6th Social Science Oceans and Continents - New Sample Question Papers Study Material - QB365 Set A

Published on: 19/01/2019
Data Handling Complete Study Material
Download CBSE Class 6th Standard CBSE Mathematics question papers, sample papers, important questions, and previous year solved papers in PDF format. Get free study materials, NCERT solutions, and exam preparation resources for Class 6th Standard CBSE Mathematics
Questions + Answers key
Take MCQ Mathematics Test
1.
How many (\(\surd \)) marks are there against guava?
2.
What kind of data is collected directly from a source?
3.
What is the range of data?
4.
Using tally marks, represent the numbers as symbol, 20, 19, 22, 21.
5.
The number of students who absent from the class during a week are given below:
| Day | Monday | Tuesday | Wednesday | Thursday | Friday |
| Number of absentees | 20 | 15 | 10 | 20 | 25 |
Draw a pictograph using the symbol  which represents 10 students.
6.
Write the name of way in which data is represented using images.
7.
A survey of 100 school students was done to find which activity they prefer to do in their free time.
| Preferred activity | Number of students |
|---|---|
| Playing | 35 |
| Reading story books | 20 |
| Watching TV | 30 |
| Listening to music | 10 |
| Painting | 5 |
Draw a bar graph to illustrate the above data taking scale of 1 unit length=5 students. Which activity is preferred by most of the students other than playing?
8.
Soniya saves Rs 500 in January, Rs 700 in February, Rs 600 in March, Rs 750 in April and Rs 900 in May.
(a) Draw a bar graph to represent Soniya's saving.
(b) In which month, her saving is maximum?
(c) What value is depicted by Soniya?
9.
The number of scouts in a school is depicted by the following pictograph.
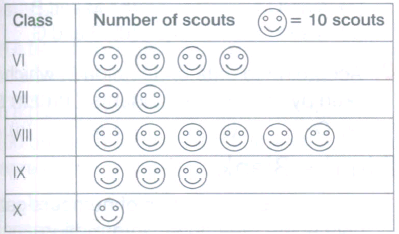
Observe the pictograph and answer the following questions.
(a) Which class has the minimum number of scouts?
(b) Which class has the maximum number of scouts?
(c) How many scouts are there in class VI?
(d) Which class has exactly four times the scouts as that of class X?
(e) What is the total number of scouts in the classes VI to X?
10.
Number of persons in various age groups in a town is given in the following table
| Age group | Number of persons |
| 1 - 14 | 2 lakh |
| 15 - 29 | 1 lakh 60 thousand |
| 30 - 44 | 1 lakh 20 thousand |
| 45 - 59 | 1 lakh 20 thousand |
| 60 - 74 | 80 thousand |
| 75 and above | 40 thousand |
Draw a bar graph to represent the above information and answer the following questions.
(take 1 unit length = 20 thousands)
(a) Which two age groups have same population?
(b) All persons in the age group of 60 and above are called senior citizens. How many senior citizens are therein the town?
11.
In a Mathematics test, the following marks were obtained by 40 students. Arrange these marks in a table using tally marks.
| 8 | 1 | 3 | 7 | 6 | 5 | 5 | 4 | 4 | 2 |
| 4 | 9 | 5 | 3 | 7 | 1 | 6 | 5 | 2 | 7 |
| 7 | 3 | 8 | 4 | 2 | 8 | 9 | 5 | 8 | 6 |
| 7 | 4 | 5 | 6 | 9 | 6 | 4 | 4 | 6 | 6 |
(a) Find how many students obtained marks equal to or more than 7.
(b) How many students obtained marks below 4?
12.
Thirty students were interviewed to find out who they want to be in future. Their responses are listed as below:
doctor, engineer, doctor, pilot, officer, doctor, engineer, doctor, pilot, officer, pilot, engineer, officer, pilot, doctor, engineer, pilot, officer, doctor, officer, doctor, pilot, engineer, doctor, pilot, officer, doctor, pilot, doctor, engineer.
Arrange the data in a table using tally marks.
13.
The following pictograph depicts the information about the areas in sq km (to nearest hundred) of some districts of Chhattisgarh State.
.png)
(a) What is the area of Karia district?
(b) Which two districts have the same area?
(c) How many districts have area more than 5000 square kilometres?
14.
The following bar graph shows the number of people'TAJ MAHAL' over a period of 5 months.
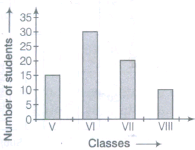
Use the graph to answer the following questions.
(a) How many people visited the 'TAJ MAHAL' in April?
(b) How many more people visited the 'TAJ MAHAL' in May than in January?
(c) In which month, were there as many visitors as in March?
(d) In which month, were there 1500 more visitors than in January?
(e) How many visitors were there in 5 months?
15.
The number of tins of paint sold by three different shops are given below:
| Shops | Number of tins of paint |
| Shop A | 80 |
| Shop B | 140 |
| Shop C | 180 |
Draw a pictograph and answer the following questions.
(a) What is the total profit of shop A, if the profit gained on each tin is 150?
(b) If the total number of tins sold is 400, how many figures must be drawn for shop C?
(c) Find the difference between the number of tins sold by shop B and the number of tins sold by shop C. Use scale  = 20 tins.
16.
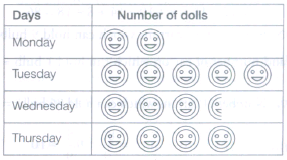
A factory made 200 dolls on Monday, 500 dolls on Tuesday, 350 dolls on Wednesday and 400 dolls on Thursday. Represent the information in the form of pictograph.
17.
In a village, six fruit merchants sold the following number of fruit baskets in a particular season.
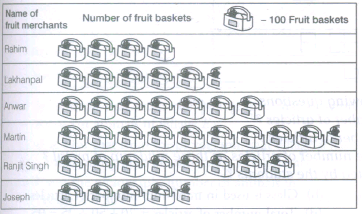
Observe this pictograph and answer the following questions.
(a) Which merchant sold the maximum number of baskets?
(b) How many fruit baskets were sold by Anwar?
(c) The merchants who have sold 600 or more number of baskets are planning to buy a godown for the next season. Can you name them?
18.
Following is the choice of sweets for 30 students of class VI. Ladoo, Batii, Ladoo, Jalebi, Ladoo, Rasgu1la, Jalebi, Ladoo, Barii, Rasgulla, Ladoo, Jalebi, Jalebi, Rasgulla, Ladoo, Rasgulla, Jalebi, Ladoo, Rasgulla, Ladoo, Ladoo, Batti, Rasgulla, Rasgulla, Jalebi, Rasgulla, Ladoo, Rasgulla, Jalebi and Ladoo.
(a) Arrange the names of sweets in a table using tally marks.
(b) Which sweet is preferred by most of the students?
19.
Observe the following bar graph and answer the related questions:
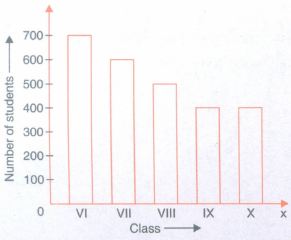
What is the ratio of the number of students of class X and class IX?
1 : 1
1 : 2
2 : 1
1 : 4
20.
Observe the following bar graph and answer the related questions:
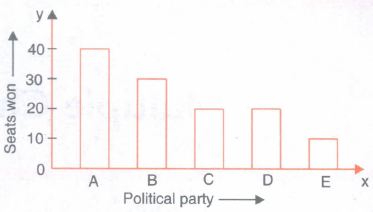
Which political party won the maximum number of seats?
A
B
C
D
21.
Observe the following pictograph and answer the related questions :
| Day | Number of students present |
|---|---|
| \(\Box\) = 10 students | |
| Monday | \(\Box\) \(\Box\) \(\Box\) \(\Box\) \(\Box\) \(\Box\) |
| Tuesday | \(\Box\) \(\Box\) \(\Box\) \(\Box\) \(\Box\) |
| Wednesday | \(\Box\) \(\Box\) \(\Box\) \(\Box\) |
| Thursday | \(\Box\) \(\Box\) \(\Box\) \(\Box\) \(\Box\) \(\Box\) \(\Box\) \(\Box\) |
| Friday | \(\Box\) |
| Saturday | \(\Box\) \(\Box\) |
The number of students present on Friday is
10
20
40
50
22.
Observe the following table and answer the related questions:
| Blood groups | Number of students |
|---|---|
| A | 9 |
| B | 6 |
| O | 12 |
| AB | 3 |
| Total | 30 |
The ratio of the frequencies of blood groups AB and B is
1 : 2
1 : 3
2 : 3
3 : 4
23.
The marks obtained by 10 students in Mathematics test are given below:
| 55 | 36 | 95 | 73 | 62 |
| 42 | 25 | 78 | 75 | 62 |
Answer the following related questions:
How many students got marks below 60?
1
2
3
4
24.
The marks obtained by 10 students in Mathematics test are given below:
| 55 | 36 | 95 | 73 | 62 |
| 42 | 25 | 78 | 75 | 62 |
Answer the following related questions:
The difference between the maximum and minimum marks obtained is
60
50
70
80
25.
The choices of the fruits of 42 students in a class are as follows.
A, O, B, M, A, G, B, G, A, G, B, M, A, G, M, A, B, G, M, B, A, O, M, O, G, B, O, M, G, A, A, B, M, O, M, G, B, A, M, O, M, O
Where A, B, G, M and O stand for the fruits Apple, Banana, Grapes, Mango and Orange respectively.
Which two fruits are liked by an equal number of students?
A and M
M and B
B and O
B and G
26.
The marks obtained by 10 students in Science test are given below:
53, 36, 95, 73, 62, 42, 25, 78, 75, 62
Answer the following questions that are related to the given data.
The minimum marks obtained by any student is
42
36
25
73
27.
The marks (out of 10) obtained by 28 students in a Mathematics test are listed as given below:
8, 1, 2, 6, 5, 5, 5, 0, 1, 9, 7, 8, 0, 5, 8, 3, 0, 8, 10, 10, 3, 4, 8, 7, 8, 9, 2, 0
, the number of students who scored marks less than 4 is
15
13
12
10
28.
Using tally marks, which one of the following represents the number eight?
IIII II
.png)
.png)
.png)
29.
In a pictograph, if a symbol * represents 20 flowers in a basket, then *** stands for _________ flowers.
30.
In a bar graph, bars of __________ width can be drawn horizontally or vertically with ________ spacing between them.
31.
In bar graph, width of rectangle is always ___________.
32.
A _____________ represents data through pictures of objects.
33.
A _________ is a collection of numbers gathered to give some meaningful information.
34.
In a bar graph, the gap between two consecutive bars may not be the same.
35.
In a pictograph, if a symbol .png) represents 100 books in a library shelf, then the symbol
represents 100 books in a library shelf, then the symbol .png) represents 50 books.
represents 50 books.
36.
In a bar graph, bars of uniform width are drawn vertically only.
37.
Tally marks |||| representnts 4.
38.
Pictographs and bar graphs are pictorial representations of the numerical data.
1.
There are four (\(\surd \)) marks against guava.
2.
Primary data is collected directly from a source.
3.
The difference of maximum and minimum value of given data is called the range of data.
4.

5.
Let represents 10 students.
.png)
6.
Pictograph.
7.
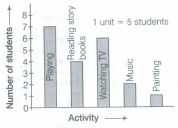
Watching TV is preferred by most of the studentsother than playing.
8.
(a) Let 1 unit length = Rs 100
.png)
(b) In May, her saving is maximum.
(c) Economy saving for future planning.
9.
(a) Class X has minimum number of scouts i.e. 10.
(b) Class VIII has maximum number of scouts i.e. 60.
(c) Number of scouts in class VI = 40
(d) Number of scouts in class X =10
Hence. class VI has exactly four times the scouts as that of class X.
(e) Total number of scouts in classes VI to X
= 40 + 20 + 60 + 30 + 10 = 160.
10.
To draw the bar graph, we will use the following steps:
(i) Firstly, draw two perpendicular lines, one is horizontal and one is vertical. Along the horizontal line, mark 'age-group' and along vertical line mark 'number of persons'.
(ii) Now, take scale of 1 unit length = 20000 along the vertical line and then mark the corresponding values.
Also, the heights of bars for various groups are as follows:
| 1-14 | \(\frac{200000}{20000}=10\) units |
| 15-29 | \(\frac{160000}{20000}=8\) units |
| 30-44 | \(\frac{120000}{20000}=6\) units |
| 45-59 | \(\frac{120000}{20000}=6\) units |
| 60-74 | \(\frac{80000}{20000}=4\) units |
| 75 and above | \(\frac{40000}{20000}=2\) units |
(iii) Draw bar of equal width and of height calculated in Step (ii) on the horizontal line with equal gaps between them.
Thus,we get the following bar graph
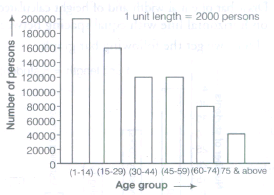
(a) From bar graph, we see that the lengths of bars for age group 30-44 and 45-59 are same, so age group (30 - 44) and (45 - 59) have the same population.
(b) Persons having age 60 or above are called senior citizens.
\(\therefore\) Number of senior citizens in the town
= Number of persons of age group (60 - 74) + Number of persons of age 75 and above
= 80000 + 40000 = 120000.
11.
The table with tally marks is shown below:
| Marks | Tally marks | Number of students |
| 1 | II | 2 |
| 2 | III | 3 |
| 3 | III | 3 |
| 4 | .png) |
7 |
| 5 | .png) |
6 |
| 6 | |
7 |
| 7 | .png) |
5 |
| 8 | IIII | 4 |
| 9 | III | 3 |
| Total | 40 |
(a) Here, we have to find out the students, who obtained marks equal to 7 or more than 7. So, we have to add the number of students who obtained marks equal to 7 or more than 7 i.e. 7, 8 and 9.
\(\therefore\) Number of those students = 5 + 4 + 3 = 12
Hence, 12 students obtained marks equal to 7 or more than 7.
(b) Here, we have to find out the students who obtained marks below 4.
So, we have to add the number of students who obtained marks below 4 i.e. 1, 2 and 3.
\(\therefore\) Number of those students = 3 + 3 + 2 = 8
Hence, 8 students obtained marks below 4.
12.
We draw the following table using tally marks for given information.
| Responses | Tally marks | Number of responses |
| Doctor | |
10 |
| Engineer | |
6 |
| Pilot | |
8 |
| Officer | |
6 |
13.
(a) Area of Karia district = 6000 sq km
(b) Raigarh and Jashpur have the same area.
(c) Four districts have area more than 5000 sq km.
14.
(a) 3500
(b) 500
(c) January
(d) April
(e) 55.
15.
Let represents 20 tins of paint.
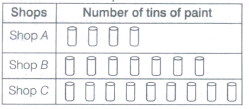
(a) Rs 12000
(b) 9 tins
(c) 40 tins.
16.
Here, given production of dolls. Monday - 200, Tuesday - 500 Wednesday - 350, Thursday - 400
Let us assume that
100 may be represented by .png)
50 may be represented by .png)
Thus, the pictograph would be
17.
(a) Hence, Martin sold the maximum number of baskets i.e. 950.
(b) From (a), Anwar sold 700 fruit baskets.
(c) Yes, after observing the pictograph, we can say that Anwar, Martin and Ranjit Singh have sold 600 or more number of baskets and they are planning to buy a godown for the next season.
18.
(a) The table with tally marks is shown below:
| Sweets | Tally marks | Number of students |
| Ladoo | .png) |
11 |
| Barfi | III | 3 |
| Jalebi | .png) |
7 |
| Rasgulia | .png) |
9 |
| Total | 30 |
(b) By examine the above table, we see that Ladoo is preferred by most of the students. i.e. 11 students.
19.
(a)
1 : 1
20.
(a)
A
21.
(a)
10
22.
(a)
1 : 2
23.
(d)
4
24.
(c)
70
25.
(d)
B and G
26.
(c)
25
27.
(d)
10
28.
(d)
29.
()
60
30.
()
Uniform, equal
31.
()
same
32.
()
Pictograph
33.
()
data
34.
(b)
35.
(b)
36.
(b)
37.
(a)
38.
(a)

6th Standard CBSE Syllabus & Materials
6th Standard CBSE
CBSE 6th Social Science Locating Places on the Earth - New Sample Question Papers Study Material - QB365 Set A
NEW6th Standard CBSE
CBSE 6th Science A Journey Through States of Water - New Sample Question Papers Study Material - QB365 Set A
NEW6th Standard CBSE
CBSE 6th Science Temperature and its Measurement - New Sample Question Papers Study Material - QB365 Set A
NEW6th Standard CBSE
CBSE 6th Science Materials Around Us - New Sample Question Papers Study Material - QB365 Set A



CBSE 6th Standard CBSE Subjects
CBSE Standards




