
 100% FREE ACCESS
8th Standard CBSE Syllabus & Materials
8th Standard CBSE
CBSE 8th Social Science Theme D - Factors of Production - New Model Questions Papers Study Material - QB365 Set A
NEW8th Standard CBSE
CBSE 8th Social Science Theme C - Universal Franchise and India's Electoral System - New Model Questions Papers Study Material - QB365 Set A
NEW8th Standard CBSE
CBSE 8th Social Science Theme B - The Rise of the Marathas - New Model Questions Papers Study Material - QB365 Set A
NEW8th Standard CBSE
CBSE 8th Social Science Theme B - Reshaping India's Political Map - New Model Questions Papers Study Material - QB365 Set A
NEW8th Standard CBSE
CBSE 8th Social Science Theme A - Natural Resources and Their Use - New Model Questions Papers Study Material - QB365 Set A
NEW8th Standard CBSE
CBSE 8th Science Keeping Time with Skies - New Model Questions Papers Study Material - QB365 Set A

Published on: 28/09/2019
Introduction to Graphs
Download CBSE Class 8th Standard CBSE Mathematics question papers, sample papers, important questions, and previous year solved papers in PDF format. Get free study materials, NCERT solutions, and exam preparation resources for Class 8th Standard CBSE Mathematics
Questions + Answers key
Take MCQ Mathematics Test
1.
Draw a graph for the following:
| Side of square (in cm) | 2 | 3 | 4 | 5 | 6 |
| Perimeter (in cm2) | 4 | 9 | 16 | 25 | 36 |
Is it a linear graph?
2.
The following chart gives the growth in height (in terms of percentage) of boys and girls with their respective ages:
| Age(in yr) | 8 | 9 | 10 | 11 | 12 | 13 | 14 | 15 | 16 | 17 | 18 |
| Boys | 72% | 75% | 78% | 81% | 84% | 88% | 92% | 95% | 98% | 99% | 100% |
| Girls | 77% | 81% | 84% | 88% | 91% | 95% | 98% | 99% | 99.5% | 100% | 100% |
Draw the line graph of above data on the same sheet and answer the following question
(i) In which year both the boys and the girls achieve their maximum height?
(ii) Who grows faster at puberty (14-16 yr of age)?
3.
If x and y-coordinates are related to y = 4x - 4 then draw the graph by taking x = 1,3,5 and 8 also find the values of y when x = 9 and x = 7
4.
If y-coordinate is 5/2 times of x-coordinate.Then, formed a table for it and draw a graph.
5.
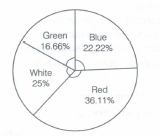
The following table shows the colours preferred by students of a Class VIII :
| Colours | White | Red | Blue | Green |
| Number of students | 9 | 13 | 8 | 6 |
Represent this data in the form of pie diagram (approx).
6.
Locate the points A(1,2), B(4,2) and C(1, 4) on a graph sheet taking suitable axes. Write the coordinates of the fourth point D to complete the rectangle ABCD.
7.
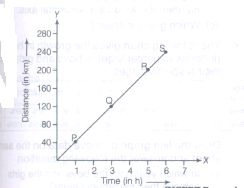
Study the distance-time graph given below for a car to travel to certain places and answer the questions that follow.
(a)How far does the car travel in 2 h?
(b) How much time does the car take to reach R?
(c) How long does the car take to cover 80 km?
(d) How far is Q from the starting point?
(e) When does the car reach the place S after starting?
8.
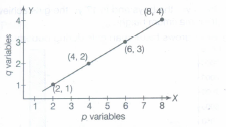
Plot a line graph for the variables p and q where p is two times q, l.e. the equation is p =2q.
Then, find
(a) the value of p when q = 3.
(b) the value of q when p =8.
9.
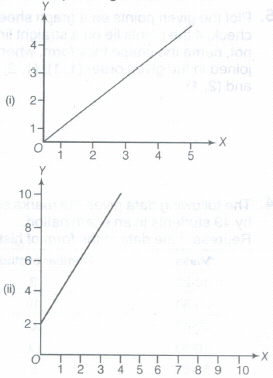
Study the given graphs (i) and (ii) and complete the corresponding tables below.
(i)
| x | 0 | 1 | 2 | 3 |
| y |
(ii)
| x | 0 | 1 | 2 | 3 | 4 |
10.
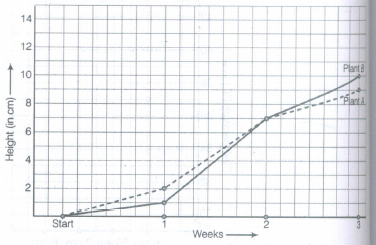
For an experiment in Botany, two different plants, plant A and plant B were grown under similar laboratory conditions. Their heights were measured at the end of each week for 3 weeks. The results are shown by the following graph:
(a) How high was plant A after (i) 2 weeks (ii) 3 weeks?
(b) How high was plant B after (i) 2 weeks (ii) 3 weeks?
(c) How much did plant A grow during the 3rd week?
(d) How much did plant B grow from the end of the 2nd week to the end of the 3rd week?
(e) During which week did plant A grow most?
(f) During which week did plant B grow least?
(g) Were the two plants of the same height during any week shown here? Specify.
1.
.PNG)
Scale:
On horizontal axis: 2 units = 2 cm
On vertical axis: 1 unit = 2 cm
1. Mark side of the square (in em) on horizontal axis.
2. Mark area (in cm2) on vertical axis.
3. Plot the points (2, 4) (3, 9), (4, 16), (5, 25) and (6, 36).
4. Join the points.
The graph we get is not linear.
2.
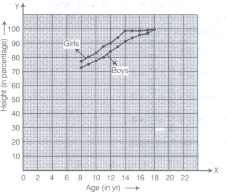
(i) In 18 yr, the boys and in 17 yr, the girls achieve their maximum height.
(ii) Boys grows faster than girls during puberty.
3.
y = 32,24
4.
| x | 2 | 4 | 6 | 8 |
|---|---|---|---|---|
| \(Y=\frac { 5 }{ 2 } x\) | 5 | 10 | 15 | 20 |
5.
Number of students like white = 9
Number of students like red = 13
Number of students like blue = 8
Number of students like green = 6
\(\therefore\) Total number of students = 9 + 13 + 8 + 6 = 36
Now, percentage of students like white \(={9\over 36}\times100={900 \times 36}=25\%\)
Percentage of students like red \(={13\over 36}\times100={1300\times36}=36.11\%\)
Percentage of students like blue
\(={8\times 36}\times 100={800 \times 36}=22.22\%\)
6.
Given, points are A(1, 2),B(4,2)and C(1, 4). Location of given points on the graph given below:
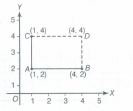
To complete the rectangle ABCD, the coordinate of the fourth point D is (4, 4), i.e. D (4, 4).
7.
(a) From the given graph, the car travel in 2 h is 80km.
(b) 5 h taken by car to reach R.
(c) 2 h taken by car to cover 80 km.
8.
Given equation is p = 2q.
If p = 2, then q = \({p\over2}={2\over 2}=1\)
If p = 4, then q = \({p\over2}={4\over2}=2\)
If p = 6, then q = \({p\over2}={6\over2}=3\)
If p = 8, then q = \({p \over 2}={8\over 2}=4\)
Hence, table for the graph,
| p | 2 | 4 | 6 | 8 |
| q | 1 | 2 | 3 | 4 |
9.
Graph (i) shows x = y
If x = 0, then y = 0; If x =1, then y =1
If x =2, then y =2; If x =3, then y = 3
| x | 0 | 1 | 2 | 3 |
| y | 0 | 1 | 2 | 3 |
Graph (ii) shows that, y = 2x + 2, because,
If x = 0, then y = 2; If x =1, then y = 4
If x = 2, then y = 6; If x = 3 then y = 8
| x | 0 | 1 | 2 | 3 |
| y | 2 | 4 | 6 | 8 |
10.
(a) (i) From given graph, it is clear that the plant A was 7 cm high after 2 weeks.
(ii) From given graph, it is clear that the plant A was 9 cm high after 3 weeks.
(b) (i) From the given graph, it is clear that the plant B was 7 em high after 2 weeks.
(ii) From the given graph, it is clear that the plant B was 10 ern high after 3 weeks.
At the end of 2nd week height of plant A = 7 cm and at the end of 3rd week height of plant A = 9 cm
\(\therefore\) Increasing height of plant A from 2nd week to 3rd week = (9 - 7) = 2 cm
Hence, during the 3rd week plant, A grow 2 cm.
(d) At the end of 2nd week height of plant B = 7 cm and at the end of the 3rd week height of the plant B = 10 cm
\(\therefore\) Difference between the height from end of the 2nd week to 3rd week = (10 - 7) cm = 3 cm
Hence, the plant B grow 3 cm from the end of 2nd week to the end of 3rd week.
(e) From given graph.
\(\therefore\) Growth of plant A in 1st week = Height at the end of 1st week - Height at the starting of 2nd week
= 2 cm - 0 cm = 2 cm
\(\therefore\) Growth of plant A in 2nd week = Height at the end of 2nd week - Height at the starting of 2nd week
= 7 cm- 2 cm = 5 cm
\(\therefore\) Growth of plant A in 3rd week = Height at the end of 3rd week - Height at the starting of 3rd week
= 9 cm - 7 cm = 2 cm
So, we can say that the plant A grow mostly in 2nd week i.e. 5 cm.
(f) From given graph,
\(\therefore\) Growth of plant B in 1st week = Height at the end of 1stweek - Height at the starting 1st week
= 1 cm- 0 cm = 1 cm
\(\therefore\) Growth of plant B in 2nd week = Height at the end of 2nd week - Height at the starting of 2nd week
= 7 cm- 1 cm= 6 cm
\(\therefore\) Growth of plant B in 3rd week = Height at the end of 3rd week - Height at the starting of 3rd week
= 10 cm- 7 cm= 3 cm
So, we can say that the plant B grow least in 1st week i.e.1cm.
(g) From given graph, it is clearly shown that at the end of 2nd week, both the plants were of the same height i.e. 7 cm.

8th Standard CBSE Syllabus & Materials
8th Standard CBSE
CBSE 8th Science Particulate Nature of Matter - New Model Questions Papers Study Material - QB365 Set A
NEW8th Standard CBSE
CBSE 8th Science Pressure, Winds, Stroms and Cyclones - New Model Questions Papers Study Material - QB365 Set A
NEW8th Standard CBSE
CBSE 8th Mathematics Quadrilaterals - New Model Questions Papers Study Material - QB365 Set A
NEW8th Standard CBSE
CBSE 8th Mathematics A story of Numbers - New Model Questions Papers Study Material - QB365 Set A



CBSE 8th Standard CBSE Subjects
CBSE Standards




