
 100% FREE ACCESS
8th Standard CBSE Syllabus & Materials
8th Standard CBSE
CBSE 8th Social Science Theme D - Factors of Production - New Model Questions Papers Study Material - QB365 Set A
NEW8th Standard CBSE
CBSE 8th Social Science Theme C - Universal Franchise and India's Electoral System - New Model Questions Papers Study Material - QB365 Set A
NEW8th Standard CBSE
CBSE 8th Social Science Theme B - The Rise of the Marathas - New Model Questions Papers Study Material - QB365 Set A
NEW8th Standard CBSE
CBSE 8th Social Science Theme B - Reshaping India's Political Map - New Model Questions Papers Study Material - QB365 Set A
NEW8th Standard CBSE
CBSE 8th Social Science Theme A - Natural Resources and Their Use - New Model Questions Papers Study Material - QB365 Set A
NEW8th Standard CBSE
CBSE 8th Science Keeping Time with Skies - New Model Questions Papers Study Material - QB365 Set A

Published on: 21/10/2025
Download CBSE Class 8th Standard CBSE Mathematics question papers, sample papers, important questions, and previous year solved papers in PDF format. Get free study materials, NCERT solutions, and exam preparation resources for Class 8th Standard CBSE Mathematics
Questions + Answers key
Take MCQ Mathematics Test
1.
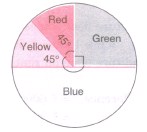
Observe the pie chart and answer the following question:
A child has a block in the shape of a cube with one letter written on each face as shown below:

The cube is thrown once. What is the probability of getting A?
\(\frac{1}{3}\)
\(\frac{1}{6}\)
\(\frac{1}{2}\)
\(\frac{1}{4}\)
2.
Observe the pie chart and answer the following question:
The difference of the central angles for green and blue is
45°
90°
180°
22\(\frac { { 1 }^{ 0 } }{ 2 } \).
3.
Observe the pie chart and answer the following question:
Which colour has the greatest central angle?
Red
Yellow
Green
Blue
4.
Observe the pie chart and answer the following question:
Which two colours have the same central angles?
Red, yellow
Red, green
Yellow, green
Blue, red
5.
Observe the pie chart given below and answer the following question:
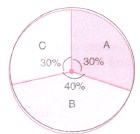
What is the difference between the central angles for sector B and sector C?
36°
72°
9°
81°
6.
Observe the pie chart given below and answer the following question:
The central angle for sector B is
108°
144°
72°
120°
7.
Observe the pie chart given below and answer the following question:
The central angle for sector A is
108°
144°
72°
150°
8.
Observe the histogram and answer the question given below:
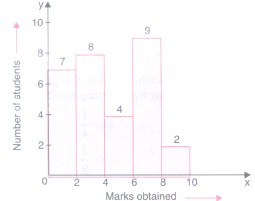
The number of students getting marks less than 4 is
10
15
7
8
9.
Observe the histogram and answer the question given below:
The number of students getting marks 4 to less than 6 is
2
4
6
8
10.
Study the following frequency distribution table and answer the question given below:
| Daily wages (in Rs) | Number of workers |
| 290-325 | 5 |
| 325-360 | 2 |
| 360-395 | 4 |
| 395-430 | 6 |
| 430-465 | 7 |
| 465-500 | 5 |
The class with highest frequency is
430-465
465-500
395-430
290-325
11.
Tally marks are used to represent
Lower limits
upper limits
range
frequency
12.
Tally marks are used to find which of the following
frequency
lower limits
upper limits
clan marks.
13.
In histogram which of the following is represented by heights of the rectangles?
frequency
class intervals
clan size
range
14.
The range of the data: 6, 14,20, 16,6,5,4, 18,25, 15 and 5 is
4
21
25
20
15.
A coin is tossed 12 times and the outcomes are observed as shown below:
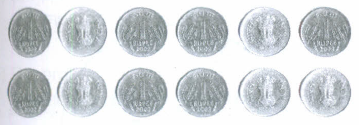
The chance of occurrence of head is
\(\frac{1}{2}\)
\(\frac{5}{12}\)
\(\frac{7}{12}\)
\(\frac{5}{7}\)
16.
Ram puts some buttons on the table. There were 4 blue, 7 red, 3 black and 6 white buttons in all. All of a sudden, a cat jumped on the table and knocked out one button on the floor. What is the probability that the button on the floor is blue?
\(\frac{7}{20}\)
\(\frac{3}{5}\)
\(\frac{1}{5}\)
\(\frac{1}{4}\)
17.
A coin is tossed 300 times and head appeared 180 times. The probability of getting a head in this experiment in
\(\frac{2}{5}\)
\(\frac{1}{5}\)
\(\frac{3}{5}\)
\(\frac{4}{5}\)
18.
The range of the data 18, 20, 22, 19, 17,35,44, 46, 38, 40 is
24
29
46
31
19.
The length of a rectangle in a histogram shows the
width of the class
lower limit of the class
upper limit of the class
frequency of the class
20.
In a throw of die, the probability of getting the number 8, is
\(\frac{1}{2}\)
\(\frac{5}{12}\)
1
0
1.
Probability = \(\frac { 2 }{ 6 } =\frac { 1 }{ 3 } \).
2.
Central angle for blue = 180°
Central angle for green = 90°
∴ Difference = 180° - 90° = 90°.
3.
Blue ⟶ 1800.
4.
Red ⟶ 45%
Yellow ⟶ 45%.
5.
144° - 108° = 36°
6.
Central angle for sector B
= \(\frac{40}{100}\times\) 360° = 144°.
7.
Central angle for sector A
= \(\frac{30}{100}\)\(\times\) 360° = 360°.
8.
Required number = 7 + 8 = 15.
9.
Required number = Frequency of class (4 - 6) = 4.
10.
Highest frequency = 7 ⟶ 430-465
11.
(d)
frequency
12.
(a)
frequency
13.
(a)
frequency
14.
(b)
21
15.
(b)
\(\frac{5}{12}\)
16.
(c)
\(\frac{1}{5}\)
17.
(c)
\(\frac{3}{5}\)
18.
(b)
29
19.
(d)
frequency of the class
20.
(d)
0

8th Standard CBSE Syllabus & Materials
8th Standard CBSE
CBSE 8th Science Particulate Nature of Matter - New Model Questions Papers Study Material - QB365 Set A
NEW8th Standard CBSE
CBSE 8th Science Pressure, Winds, Stroms and Cyclones - New Model Questions Papers Study Material - QB365 Set A
NEW8th Standard CBSE
CBSE 8th Mathematics Quadrilaterals - New Model Questions Papers Study Material - QB365 Set A
NEW8th Standard CBSE
CBSE 8th Mathematics A story of Numbers - New Model Questions Papers Study Material - QB365 Set A



NCERT Books

Syllabus

Exam Pattern

Sample Question Papers

Previous year Question Papers

Important Notes

MCQ Practice test

NCERT Exemplers

Case study Questions

Image Based Questions

Passage based Questions

HOT Questions

Value Based Questions

Model Questions Papers
NCERT ( Book Back ) Questions

Assertion and Reason
Important Questions And Answers

CBSE 8th Standard CBSE Subjects
CBSE Standards


