
 100% FREE ACCESS
8th Standard CBSE Syllabus & Materials
8th Standard CBSE
CBSE 8th Social Science Theme D - Factors of Production - New Model Questions Papers Study Material - QB365 Set A
NEW8th Standard CBSE
CBSE 8th Social Science Theme C - Universal Franchise and India's Electoral System - New Model Questions Papers Study Material - QB365 Set A
NEW8th Standard CBSE
CBSE 8th Social Science Theme B - The Rise of the Marathas - New Model Questions Papers Study Material - QB365 Set A
NEW8th Standard CBSE
CBSE 8th Social Science Theme B - Reshaping India's Political Map - New Model Questions Papers Study Material - QB365 Set A
NEW8th Standard CBSE
CBSE 8th Social Science Theme A - Natural Resources and Their Use - New Model Questions Papers Study Material - QB365 Set A
NEW8th Standard CBSE
CBSE 8th Science Keeping Time with Skies - New Model Questions Papers Study Material - QB365 Set A

Published on: 21/10/2025
Download CBSE Class 8th Standard CBSE Mathematics question papers, sample papers, important questions, and previous year solved papers in PDF format. Get free study materials, NCERT solutions, and exam preparation resources for Class 8th Standard CBSE Mathematics
Questions + Answers key
Take MCQ Mathematics Test
1.
When you spin the wheel shown, what are the possible outcomes in the following figure? List them.
.png)
2.
Observe the pie chart and answer the following question:
A die is thrown. What is the probability of getting an even prime number?
\(\frac{1}{6}\)
\(\frac{1}{4}\)
\(\frac{1}{3}\)
\(\frac{1}{2}\)
3.
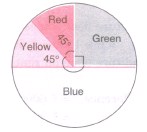
Observe the pie chart and answer the following question:
Which colour has the greatest central angle?
Red
Yellow
Green
Blue
4.
Observe the pie chart given below and answer the following question:
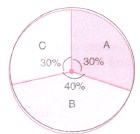
What is the difference between the central angles for sector B and sector C?
36°
72°
9°
81°
5.
Observe the pie chart given below and answer the following question:
The central angle for sector B is
108°
144°
72°
120°
6.
Observe the histogram and answer the question given below:
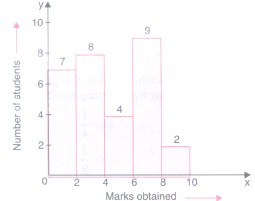
The total number of students is
10
20
25
30
7.
Observe the histogram and answer the question given below:
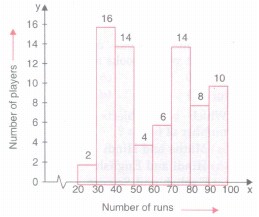
The total number of players making runs 20 and more is
74
64
84
54
8.
Study the following frequency distribution table and answer the question given below:
| Class interva Age (in years) | Number of persons |
| 15-20 | 12 |
| 20-25 | 20 |
| 25-30 | 42 |
| 30-35 | 20 |
| 35-40 | 6 |
The difference between the frequencies of the class intervals 20-25 and 30-35 is
0
10
20
5
9.
Study the following frequency distribution table and answer the question given below:
| Class interva Age (in years) | Number of persons |
| 15-20 | 12 |
| 20-25 | 20 |
| 25-30 | 42 |
| 30-35 | 20 |
| 35-40 | 6 |
What is the size of the class intervals?
5
10
15
20
10.
Observe the following bar graph carefully and answer the following question.
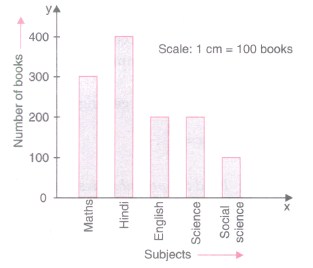
Of which subject are there the minimum books?
Social Science
Hindi
English
Science
11.
Observe the following bar graph carefully and answer the following question:
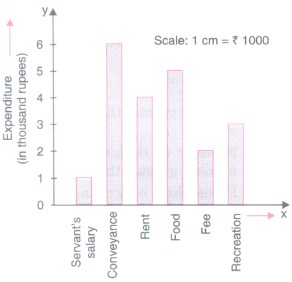
How much expenditure has been done in all?
Rs 21000
Rs 18000
Rs 15000
Rs 20000
12.
Observe the following bar graph carefully and answer the following question:
What is the difference of expenditures done on conveyance and rent ?
Rs 1000
Rs 2000
Rs 3000
Rs 4000
13.
Observe the following bar graph carefully and answer the following question:
On which item has the minimum expenditure been done?
Servant's salary
Food
Rent
Conveyance
14.
Observe the following bar graph carefully and answer the following question:
On which item has the maximum expenditure been done?
Conveyance
Rent
Fee
Servant's salary.
15.
A coin tossed once; what is the probability of getting a head?
1
2
1/2
0
16.
A coin is tossed. Which of the following is the probability of getting head or tail?
0
1
1/2
none of these
17.
Which of the following is the probability of an impossible event?
0
1
between 0 and 1
none of these
18.
The number of times a particular observation occurs in a given data is called
its frequency
its range
its mean
none of there
19.
In the interval 35 - 45, 45 is called
upper limit
lower limit
range
ferquency
20.
The difference between the highest and the lowest values of observations in a data is called:
mean of the data
range of the data
total frequency of data
sum of the observations
21.
Rahul, Varun and Yash are playing a game of spinning a coloured wheel. Rahul wins if spinner lands on red. Varun wins, if spinner lands on blue and Yash wins, if it lands on green. Which of the following spinner should be used to make the game fair?
.png)
.png)
.png)
.png)
22.
A graph showing two sets of data simultaneously is called a
double bar graph
pie chart
histogram
pictograph
23.
Which of the following is not a random experiment?
Tossing a coin
Rolling a die
Choosing a card from a deck of 52 cards
Throwing a stone from a roof of a building
24.
A geometric representation showing the relationship between a whole and its parts is a
pie chart
bar graph
histogram
pictograph
25.
The difference between the upper class limit and lower class limit is called ______.
26.
In a histogram, class intervals and frequencies are taken along _______ axis and ________ axis respectively.
27.
The total number of outcomes, when a die is 'thrown, is _____________.
28.
The class size of the interval 28 - 32 is ____________.
29.
_________ is used to compare parts to a whole.
30.
In the class intervals 10 - 20, 20 - 30, etc .... respectively, 20 lies in the class interval 10 - 20.
1.
In the given wheel, there are three sectors A, B and C. So, when we spin the wheel, the possible outcomes are A, B or C.
2.
Even prime number = 2
∴ Probability = \(\frac{1}{2}\).
3.
Blue ⟶ 1800.
4.
144° - 108° = 36°
5.
Central angle for sector B
= \(\frac{40}{100}\times\) 360° = 144°.
6.
Total number of students = 7 + 8 + 4 + 9 + 2 = 30.
7.
Required number = 2 + 16 + 14 + 4 + 6 + 14 + 8 + 10 = 74.
8.
Frequency of class 20-25 = 20.
Frequency of class 30-35 = 20
∴ Difference = 20-20 = 0.
9.
Size = 20 - 15 = 5.
10.
The height of the bar corresponding to Social Science is minimum.
11.
Total expenditure
= (1 + 6 + 4 + 5 + 2 + 3) x 1000
= Rs 21000.
12.
Expenditure done on conveyance
= 6 x 1000 = RS 6000
Expenditure done on rent = 4 x 1000
= Rs 4000
∴ Difference = Rs 6000 - Rs 4000
= Rs 2000.
13.
The height of the bar corresponding to servant's salary is minimum.
14.
The height of the bar corresponding to conveyance is the maximum.
15.
(c)
1/2
16.
(b)
1
17.
(a)
0
18.
(a)
its frequency
19.
(a)
upper limit
20.
(b)
range of the data
21.
(d)
22.
(a)
double bar graph
23.
(d)
Throwing a stone from a roof of a building
24.
(a)
pie chart
25.
()
width or size
26.
Class interval are taken along X-axis and frequencies are taken along Y-axis in a histogram.
27.
6 outcomes are 1, 2, 3, 4, 5 and 6.
28.
Upper limit - Lower limit = 32 - 28 = 4
29.
With a pie chart, we can compare parts to a whole.
30.
(b)

8th Standard CBSE Syllabus & Materials
8th Standard CBSE
CBSE 8th Science Particulate Nature of Matter - New Model Questions Papers Study Material - QB365 Set A
NEW8th Standard CBSE
CBSE 8th Science Pressure, Winds, Stroms and Cyclones - New Model Questions Papers Study Material - QB365 Set A
NEW8th Standard CBSE
CBSE 8th Mathematics Quadrilaterals - New Model Questions Papers Study Material - QB365 Set A
NEW8th Standard CBSE
CBSE 8th Mathematics A story of Numbers - New Model Questions Papers Study Material - QB365 Set A



NCERT Books

Syllabus

Exam Pattern

Sample Question Papers

Previous year Question Papers

Important Notes

MCQ Practice test

NCERT Exemplers

Case study Questions

Image Based Questions

Passage based Questions

HOT Questions

Value Based Questions

Model Questions Papers
NCERT ( Book Back ) Questions

Assertion and Reason
Important Questions And Answers

CBSE 8th Standard CBSE Subjects
CBSE Standards


