
 100% FREE ACCESS
8th Standard CBSE Syllabus & Materials
8th Standard CBSE
CBSE 8th Social Science Theme D - Factors of Production - New Model Questions Papers Study Material - QB365 Set A
NEW8th Standard CBSE
CBSE 8th Social Science Theme C - Universal Franchise and India's Electoral System - New Model Questions Papers Study Material - QB365 Set A
NEW8th Standard CBSE
CBSE 8th Social Science Theme B - The Rise of the Marathas - New Model Questions Papers Study Material - QB365 Set A
NEW8th Standard CBSE
CBSE 8th Social Science Theme B - Reshaping India's Political Map - New Model Questions Papers Study Material - QB365 Set A
NEW8th Standard CBSE
CBSE 8th Social Science Theme A - Natural Resources and Their Use - New Model Questions Papers Study Material - QB365 Set A
NEW8th Standard CBSE
CBSE 8th Science Keeping Time with Skies - New Model Questions Papers Study Material - QB365 Set A

Published on: 21/10/2025
Download CBSE Class 8th Standard CBSE Mathematics question papers, sample papers, important questions, and previous year solved papers in PDF format. Get free study materials, NCERT solutions, and exam preparation resources for Class 8th Standard CBSE Mathematics
Questions + Answers key
Take MCQ Mathematics Test
1.
Is Example 7 (Textbook), a case of direct variation?
2.
A bank gives 10% simple interest (S.I.) on deposits by senior citizens. Draw a graph to show the relation between the sum deposited and simple interest earned. Find from your graph.
(i) The annual interest for an investment of Rs.250.
3.
Write the y-coordinate (ordinate) of the given points.
(2, 7)
4.
Write the y-coordinate (ordinate) of the given points.
(4, 0)
5.
Write the x-coordinate (abscissa) of each of the given points.
(0, 5)
6.
Write the x-coordinate (abscissa) of each of the given points.
(5, 7)
7.
The graph shows the maximum temperatures recorded for two consecutive weeks of a town. Study the graph and answer the question that follow.
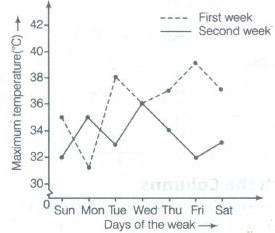
On which day was the difference in temperatures the maximum for both the weeks?
8.
The graph shows the maximum temperatures recorded for two consecutive weeks of a town. Study the graph and answer the question that follow .
On which day was the temperature same in both the weeks?
9.
The graph shows the maximum temperatures recorded for two consecutive weeks of a town. Study the graph and answer the question that follow .
In which week was the temperature higher on most of the days?
10.
The graph shows the maximum temperatures recorded for two consecutive weeks of a town. Study the graph and answer the question that follow.
What information is given by the two axes?
11.
Explain the situations represented by the following distance-time graph
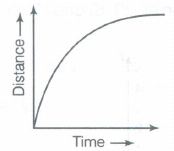
12.
Explain the situations represented by the following distance-time graph
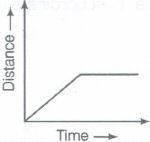
13.
Explain the situations represented by the following distance-time graph
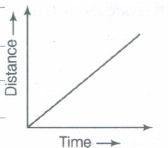
14.
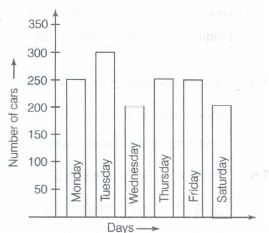
The following table shows the daily production of cars in a factory for 6 days of the week. Draw a bar graph.
| Days | Mon | Tue | Wed | Thurs | Fri | Sat |
|---|---|---|---|---|---|---|
| Number of cars |
250 | 300 | 200 | 250 | 250 | 200 |
15.
A courier-person cycles from a town to a neighbouring Suburban area to deliver a parcel to a merchant. His distance from the town at different times is shown by the following graph:
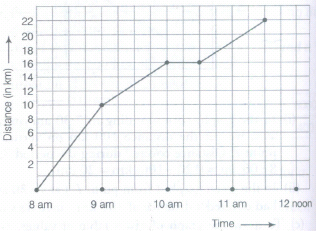
During which period did he ride fatest?
16.
A courier-person cycles from a town to a neighbouring Suburban area to deliver a parcel to a merchant. His distance from the town at different times is shown by the following graph:
Did the person stop on his way? Explain
17.
A courier-person cycles from a town to a neighbouring Suburban area to deliver a parcel to a merchant. His distance from the town at different times is shown by the following graph:
How far is the place of the merchant from the town?
18.
A courier-person cycles from a town to a neighbouring Suburban area to deliver a parcel to a merchant. His distance from the town at different times is shown by the following graph:
How much time did the person take for the travel?
19.
A courier-person cycles from a town to a neighbouring Suburban area to deliver a parcel to a merchant. His distance from the town at different times is shown by the following graph:
What is the scale taken for the time axis?
20.
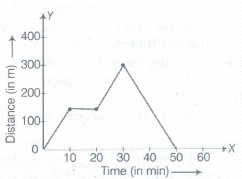
In the given figure shows that, the movement of an object across a playground. Read it and answer the following question
After what time was the object 150 m from the starting point.
21.
In the given figure shows that, the movement of an object across a playground. Read it and answer the following question
At what distance did the object begin to return to the starting point?
22.
In the given figure shows that, the movement of an object across a playground. Read it and answer the following question
How long the object was stationary?
23.
Draw a 'deposit-interest' graph for the following data:
| Deposit(in Rs.) | 5000 | 6000 | 7000 | 8000 | 9000 |
|---|---|---|---|---|---|
| Simple interest (in Rs.)for 1 yr |
300 | 420 | 540 | 660 | 780 |
From the graph, find the interest on Rs. 6500 for 1 yr.
24.
The following table gives the body temperature in oF corresponding to oC. Draw the graph using the table and answer the questions that follow:
| Temperature(oC) | 0 | 15 | 30 |
|---|---|---|---|
| Temperature (oF) | 32 | 59 | 86 |
(a) What will be the temperature in oF, when it is 10oC?
(b) What will be the temperature in oC, when it is 68oF?
25.
The table given below shows the temperatures recorded on a day at different times:
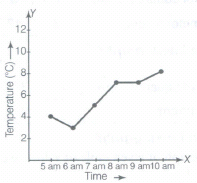
Observe the table and answer the following questions.
(a) What is the temperature at 8 am?
(b) At what time is the temperature 3oC?
(c) During which hour did the temperature fall?
26.
The following table gives the growth chart of a child.
| Height(in cm) | 75 | 90 | 110 | 120 | 130 |
|---|---|---|---|---|---|
| Age (in yr) | 2 | 4 | 6 | 8 | 10 |
Draw a line graph for the table and answer the questions that follow:
(a) What is the height of child at the age of 4 yr?
(b) How much taller was the child at the age of 10 yr than the child of age of 6 yr?
(c) Between which two consecutive periods did the child grow more faster?
27.
Plot the given points on a graph sheet and check, if the points lie on a straight line if not, name the shape they form, when joined in the given order (1, 1), (1, 2), (2, 2) and (2, 1).
28.
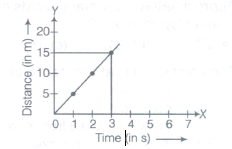
The following graph shows the relation between distance and time (distance-time graph). Find the distance covered in 3 s.
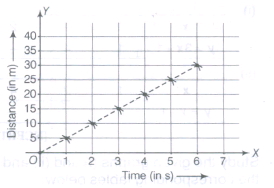
29.
Plot the given points on a graph sheet and check, if the points, lie on a straight line. If not, name the shape they form when joined in the given order (1,2), (2,4), (3, 6), (4, 8).
30.
Write the y-coordinate (ordinate) of the given points.
(3, 5)
31.
Write the x-coordinate (abscissa) of the given points.
(7, 3)
32.
From the given graph, choose the letters that indicate the location of the points given below:
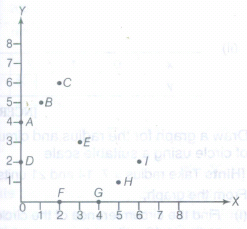
(a) (2, 0)
(b) (0, 4)
(c) (5,1)
(d) (2, 6)
(e) (3, 3)
33.
Draw the line graph from the following data.
| x | 2 | 4 | 6 | 8 |
|---|---|---|---|---|
| y | 1 | 5 | 9 | 13 |
(a) Find the value of x, when y = 7.
(b) Find the value of y, when x = 3.
34.
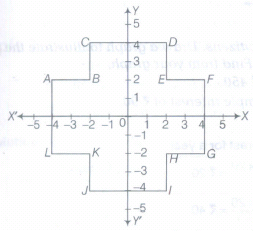
Write the coordinate of the vertices of the following figure
35.
Plot the given points on a graph sheet and check, if the points lie on a straight line. If not, name the shape they form when joined in the given order (3,0), (0,4), (-3,0) and (0, -4).
36.
Draw the line graph from the following table (monthly output of a tin mine) :
| Months | June | July | Aug | Sep | Oct | Nov | Dec |
| Output of tin mine (in tonne) |
2 | 10 | 6 | 9 | 5 | 5 | 8 |
Answer the following questions:
(a) Whatis largest monthly output of the tin mine?
(b) For which months does the output remains constant?
37.
Draw a graph for the following:
| Distance(in meters) | 5 | 10 | 15 | 20 | 25 | 30 |
| Time(in seconds) | 1 | 2 | 3 | 4 | 5 | 6 |
Is it a linear graph?
38.
Write the coordinates of the vertices of each of these adjoining figures.
39.
Draw the line passing through (2, 3) and (3, 2). Find the coordinates of the points at which this line meets the X-axis and Y-axis.
40.
Plot the following points on a graph sheet. Verify, if they lie on a line.
K (2, 3), L (5, 3),M (5, 5), N (2, 5)
41.
Plot the following points on a graph sheet. Verify, if they lie on a line.
A (4, 0), B (4, 2), C (4, 6), D (4, 2.5)
1.
Yes ! it is a case of direction variation as
\(\frac { 100 }{ 10 } =\frac { 200 }{ 20 } =\frac { 300 }{ 30 } =\frac { 500 }{ 50 } =\frac { 1000 }{ 100 } \)
=10(constant)
2.
(i) Rs.25
(ii) Rs.700
3.
Given, (2, 7)
In this point, y-coordinate (ordinate) is 7 i.e. y = 7.
4.
Given, (4, 0)
In this point, y-coordinate (ordinate) is 0 i.e.
y=0.
5.
Given (0, 5)
In this point, x-coordinate (abscissa) is 0, i.e.
(x = 0).
6.
Given, (5, 7)
In this point, x-coordinate (abscissa) is 5, i.e.
(x = 5).
7.
Friday
8.
Wednesday
9.
First Week
10.
Maximum temperature in oC for the two consecutive weeks.
11.
Moves with non-uniform speed, then slowly comes to rest.
12.
Moves with uniform speed, then comes to rest.
13.
Uniform speed
14.
15.
Between 8 am to 9 am
16.
Yes, he stops between 10 am to 10: 30 am.
17.
22 km
18.
3 h 30 min
19.
4 small division = 1 h (i.e 4 units = 1 h)
20.
In between 10 m to 20 m
21.
300 m
22.
10 min
23.
Rs 480 (interest on Rs 6500)
24.
(a) 50oF (b)20oF
25.
(a) 7oC (b) 6 am (e) 5 to 6 am
26.
.png)
(a) 90 cm (b) 20 cm (e) Between 4 yr to 6 yr
27.
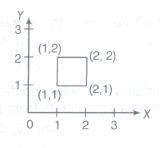
All points are not lie on the straight line. Hence, if we join the given points in the given order, we found a square-shaped figure.
28.
Distance covered in 3 s is 15 m.
i.e.
29.
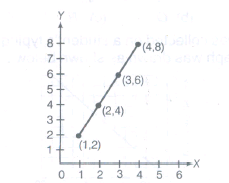
All given points lie on a straight line.
30.
Given, (3, 5)
In this point, y-coordinate (ordinate) is 5 i.e. y = 5.
31.
Given, (7, 3)
In this point, x-coordinate (abscissa) is 7 i.e.
x =7.
32.
(a) In the given graph, point F is (2, 0),
i.e. x = 2, Y = O.
(b) In the given graph, point A is (0, 4),
i.e. x = 0, y = 4.
(c) In the given graph, point H is (5, 1),
i.e. x=5,y=1.
(d) In the given graph, point C is (2, 6),
i.e. x = 2, y = 6.
(e) In the given graph, point E is (3, 3),
i.e. x = 3, Y = 3.
33.
(a) x = 5 (b) y = 3
34.
| Name of vertices |
A | B | C | D | E | F | G | H |
|---|---|---|---|---|---|---|---|---|
| Coordinate | (-4,2) | (-2,2) | (-2,4) | (2,4) | (2,2) | (4,2) | (4,-2) | (2, -2) |
| I | J | K | L |
|---|---|---|---|
| (2,-4) | (-2,-4) | (-2,-2) | (-4,-2) |
35.
.png)
Shape formed by these points is a rhombus.
36.
.png)
(a) 10 tonnes in July
(b) For October and November output remains constant.
37.
Scale:
On horizontal axis:1 unit = 1 cm
On vertical axis:1 unit = 4 cm
1. Mark side of the square (in cm) on horizontal axis.
2. Mark perimeter (in cm) on vertical axis.
3. Plot the points (2, 8), (3, 12), (3.5, 14) (5, 20) and (6, 24).
4. Join the points.
Yes; it is a linear graph.
38.
(i) In the rectangle OABC, the coordinates of O is (0, 0), A is (2, 0), B is (2, 3) and C is (0, 3)
(ii) In the parallelogram PQRS, the coordinates of Pis (4, 3), Qis (6, 1), R is (6, 5) and S is (4, 7)
.png)
(iii) In the ΔKLM, the coordinates of K is (10, 5), Lis (7, 7) and Mis (10, 8).
39.
.png)
Firstly, we plot the points A (2,3) and B (3,2) on the graph paper and joining them, then we get the following graph:
On extending this line in both directions, it intersect X-axis and Y-axis at points C and D, respectively. Now, coordinates of point Care (5, 0) (since, it is at a distance 5 units from 0 on X-axis) and Dare (0, 5) (since, it is at a distance 5 units from 0 on Y-axis).
Hence, the line will meet on X-axis at (5,0) and Y-axis at (0,5).
40.
To plot the given points in each case, firstly we draw the X and Y-axes and then plot the given points.
Given points K, L,M and N do not lie on a line.
41.
To plot the given points in each case, firstly we draw the X and Y-axes and then plot the given points.
On plotting the points A(4,0), B (4, 2), C (4, 6) and D (4, 2.5) on the graph paper and joining them. Then, we get the following graph
s.png)
Yes, it is clear from the above graph that given points A, B, C and D lie on a line.

8th Standard CBSE Syllabus & Materials
8th Standard CBSE
CBSE 8th Science Particulate Nature of Matter - New Model Questions Papers Study Material - QB365 Set A
NEW8th Standard CBSE
CBSE 8th Science Pressure, Winds, Stroms and Cyclones - New Model Questions Papers Study Material - QB365 Set A
NEW8th Standard CBSE
CBSE 8th Mathematics Quadrilaterals - New Model Questions Papers Study Material - QB365 Set A
NEW8th Standard CBSE
CBSE 8th Mathematics A story of Numbers - New Model Questions Papers Study Material - QB365 Set A



NCERT Books

Syllabus

Exam Pattern

Sample Question Papers

Previous year Question Papers

Important Notes

MCQ Practice test

NCERT Exemplers

Case study Questions

Image Based Questions

Passage based Questions

HOT Questions

Value Based Questions

Model Questions Papers
NCERT ( Book Back ) Questions

Assertion and Reason
Important Questions And Answers

CBSE 8th Standard CBSE Subjects
CBSE Standards


