
 100% FREE ACCESS
8th Standard CBSE Syllabus & Materials
8th Standard CBSE
CBSE 8th Social Science Theme D - Factors of Production - New Model Questions Papers Study Material - QB365 Set A
NEW8th Standard CBSE
CBSE 8th Social Science Theme C - Universal Franchise and India's Electoral System - New Model Questions Papers Study Material - QB365 Set A
NEW8th Standard CBSE
CBSE 8th Social Science Theme B - The Rise of the Marathas - New Model Questions Papers Study Material - QB365 Set A
NEW8th Standard CBSE
CBSE 8th Social Science Theme B - Reshaping India's Political Map - New Model Questions Papers Study Material - QB365 Set A
NEW8th Standard CBSE
CBSE 8th Social Science Theme A - Natural Resources and Their Use - New Model Questions Papers Study Material - QB365 Set A
NEW8th Standard CBSE
CBSE 8th Science Keeping Time with Skies - New Model Questions Papers Study Material - QB365 Set A

Published on: 03/10/2019
Data Handling
Download CBSE Class 8th Standard CBSE Mathematics question papers, sample papers, important questions, and previous year solved papers in PDF format. Get free study materials, NCERT solutions, and exam preparation resources for Class 8th Standard CBSE Mathematics
Questions + Answers key
Take MCQ Mathematics Test
1.
Complete the following crossword puzzle using the given directions for ACROSS [from left to right] and DOWN [from top to bottom].
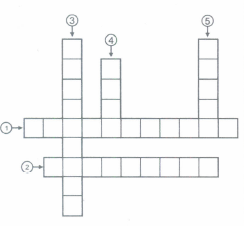
Across:
(1) _________ is the measure of the chance of the happening of an event.
(2) ______ is the number of times a particular entry occurs.
Down:
(3) _____ is a special type of bargraph in which the rectangles are having no gap between them.
(4) The numerical information is called _______
(5) The probability of a sure is ______ 1.
2.
Look at the following circle graph and answer the questions given below:
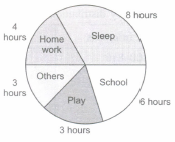
(i) Find the fraction of the circle representing each of these given information.
(ii) What is the central angle corresponding to the activities "Play" and "Home work"?
3.
Study the following graph carefully to answer the question that follows.
Number of soldiers recruited (in thousand) in three different forces in six different years.
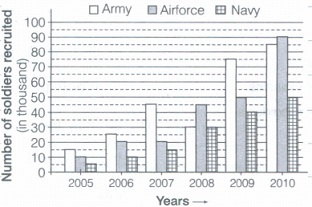
(a) Number of soldiers recruited in Navy in the year 2009 was what percentage of number of soldiers required in Army in the year 2006?
(b) If 30% of soldiers recruited in Airforce in the year 2010 was female, then what is the number of males recruited in Airforce in that year?
4.
Study the following bar diagram and answer the question that follows.
Number of students passed (in thousand) from two universities over the years
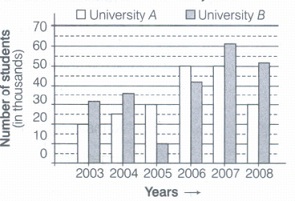
(a) What is the difference between the total number of students passed from both the universities in the year 2007 together and the total number of students passed in year 2005 from both the universities together?
(b) What is the sum of students passed from university B in the years 2003 - 2005 and 2006 together?
5.
Read the following chart carefully and answer the questions that follow.
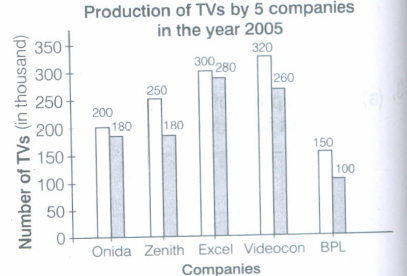
(a) ln year 2005, which company had the maximum percentage unutilised capacity.
(b) The TVs produced by Excel form, what percentage of the total production?
6.
The following pie chart represents a total expenditure of Rs 540000 on different items in constructing a flat in a town. Study the pie chart and answer the questions.
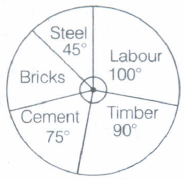
(a) Find the expenditure (in Rs) on bricks.
(b) How much expenditure on bricks is less than the expenditure on timber (in Rs)?
7.
(a)From a pack of cards, the following cards are kept face down.
.png)
Suhail wins if he picks up a face card. Find the probability of Suhail winning?
b)Now, the following cards are added to the above cards:
.png)
Whatis the probability of Suhail winning now?
Reshmawins, if she picks up a 4. What is the probability of Reshma winning? [queen, king and jack cards are called face cards.]
8.
The following data represents the approximate percentage of water in various oceans.
Prepare a pie chart for the given data.
| Pacific | 40% |
| Atlantic | 30% |
| Indian | 20% |
| Others | 10% |
9.
The shoppers who come to a departmental store are marked as Man (M), Woman (W), Boy (B) or Girl (G). The following list gives the shoppers who came during the first hour in the morning:
W W W G B W W M G G M M W W W W G B M W B G G M W W M M W W W M W B W G M W W W W G W M M W W M W G W M G W M M B G G W
Make a frequency distribution table using tally marks. Draw a bar graph to illustrate it.
10.
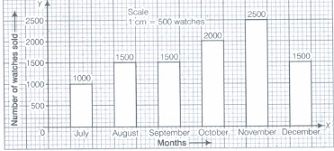
Draw an appropriate graph to represent the given information.
| Months | July | August | September | October | November | December |
|---|---|---|---|---|---|---|
| Number of watches sold |
1000 | 1500 | 1500 | 2000 | 2500 | 1500 |
1.
(1) PROBABILITY
(2) FREQUENCY
(3) HISTOGRAM
(4) DATA
(5) EVENT
2.
(i) The proportion of the sector for hours:
in sleeping = \(Number\ of\ sleeping\ hours\over Whole\ day\)
\(={8\ hours\over 24\ hours}={1\over3}\)
in school =\({6\ hours\over 24\ hours}={1\over4}\)
in home work = \({4\ hours\over 24\ hours}={1\over 6}\)
in play = \({3\ hours\over 24\ hours}={1\over 8}\)
in others = \({3\ hours\over 24\ hours}={1\over 8}\)
(ii) ∵ Total angle at the centre of a circle
= 360°
i.e., Central angle for 1 (whole) = 360°
∴ Central angle for play
(\(1\over8\)th part of Whole) = \(1\over8\) x 360° = 45°
Similarly, central angle for home work
(\(1\over6\) th part of Whole) = \(1\over6\) x 360° = 60°
3.
(a) 16%
(b) 63000
4.
(a) 70000
(b) 80000
5.
(a) Percentage of unutilised capacity = \(\frac{Production\quad capacity-production}{production\quad capacity}\times 100\)
Onida = \(\frac{20}{200}\times\) 100 = 10%
Zenith = \(\frac{70}{250}\times\) 100 = 28%
Excel = \(\frac{20}{300}\times\) 100 = 6.67%
Videocon = \(\frac{60}{320}\times\)100 = 18.75%
BPL = \(\frac{50}{150}\times\) 100 = 33.3%
Hence, BPL had maximum unutilised capacity.
(b) Total production = 180+ 180 + 280 + 260 + 100 = 1000
:. Required percentage = \(\frac{280}{1000}\times\) 100 = 18%
6.
(a) Angle made by the expenditure on bricks
= 360o - (45o + 100o + 90o + 75o)
= 360o - 310o = 50o
Thus, expenditure on bricks
= \(\frac{50}{360}\times \) 540000 = Rs 75000
(b) Expenditure on bricks = Rs 75000
Expenditure on timber = \(\frac{90}{360}\times 540000\)
= \(\frac{540000}{4}\) = Rs 135000
\(\therefore\) Difference between expenditure on bricks and expenditure on timber = 135000 - 75000 = Rs 60000
Hence, expenditure on bricks is Rs 60000 less than expenditure on timber.
7.
(a) P (Suhail winning) = \(\frac{1}{7}\)
(b) P (Suhail winning now) = \(\frac{4}{15}\)
[\(\therefore\) there are 4 face cards]
P (Reshma winning) = \(\frac{4}{15}\)
[\(\therefore\) there are four 4 numbers card]
8.
Central angle for oceans = \((\frac{Value\quad of\quad the\quad component}{Sum\quad of\quad the\quad components}\times 360)^o\)
For pacific ocean = 40% = \(\frac{40}{100}\times 360^o\) = 144o
For atlantic ocean = 30% = \(\frac{30}{100}\times 360^o\) = 108o
For Indian ocean = 20% = \(\frac{20}{100}\times 360^o\) = 72o
For others ocean = 10% = \(\frac{10}{100}\times 360^o\) = 36o
On the basis of above data we can draw the following pie chart:
.png)
9.
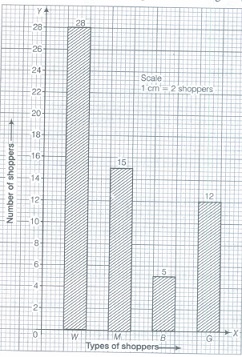
Here, the types of shoppers are Wom.an (W), Man (M), Boy (B) or Girl (G). Then, frequency distribution table for the above data is given below:
| Types of shoppers | Tally marks | Frequency (Number of shoppers) |
| W | .jpg) |
28 |
| M | .jpg) |
15 |
| B | .jpg) |
5 |
| G | .jpg) |
12 |
| Total | 60 |
Now, draw two perpendicular axes OX and OY and take types of shoppers along OX and frequency i.e. number of shoppers along OY. Choose a suitable scale for OX and OY and draw bars of equal gaps in between. Thus, we get the following bar graph:
10.
Here, to represent the given information, we draw the bar graph. So, draw two perpendicular axes OX and OY. Take months on OX and number of watches sold on OY. Choose a suitable scale for OX and OY and drawbars of equal width with equal gaps in between.
Thus, we get the following bar graph

8th Standard CBSE Syllabus & Materials
8th Standard CBSE
CBSE 8th Science Particulate Nature of Matter - New Model Questions Papers Study Material - QB365 Set A
NEW8th Standard CBSE
CBSE 8th Science Pressure, Winds, Stroms and Cyclones - New Model Questions Papers Study Material - QB365 Set A
NEW8th Standard CBSE
CBSE 8th Mathematics Quadrilaterals - New Model Questions Papers Study Material - QB365 Set A
NEW8th Standard CBSE
CBSE 8th Mathematics A story of Numbers - New Model Questions Papers Study Material - QB365 Set A



CBSE 8th Standard CBSE Subjects
CBSE Standards




