
 100% FREE ACCESS
8th Standard CBSE Syllabus & Materials
8th Standard CBSE
CBSE 8th Social Science Theme D - Factors of Production - New Model Questions Papers Study Material - QB365 Set A
NEW8th Standard CBSE
CBSE 8th Social Science Theme C - Universal Franchise and India's Electoral System - New Model Questions Papers Study Material - QB365 Set A
NEW8th Standard CBSE
CBSE 8th Social Science Theme B - The Rise of the Marathas - New Model Questions Papers Study Material - QB365 Set A
NEW8th Standard CBSE
CBSE 8th Social Science Theme B - Reshaping India's Political Map - New Model Questions Papers Study Material - QB365 Set A
NEW8th Standard CBSE
CBSE 8th Social Science Theme A - Natural Resources and Their Use - New Model Questions Papers Study Material - QB365 Set A
NEW8th Standard CBSE
CBSE 8th Science Keeping Time with Skies - New Model Questions Papers Study Material - QB365 Set A

Published on: 24/09/2019
Data Handling
Download CBSE Class 8th Standard CBSE Mathematics question papers, sample papers, important questions, and previous year solved papers in PDF format. Get free study materials, NCERT solutions, and exam preparation resources for Class 8th Standard CBSE Mathematics
Questions + Answers key
Take MCQ Mathematics Test
1.
When a die is thrown, list the outcomes of an event of getting:
(i) A number less than 5
(ii) A composite number
(iii) A prime number
(iv) A number more than 3
2.
Numbers I to 10 are written on ten separate cards such that one number on one slip. These are mixed well and one slip is chosen from the box without looking into it. What is the probability of
(i) getting a card on which 7 is written?
(ii) getting a card having two-digit number on it?
(iii) getting a number less than 5?
(iv) getting a number more than 5?
3.
Observe the following histogram and answer the questions given below:
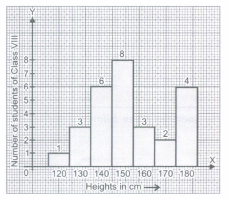
(i) What information is being given by the histogram?
(ii) Which group contains the maximum students?
(iii) How many students have a height of 160 em and more?
(iv) What is the ratio of the number of students in 130-140 em group and the number of students in 160-170 em groups?
4.
Study the following frequency table and answer the questions given below.
(i) What is the class interval?
(ii) Which class has the lowest frequency?
(iii) Which class has the highest frequency?
(iv) Which two classes have the same frequency?
| Class interval (Dailv income in rupees) | Frequency (Number of workers) |
|---|---|
| 200-225 | 25 |
| 225-250 | 38 |
| 250-275 | 42 |
| 275-300 | 45 |
| 300-325 | 17 |
| 325-350 | 23 |
| 350-375 | 45 |
| 375-400 | 120 |
| Total | 365 |
(v) What is the lower limit of the class interval 300-325?
(vi) What is the upper limit of the class interval 275-300?
5.
Show that the annual agricultural field of a certain place.
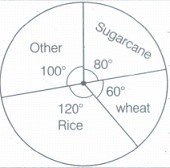
Find the ratio of field of rice and wheat with sugarcane and others.
6.
The following pie chart gives the marks scored in an examination by a student in Hindi, English, Mathematics, Social Science and Science. If the total marks obtained by the students were 540, answer the following questions:
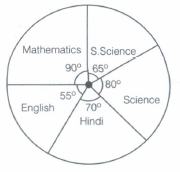
(i) In which subject did the student score 105 marks?
(ii] How many more marks were obtained by the student in Mathematics than in Hindi?
(iii) Examine whether the sum of the marks obtained in Social Science and Mathematics is more than that in Science and Hindi.
7.
In throwing a die:
Suppose the second player got a six. Does it mean that the third player would not have a chance of getting a six?
8.
In throwing a die:
Would the player who played after him have a lesser chance of getting a six?
9.
The below histogram shows the number of literate females in the age group of 10 to 40 years in a town:
.png)
What is the classes width?
10.
Draw a pie chart of the data given below:
The time spent by a child during a day.
| Sleep | 8h |
| School | 6h |
| Home work | 4h |
| Play | 4h |
| Others | 2h |
11.
Answer the following questions based on the pie chart in following figure.
(i) Which type of programmes are viewed the most?
(ii) Which two types of programmes have number of viewers equal to those watching sports channels?
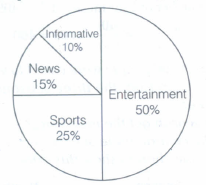
Viewers watching different types of channels on TV.
12.
For which of these would you use a histogram to show the data?
(a) The number of letters for different areas in a postman's bag.
(b) The height of competitors in an athletics meet.
(c) The number of cassettes produced by 5 companies.
(d) The number of passengers boarding trains from 7: 00 am to 7: 00 pm at a station.
Give reasons for each.
13.
Construct a frequency distribution table for the data on weights (in kg) of 20 students of a class using intervals 30-35, 35-40 and so on. 40,38,33,48,60,53,31,46,34,36,49,41, 55, 49, 65, 42, 44, 47, 38, 39.
14.
If we change the position of any of the bars of a bar graph, would it change the information being conveyed? Why?
15.
Read the following bar graph and answer the following questions.
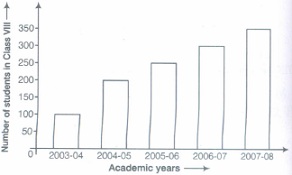
(i) What is the information given by the bar graph?
(ii) In which year is the increase in the number of students maximum?
(iii) In which year is the number of students maximum?
(iv) State whether true of false:
'The number of students during 2005 - 06 is twice that of 2003 - 04.'
1.
The number on a die are 1, 2, 3,4, 5, or 6.
(i) ∵ Numbers less than 5 are 1, 2, 3 and 4.
∴ Possible outcomes = 4
⇒ Probability of getting a number less than \(5={4\over6}\ or\ {2\over3}\)
(ii) ∵ The composite numbers are 4 and 6.
∴ Number of outcomes = 2
⇒ Probability getting a composite number \(={2\over6}\ or\ {1\over3}\)
(iii) ∵ The prime numbers are 2, 3 and 5.
∴ Number of outcomes = 3
⇒ Probability of getting a prime number \(={3\over6}={1\over2}\)
(iv) ∵ Numbers more than 3 are 4, 5, and 6.
∴ Number of outcomes = 3
⇒ Probability of getting a number greater than \(3={3\over6}\ or\ {1\over2}\)
2.
Total number of outcomes = 10
(i) ∴ One card is having 7 on it
∴ Number of favourable outcome =
⇒ Probability of getting a card having 7 on it = \(1\over10\)
(ii) ∵ Only one card IS having two digit number (i.e., 10)
∴ Number of favourable outcome =
⇒ Probability of getting a card having 10
(two diizgiit number) on it = 1/10
(iii) ∴ The numbers less than 5 are I, 2, 3,
and 4
∴ Number of favourable outcomes = 4
⇒ Probability of getting a number less then \(5={4\over10}\ or\ {2\over5}\)
(iv) The numbers more than 5 are 6, 7, 8, 9 and 10.
∴ Number of favourable outcomes = 5
⇒ Probability of getting a number more than \(5={5\over10}\ or\ {1\over5}\)
3.
(i) This histogram represents heights (in cms) of students of Class VIII.
(ii) The group (150-160) contains maximum number of students (which has 8 students).
(iii) 9 students (3 + 2 + 4) have height of 160 cm or more.
(iv) Number of students in the group of 130 - 140 cm = 3.
Number of students in the group of 160 - 170 cm = 3
∴ The required ratio = 3 : 3 = 1 : 1
4.
(i) The class interval = [Upper limit of a class] - [Lower limit of the same class] = 225 - 200 = 25
(ii) The class 300 - 325 is having the lowest frequency (which is 17).
(iii) The class 375 - 400 is having the highest frequency (which is 120).
(iv) The class intervals 275-300 and 350 - 375 have the same frequency (which is 45).
(v) The lower limit of the class interval 300 - 325 is 300.
(vi) The upper limit of the class interval 275 - 300 is 300.
5.
1: 1
6.
Here, the total marks obtained by the student are 540. For 540 marks, the complete central angle is 360°.
(i) Since, for 540 marks, central angle = 360°
So, for 1 mark, central angle = \(\frac{360^o}{540}\)
Then, for 105 marks, central angle = \(\frac{360^o}{540}\times 105=(\frac{36\times 105}{54})^o=70^o\)
Hence, the student scored 105 marks in Hindi.
(ii) Marks obtained by the student in Mathematics = Fraction part X Total marks = \(\frac{90^o}{360^o}\times\) 540 = 135
Marks obtained in Hindi = 105
Difference between marks in Mathematics and Hindi = (135 -105) = 30
Hence, the student obtained 30 marks more in
Mathematics than in Hindi.
(iii) Marks obtained by the student in Mathematics = 135
Marks obtained by the student in Social Science = Fraction part for Social Science X Total marks
= \(\frac{65^o}{360^o}\times 540=\frac{65\times 54}{36}=\frac{65\times 6}{4}\) = 97.5
\(\therefore\) Sum of the marks obtained in Social Science and
Mathematics = 97.5 + 135 = 232.5
Now, marks obtained by the student in Science = Fraction parr of Science X Total marks
= \(\frac{80^o}{360^o}\times 540 = \frac{80\times 6}{4}\) = 120
and marks obtained by the student in Hindi = Fraction part for Hindi X Total marks
= \(\frac{70^o}{360^o}\times 540=\frac{70\times 6}{4}\) = 105
\(\therefore\) Sum of the marks obtained in Hindi and Science = 105 + 120 = 225
Hence, sum of the marks obtained in Social Science and Mathematics is more than that in Science and Hindi.
7.
No, since each event have equal chance of occurring.
8.
No. since outcomes of the experiment are equally likely. So each have an equal chance of occurring.
9.
5 [ \(\therefore\) 15 - 10 = 5]
10.
We know that total angle at the centre of a circle is 360°.
Fraction part for sleep = \(\frac{Hours\ for\ sleep}{Total\ hours}=\frac{8}{24}=\frac{1}{3}\)
\(\therefore\) Central angle of sector for sleep = \(\frac{1}{3}\times 360^o =120^o\)
Similarly, for other central angles, we get the following table:
First, we find the central angle corresponding to given activities
| Activities | Hours | Fraction parts | Central angles |
| Sleep | 8 | \(\frac{8}{24}=\frac{1}{3}\) | \(\frac{1}{3}\times 360^o=120^o\) |
| School | 6 | \(\frac{6}{24}=\frac{1}{4}\) | \(\frac{1}{4}\times 360^o=90^o\) |
| Homework | 4 | \(\frac{4}{24}=\frac{1}{6}\) | \(\frac{1}{6}\times 360^o=60^o\) |
| Play | 4 | \(\frac{4}{24}=\frac{1}{6}\) | \(\frac{1}{6}\times 360^o=60^o\) |
| Others | 2 | \(\frac{2}{24}=\frac{1}{12}\) | \(\frac{1}{12}\times 360^o=30^o\) |
Now, draw a circle and divide it into sectors with corresponding central angle, we get the required pie chart given below:
.png)
11.
(i) From the given pie chart, we have the following table:
| Type of viewers | Percentage |
| Sports viewers | 25 |
| News viewers | 15 |
| Informative viewers | 10 |
| Entertainment viewers | 50 |
Since, percentage of entertainment is highest, so entertainment programme are viewed the most.
(ii) Here, number of viewers watching news = 15%
Number of viewers watching informative = 10%
\(\therefore\) Sum of numbers of viewers watching news and informative
= (15 + 10)% = 25%
= Number of viewers watching sports
Hence, news and informative programmes have number of viewers equal to those watching sports channel.
12.
We know that, if given data can be grouped into class interval, then we represent the data by histogram. Here, different areas and five companies cannot be grouped into class interval, whereas height and time can be grouped into class interval, so (b) and (d) can be represented by a histogram.
13.
Here, lowest observation =31
and highest observation = 65
So, we have to take class intervals 30-35, 35-40, 40-45, ... in first column and corresponding frequency i.e. number of students whose weight lie in this class interval, in the second column. Then, frequency distribution table for the above data is given below:
| Class Interval [Weights (in kg)] |
Tally marks | Frequency (Number of students) |
| 30-35 | III | 3 |
| 35-40 | IIII | 4 |
| 40-45 | IIII | 4 |
| 45-50 | .jpg) |
5 |
| 50-55 | I | 1 |
| 55-60 | I | 1 |
| 60-65 | I | 1 |
| 65-70 | I | 1 |
| Total | 20 |
14.
No, because bar heights give the quantity for each category. Since the height remains unchanged. So, the information conveyed regarding the quantity remain unchanged.
15.
From the given bar graph, we find that,
i) The information given by the bar graph is the number of students in Class VIII in various academic years in the school.
(ii)In the year 2004-05, increase in the number of students is maximum.
(iii) The number of students is maximum in the year 2007 - 08.
(iv) False, because the number of students during 2005-06 is more than twice that of 2003-04.

8th Standard CBSE Syllabus & Materials
8th Standard CBSE
CBSE 8th Science Particulate Nature of Matter - New Model Questions Papers Study Material - QB365 Set A
NEW8th Standard CBSE
CBSE 8th Science Pressure, Winds, Stroms and Cyclones - New Model Questions Papers Study Material - QB365 Set A
NEW8th Standard CBSE
CBSE 8th Mathematics Quadrilaterals - New Model Questions Papers Study Material - QB365 Set A
NEW8th Standard CBSE
CBSE 8th Mathematics A story of Numbers - New Model Questions Papers Study Material - QB365 Set A



CBSE 8th Standard CBSE Subjects
CBSE Standards




