
 100% FREE ACCESS
8th Standard CBSE Syllabus & Materials
8th Standard CBSE
CBSE 8th Social Science Theme D - Factors of Production - New Model Questions Papers Study Material - QB365 Set A
NEW8th Standard CBSE
CBSE 8th Social Science Theme C - Universal Franchise and India's Electoral System - New Model Questions Papers Study Material - QB365 Set A
NEW8th Standard CBSE
CBSE 8th Social Science Theme B - The Rise of the Marathas - New Model Questions Papers Study Material - QB365 Set A
NEW8th Standard CBSE
CBSE 8th Social Science Theme B - Reshaping India's Political Map - New Model Questions Papers Study Material - QB365 Set A
NEW8th Standard CBSE
CBSE 8th Social Science Theme A - Natural Resources and Their Use - New Model Questions Papers Study Material - QB365 Set A
NEW8th Standard CBSE
CBSE 8th Science Keeping Time with Skies - New Model Questions Papers Study Material - QB365 Set A

Published on: 10/10/2019
Introduction to Graphs
Download CBSE Class 8th Standard CBSE Mathematics question papers, sample papers, important questions, and previous year solved papers in PDF format. Get free study materials, NCERT solutions, and exam preparation resources for Class 8th Standard CBSE Mathematics
Questions + Answers key
Take MCQ Mathematics Test
1.
Complete the following crossword puzzle:
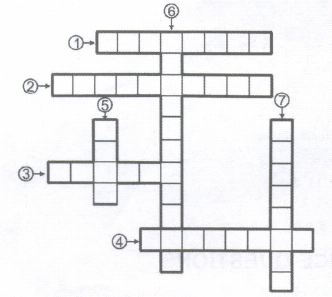
Direction:
Across:
(1) The x-coordinate of a point is also called its________________.
(2) In the Cartesian plane the number line XOX _______________is a line.
(3) The two perpendicular lines X'OX and Y'OY intersect at 0, which is called _______________.
(4) In the Cartesian plane, the number line Y'OY' _________________is a line.
Down:
(5) The horizontal line XOX is called the x_______________.
(6) The _____________of the origin are (0,0).
(7) The y-coordinate of a point is also called its____________.
2.
Mr. Aditya total gross salary income is Rs 25000 per month. Due to some daily extra expenses, he is unable to save money for future emergency. Atlast he took advice from his close friend Kritik. So, he make a chart for his monthly income, choice is given below:
| Expenditure | Amount |
| Education | Rs 5000 |
| Saving | Rs 4000 |
| House rent | Rs4500 |
| Charity | Rs1500 |
| Miscellaneous | Rs 10000 |
Draw a bar graph on the basis of above given table/chart. What value depicted here?
3.
The graph given below, shows the marks obtained out of 10 by Sonia in two different tests. Study the graph and answer the questions that follow:
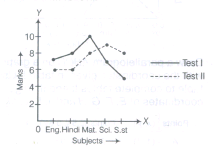
(a) What information is represented by the axes?
(b) In which subject did she score the highest in test I?
(c) In which subject did she score the least in test II?
(d) In which subjects did she score the same marks in both the tests?
(e) What are the marks scored by her in English in test II?
(f)ln which test was the performance better?
(g) In which subject and which test did she score full marks?
4.
The following graph showing the marks in Mathematics scored by the pupils of Class VIII. Study the graph and answer the questions that follow.
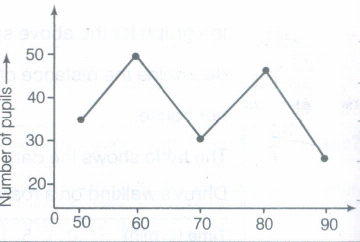
(a) How many pupils scored 50 marks?
(b) How many more pupils scroed 60 than those who scored 50?
5.
If simple interest on a certain sum is Rs.100 per year. Then, S = 100\(\times\)x, where x is the number of years.
From the graph, find the value of S, when,
(i) x= 7
(ii) x= 4
6.
If y-coordinate is 5/2 times of x-coordinate.Then, formed a table for it and draw a graph.
7.
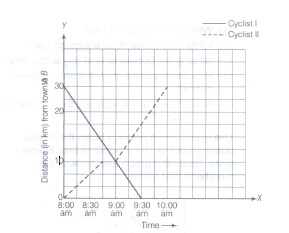
The following graph shows the journey made by two cyclists, one from town A to B and the other from town B to A
(a) At what time did cyclist II rest? How long did the cyclist rest?
(b) Was cyclist II cycling faster or slower after the rest?
(c) At what time did the two cyclists meet?
(d) What value depicted from here?
8.
The following table shows the colours preferred by students of a Class VIII :
| Colours | White | Red | Blue | Green |
| Number of students | 9 | 13 | 8 | 6 |
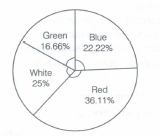
Represent this data in the form of pie diagram (approx).
9.
Locate the points A(1,2), B(4,2) and C(1, 4) on a graph sheet taking suitable axes. Write the coordinates of the fourth point D to complete the rectangle ABCD.
10.
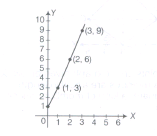
Complete the given tables and draw a graph for each.
(i)
| x | 0 | 1 | 2 | 3 |
| Y =3x +1 | 1 | 4 | - | - |
(ii)
| x1 | 1 | 2 | 4 | 6 |
| Y =x +1 | 0 |
1.
(1)⟶ABSCISSA
(2)⟶HORIZONTAL
(3)⟶ORIGIN
(4)⟶VERTICAL
(5)⟶AXIS
(6)⟶COORDINATES
(7)⟶ORDINATE
2.
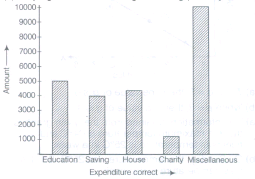
The value depicted here is that if we make a plan on expenditure, then we can save some money,
3.
(a) Subjects and marks obtained (out of 10) by Sonia in two tests.
(b) In Maths, she scored the highest in test I.
(c) In English and Hindi, she scored the least in test II.
(d) In Hindi and Maths, she scored the same marks in both tests.
(e) She scored 6 marks in English in test II.
(f) Same performance in both tests.
(g) Test I, in maths, she scored full marks i.e. 10 marks.
4.
(a) 35 pupils
(b) 15 more pupils
5.
(i) S = Rs 700
(ii) Rs 400
6.
| x | 2 | 4 | 6 | 8 |
|---|---|---|---|---|
| \(Y=\frac { 5 }{ 2 } x\) | 5 | 10 | 15 | 20 |
7.
(a) On the basis of given graph, the cyclist II rest at 8: 45 am for 15 min.
(b) Cyclist II is cycling faster after rest.
(c) Both meet at 9: 00 am.
(d) The value depicted here is that cycling is good for physical health. Also, an environment friendly mode of transportation.
8.
Number of students like white = 9
Number of students like red = 13
Number of students like blue = 8
Number of students like green = 6
\(\therefore\) Total number of students = 9 + 13 + 8 + 6 = 36
Now, percentage of students like white \(={9\over 36}\times100={900 \times 36}=25\%\)
Percentage of students like red \(={13\over 36}\times100={1300\times36}=36.11\%\)
Percentage of students like blue
\(={8\times 36}\times 100={800 \times 36}=22.22\%\)
9.
Given, points are A(1, 2),B(4,2)and C(1, 4). Location of given points on the graph given below:
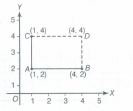
To complete the rectangle ABCD, the coordinate of the fourth point D is (4, 4), i.e. D (4, 4).
10.
(i) Given,y=3x+1
If x=O, then y=3x10+1=1
If x =1, then y = 3 x1 + 1= 4,
If x = 2, then y = 3 x 2 + 1= 6 + 1 = 7
If x = 3, then y = 3 x 3 + 1 = 9 + 1 = 10
So, completed table and graph given below:
| X | 0 | 1 | 2 | 3 |
| Y | 1 | 4 | 7 | 10 |
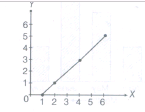
(ii) Given, y = x -1
If x = 1,then y = 1-1 = 0; If x = 2, then y = 2 -1 =1
If x = 4, then y = 4 -1 = 3; If x = 6, then y = 6 -1 = 5
So, complete table is
| X | 1 | 2 | 4 | 6 |
| Y | 0 | 1 | 3 | 5 |
and graph from the above data:

8th Standard CBSE Syllabus & Materials
8th Standard CBSE
CBSE 8th Science Particulate Nature of Matter - New Model Questions Papers Study Material - QB365 Set A
NEW8th Standard CBSE
CBSE 8th Science Pressure, Winds, Stroms and Cyclones - New Model Questions Papers Study Material - QB365 Set A
NEW8th Standard CBSE
CBSE 8th Mathematics Quadrilaterals - New Model Questions Papers Study Material - QB365 Set A
NEW8th Standard CBSE
CBSE 8th Mathematics A story of Numbers - New Model Questions Papers Study Material - QB365 Set A



CBSE 8th Standard CBSE Subjects
CBSE Standards




