
 100% FREE ACCESS
8th Standard CBSE Syllabus & Materials
8th Standard CBSE
CBSE 8th Social Science Theme D - Factors of Production - New Model Questions Papers Study Material - QB365 Set A
NEW8th Standard CBSE
CBSE 8th Social Science Theme C - Universal Franchise and India's Electoral System - New Model Questions Papers Study Material - QB365 Set A
NEW8th Standard CBSE
CBSE 8th Social Science Theme B - The Rise of the Marathas - New Model Questions Papers Study Material - QB365 Set A
NEW8th Standard CBSE
CBSE 8th Social Science Theme B - Reshaping India's Political Map - New Model Questions Papers Study Material - QB365 Set A
NEW8th Standard CBSE
CBSE 8th Social Science Theme A - Natural Resources and Their Use - New Model Questions Papers Study Material - QB365 Set A
NEW8th Standard CBSE
CBSE 8th Science Keeping Time with Skies - New Model Questions Papers Study Material - QB365 Set A

Published on: 05/09/2019
Introduction to Graphs
Download CBSE Class 8th Standard CBSE Mathematics question papers, sample papers, important questions, and previous year solved papers in PDF format. Get free study materials, NCERT solutions, and exam preparation resources for Class 8th Standard CBSE Mathematics
Questions + Answers key
Take MCQ Mathematics Test
1.
If y-coordinate is 3 times x-coordinate, form a table for it and draw a graph.
2.
Plot the given points on a graph sheet and check, if the points lie on a straight line. If not, name the shape they form, when joined in the given order (4,2), (3,3), (2,4), (5,4)
3.
The following data represent the expenditure on various items(named as A, B, ... ) of a family in a month. Represent the data in the form of a pie chart.
| Items | A | B | C | D | E |
| Amount (in Rs.) | 180 | 210 | 240 | 270 | 180 |
4.
The following line graph shows the yearly sales figures for a manufacturing company.
(a) What were the sales in (i) 2002 (ii) 2006?
(b) What were the sales in (i) 2003 (ii) 2005?
(c) Compute the difference between the sales in 2002 and 2006.
(d) In which year was there the greatest difference between the sales as compared to its previous year?
.png)
5.
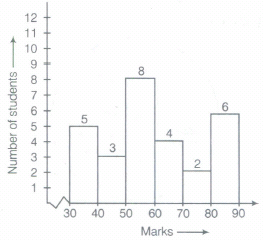
Construct a histogram for the following data.
| Marks | Number of students |
| 30 - 40 | 5 |
| 40 - 50 | 3 |
| 50 - 60 | 8 |
| 60 - 70 | 4 |
| 70 - 80 | 2 |
| 80 - 90 | 6 |
6.
Locate the points A(1,2), B(4,2) and C(1, 4) on a graph sheet taking suitable axes. Write the coordinates of the fourth point D to complete the rectangle ABCD.
7.
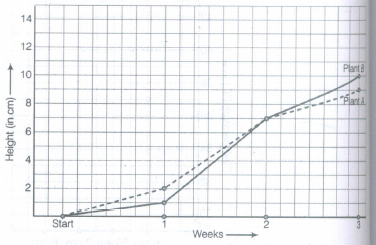
For an experiment in Botany, two different plants, plant A and plant B were grown under similar laboratory conditions. Their heights were measured at the end of each week for 3 weeks. The results are shown by the following graph:
(a) How high was plant A after (i) 2 weeks (ii) 3 weeks?
(b) How high was plant B after (i) 2 weeks (ii) 3 weeks?
(c) How much did plant A grow during the 3rd week?
(d) How much did plant B grow from the end of the 2nd week to the end of the 3rd week?
(e) During which week did plant A grow most?
(f) During which week did plant B grow least?
(g) Were the two plants of the same height during any week shown here? Specify.
8.
Is Example 7 (Textbook), a case of direct variation?
9.
A courier-person cycles from a town to a neighbouring Suburban area to deliver a parcel to a merchant. His distance from the town at different times is shown by the following graph:
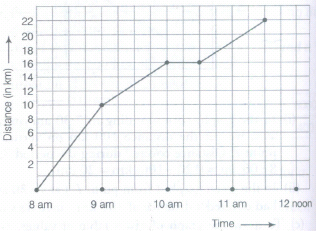
How much time did the person take for the travel?
10.
Write the x-coordinate (abscissa) of the given points.
(7, 3)
11.
Plot the given points on a graph sheet and check, if the points lie on a straight line. If not, name the shape they form when joined in the given order (3,0), (0,4), (-3,0) and (0, -4).
12.
Draw the line passing through (2, 3) and (3, 2). Find the coordinates of the points at which this line meets the X-axis and Y-axis.
13.
The coordinates of a point at a distance of 3 units from the X-axis and 6 units from the Y-axis is
(0,3)
(6, 0)
(3, 6)
(6, 3)
14.
A point which lies on both the axes is
(0,0)
(0, 1)
(1,0)
(1, 1)
15.
The point (3, 4) is at a distance of
3 from both the axis
4 from both the axis
4 from the X-axis and 3 from Y-axis
3 from x-axis and from Y-axis
16.
A graph that displays data that changes continuously over periods of time is
bar graph
pie chart
histogram
line graph
17.
Comparison of parts of a whole may be done by a
bar graph
pie chart
linear graph
line graph
18.
In the coordinates of a point, the second number denotes the ______________________
19.
A point has 5 as its x-coordinate and 4 as its y-coordinate. Then, the coordinates of the point are given by ________________
20.
In the point (4, 7), 4 denotes the_____________________
21.
The y-coordinate of the point (2, 4) is ______________________
22.
The x-coordinate of any point lying on the Y-axis will be ___________________
23.
In the point (4,3),3 denotes the x-coordinate and 4 denotes the y-coordinate.
24.
The y-coordinate of any point lying on the X-axis will be zero.
25.
The points (3, 5) and (5, 3) represent the same point.
26.
The coordinates of the origin are (0, 0).
27.
In the point (2, 3), 3 denotes the y-coordinate.
1.
If y-coordinate = 3 times of x-coordinates i.e. y=3x
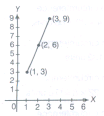
If x =1, then y = 3 x1 = 3
If x = 2 ,then y = 3 x 2 = 6
If x = 3, then y = 3 x 3 = 9
| x | 1 | 2 | 3 |
| y | 3 | 6 | 9 |
So, points are (1, 3), (2, 6) (3, 9) and graph is drawn as:
2.
Plotting of points (4, 2) (2,4) (3, 3) (5,4).
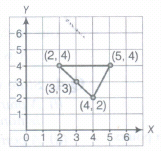
No, the points do not lie on a straight line. These points form a triangle.
3.
.png)
4.
(a) (i) From given graph, it is clear that the sales in the year 2002 was Rs 4 crore.
(ii) From given graph, it is clear that the sales in the year 2006 was Rs 8 crore.
(b) (i) The sales in the year 2003 was Rs 7 crore.
(ii) The sales in the year 2005 was Rs 10 crore.
(c) From the given graph,
The sales in the year 2002 = Rs 4 crore.
The sales in the year 2006 = Rs 8 crore,
\(\therefore\) Required difference = Sales in (2006-2002) crore = = Rs (8 - 4) crore = Rs 4 crore
(d) From the given graph, difference between the sales is in 2003 from the previous year 2002 = Rs (7 - 4) crore = Rs 3 crore and in 2005 from the previous year 2004 = = Rs (10 - 6) crore = Rs 4 crore
So, in 2005 there was the greatest difference between the sales as compared to its previous year.
5.
The histogram of the given data is shown below:
6.
Given, points are A(1, 2),B(4,2)and C(1, 4). Location of given points on the graph given below:
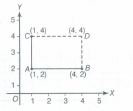
To complete the rectangle ABCD, the coordinate of the fourth point D is (4, 4), i.e. D (4, 4).
7.
(a) (i) From given graph, it is clear that the plant A was 7 cm high after 2 weeks.
(ii) From given graph, it is clear that the plant A was 9 cm high after 3 weeks.
(b) (i) From the given graph, it is clear that the plant B was 7 em high after 2 weeks.
(ii) From the given graph, it is clear that the plant B was 10 ern high after 3 weeks.
At the end of 2nd week height of plant A = 7 cm and at the end of 3rd week height of plant A = 9 cm
\(\therefore\) Increasing height of plant A from 2nd week to 3rd week = (9 - 7) = 2 cm
Hence, during the 3rd week plant, A grow 2 cm.
(d) At the end of 2nd week height of plant B = 7 cm and at the end of the 3rd week height of the plant B = 10 cm
\(\therefore\) Difference between the height from end of the 2nd week to 3rd week = (10 - 7) cm = 3 cm
Hence, the plant B grow 3 cm from the end of 2nd week to the end of 3rd week.
(e) From given graph.
\(\therefore\) Growth of plant A in 1st week = Height at the end of 1st week - Height at the starting of 2nd week
= 2 cm - 0 cm = 2 cm
\(\therefore\) Growth of plant A in 2nd week = Height at the end of 2nd week - Height at the starting of 2nd week
= 7 cm- 2 cm = 5 cm
\(\therefore\) Growth of plant A in 3rd week = Height at the end of 3rd week - Height at the starting of 3rd week
= 9 cm - 7 cm = 2 cm
So, we can say that the plant A grow mostly in 2nd week i.e. 5 cm.
(f) From given graph,
\(\therefore\) Growth of plant B in 1st week = Height at the end of 1stweek - Height at the starting 1st week
= 1 cm- 0 cm = 1 cm
\(\therefore\) Growth of plant B in 2nd week = Height at the end of 2nd week - Height at the starting of 2nd week
= 7 cm- 1 cm= 6 cm
\(\therefore\) Growth of plant B in 3rd week = Height at the end of 3rd week - Height at the starting of 3rd week
= 10 cm- 7 cm= 3 cm
So, we can say that the plant B grow least in 1st week i.e.1cm.
(g) From given graph, it is clearly shown that at the end of 2nd week, both the plants were of the same height i.e. 7 cm.
8.
Yes ! it is a case of direction variation as
\(\frac { 100 }{ 10 } =\frac { 200 }{ 20 } =\frac { 300 }{ 30 } =\frac { 500 }{ 50 } =\frac { 1000 }{ 100 } \)
=10(constant)
9.
3 h 30 min
10.
Given, (7, 3)
In this point, x-coordinate (abscissa) is 7 i.e.
x =7.
11.
.png)
Shape formed by these points is a rhombus.
12.
.png)
Firstly, we plot the points A (2,3) and B (3,2) on the graph paper and joining them, then we get the following graph:
On extending this line in both directions, it intersect X-axis and Y-axis at points C and D, respectively. Now, coordinates of point Care (5, 0) (since, it is at a distance 5 units from 0 on X-axis) and Dare (0, 5) (since, it is at a distance 5 units from 0 on Y-axis).
Hence, the line will meet on X-axis at (5,0) and Y-axis at (0,5).
13.
(d)
(6, 3)
14.
(a)
(0,0)
15.
(c)
4 from the X-axis and 3 from Y-axis
16.
(d)
line graph
17.
(b)
pie chart
18.
()
ordinate.
19.
()
(5, 4).
20.
()
abscissa.
21.
()
4
22.
()
zero.
23.
(b)
24.
(a)
25.
(b)
26.
(a)
27.
(a)

8th Standard CBSE Syllabus & Materials
8th Standard CBSE
CBSE 8th Science Particulate Nature of Matter - New Model Questions Papers Study Material - QB365 Set A
NEW8th Standard CBSE
CBSE 8th Science Pressure, Winds, Stroms and Cyclones - New Model Questions Papers Study Material - QB365 Set A
NEW8th Standard CBSE
CBSE 8th Mathematics Quadrilaterals - New Model Questions Papers Study Material - QB365 Set A
NEW8th Standard CBSE
CBSE 8th Mathematics A story of Numbers - New Model Questions Papers Study Material - QB365 Set A



CBSE 8th Standard CBSE Subjects
CBSE Standards




