
 100% FREE ACCESS
8th Standard Syllabus & Materials
8th Standard
TN 8th Tamil இயல் 3 - கல்வி கரையில - வினைமுற்று Important Questions And Answers Study Material - QB365 Set A
NEW8th Standard
TN 8th Tamil இயல் 2 - ஈடில்லா இயற்கை - மயங்கொலிகள் Important Questions And Answers Study Material - QB365 Set A
NEW8th Standard
TN 8th Tamil இயல் 2 - ஈடில்லா இயற்கை -பட்டமரம் Important Questions And Answers Study Material - QB365 Set A
NEW8th Standard
TN 8th Tamil இயல் 2 - ஈடில்லா இயற்கை - இயற்கையை போற்றுவோம் Important Questions And Answers Study Material - QB365 Set A
NEW8th Standard
TN 8th Tamil இயல் 1 - தமிழ் இன்பம் - ஆழிக்கு இணை Important Questions And Answers Study Material - QB365 Set A
NEW8th Standard
TN 8th Tamil இயல் 2-ஈடில்லா இயற்கை - திருக்குறள் Important Questions And Answers Study Material - QB365 Set A

Published on: 15/06/2021
QB365 provides detailed and simple solution for every book back questions in class 8 Maths subject.It will helps to get more idea about question pattern in every book back questions with solution.
Download Tamil Nadu 8th Standard Maths question papers, model tests, one-mark questions, important questions, and public exam papers in PDF format. Free study materials and answer keys for TN State Board students.
Questions + Answers key
Take MCQ Maths Test1.
Write the following scientific notations in standard form: 2.27 \(\times\) 10-4
2.
Combine the scientific notations: (7 x 10 2) (5.2 x 10⁷)
3.
Simplify and write the answer in exponential form:
\(\left( { 3 }^{ 5 }\div { 3 }^{ 8 } \right) ^{ 5 }\times { 3 }^{ -5 }\)
4.
Simplify : \(\\ \cfrac { { 3 }^{ 2 } }{ { 3 }^{ -2 } } \)
5.
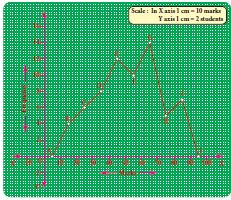
Draw a frequency polygon for the following data without using histogram
| Class interval (Marks) | 10-20 | 20-30 | 30-40 | 40-50 | 50-60 | 60-70 | 70-80 | 80-90 |
| Frequency | 4 | 6 | 8 | 12 | 10 | 14 | 5 | 7 |
6.
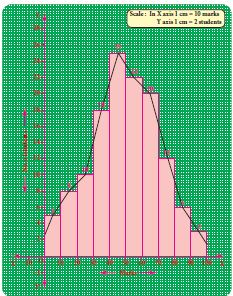
Draw a frequency polygon for the following data using histogram
| marks | 0-10 | 10-20 | 20-30 | 30-40 | 40-50 | 50-60 | 60-70 | 70-80 | 80-90 | 90-100 |
| Number of students | 5 | 8 | 10 | 18 | 25 | 22 | 20 | 13 | 6 | 3 |
7.
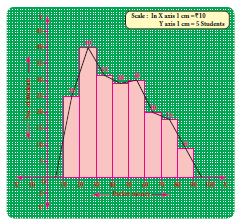
The following is the distribution of pocket money of 200 students in a school.
| Pocket money | 10-20 | 20-30 | 30-40 | 40-50 | 50-60 | 60-70 | 70-80 | 80-90 |
| Number of Students | 25 | 40 | 33 | 28 | 30 | 20 | 16 | 8 |
Draw a frequency polygon using histogram.
8.
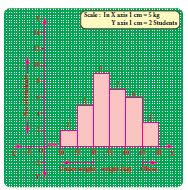
Observe the given histogram and answer the following questions
Hint: Under weight: less than 30 kg; Normal weight: 30 to 45 kg; Obese: More than 45 kg
1. What information does the histogram represent?
2. Which group has maximum number of students?
3. How many of them are under weight?
4. How many students are obese?
5. How many students are in the weight group of 30-40 kg?
9.
The following table gives the number of literate females in the age group 10 to 45 years in a town.
| Age group | 10-15 | 16-21 | 22-27 | 28-33 | 34-39 | 40-45 |
| No. of females | 350 | 920 | 850 | 480 | 230 | 200 |
Draw a histogram to represent the above data
10.
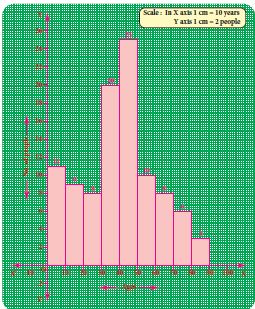
Draw a histogram for the following table which represents the age groups from 100 people in a village.
| Ages | 0-10 | 10-20 | 20-30 | 30-40 | 40-50 | 50-60 | 60-70 | 70-80 | 80-90 |
| Number of people | 11 | 9 | 8 | 20 | 25 | 10 | 8 | 6 | 3 |
11.
Construct a square LAMP of side 4 cm. Also find its area.
12.
Construct a rectangle BEAN with BE = 5 cm and BN = 3 cm. Also find its area
13.
Construct a rhombus NEST with NS = 9 cm and ET = 8 cm. Also find its area
14.
Construct a rhombus ROSE with RO = 5 cm and RS = 8 cm. Also find its area.
15.
Find x so that (-7)x + 2 X( - 7) 5 = (-7) 10
1.
2.27 x 10−4 = 0.000227
2.
(7 x 10²) (5.2 x 10⁷) = 36.4 = 109 = 3.64 x 10¹⁰
3.
\(\left( \cfrac { { 3 }^{ 5 } }{ { 3 }^{ 8 } } \right) ^{ 5 }\times \left( { 3 }^{ -5 } \right) =\left( { 3 }^{ 5-8 } \right) ^{ 5 }\times { 3 }^{ -5 }=\left( { 3 }^{ -3 } \right) ^{ 5 }\times { 3 }^{ -5 }={ 3 }^{ -3\times 5 }\times { 3 }^{ -15 }={ 3 }^{ -15-5 }=\cfrac { 1 }{ { 3 }^{ 20 } } \)
4.
\(\\ \cfrac { { 3 }^{ 2 } }{ { 3 }^{ -2 } } ={ 3 }^{ 2 }\times { 3 }^{ 2 }=9\times 9=81\)
5.
Find the midpoint of the class intervals and tabulate it.
| Class interval ( C.I) | Mid point (x) | Frequency (f) |
| 10 – 20 | 15 | 4 |
| 20 – 30 | 25 | 6 |
| 30 – 40 | 35 | 8 |
| 40 – 50 | 45 | 12 |
| 50 – 60 | 55 | 10 |
| 60 – 70 | 65 | 14 |
| 70 – 80 | 75 | 5 |
| 80 – 90 | 85 | 7 |
The points are A(5,0) B(15,4) C(25,6) D(35,8) E(45,12) F(55,10) G(65,14) H(75,5) I(85,7) J(95,0).
In the graph sheet, mark the midpoints along the x- axis and the frequency along the y- axis.
We take the imagined class as 0 – 10 at the beginning and 90 – 100 at the end , each with frequency ‘zero’.
From the table, plot the points. We draw the line segments AB, BC, CD, DE, EF, FG, GH, HI, IJ to obtain the required frequency polygon ABCDEFGHIJ.
6.
Mark the class intervals along the x-axis and the number of students along the y-axis . Draw a histogram for the given data and mark the midpoints of the rectangles and join them by lines. We get frequency polygon. Note that the first and last edges of the frequency polygon meet at the mid points of the left and right vertical edges of first and last rectangles. Because imagined class intervals do not exist in the marks (refer the above note).
7.
Represent the pocket money along x- axis and number of students along the y–axis.
Draw a histogram for the given data. Now, mark the midpoints of the upper sides of the consecutive rectangles. Also mark the midpoints of two imagined class intervals 0-10 and 90-100 whose frequency is 0 on x- axis. Now, join all the midpoints with the help of ruler. We get a frequency polygon imposed on the histogram.
8.
1. The histogram represents the collection of weights from std VIII.
2. There are maximum 9 students in 30-35 kg weight.
3. There are 7(= 2 + 5) students who are under weight
4. There are 3 students who are obese
5. There are 16( = 9 + 7) students in the 30-40 kg weight group.
9.
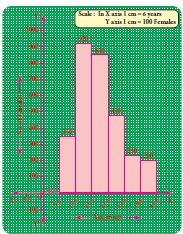
The given distribution is discontinuous. If we represent the given data as it is by a graph we shall get a bar graph, as there will be gaps in between the classes. So, convert this into a continuous distribution using the adjustment factor 0.5.
The first class interval can be written as 9.5-15.5 and the remaining class intervals are changed in the same way. There are no changes in frequencies.
The new continuous frequency table is
| Age group | 9.5-15.5 | 15.5-21.5 | 21.5-27.5 | 27.5-33.5 | 33.5-39.5 | 39.5-45.5 |
| No of females | 350 | 920 | 830 | 480 | 230 | 200 |
The histogram is constructed as below
10.
The given data is a continuous frequency distribution. The class intervals are drawn on x axis and their respective frequencies on y-axis. Classes (ages) and its frequencies (number of people) are taken together to form a rectangle.
The histogram is constructed as given below
11.
Given: side = 4 cm
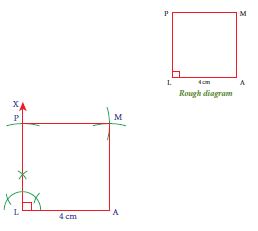
Steps:
(i) Draw a line segment LA = 4 cm.
(ii) At L, construct LX ⊥LA.
(iii) With L as centre, draw an arc of radius 4 cm and let it cut LX at P.
(iv) With A and P as centres, draw arcs of radius 4 cm each and let them cut at M.
(v) Join AM and PM. LAMP is the required square
Calculation of area:
Area of square LAMP = a2 sq.units
= 4 x 4 = 16sq.cm
12.
Given: BE = 5 cm and BN = 3 cm
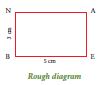
Steps:
(i) Draw a line segment BE = 5 cm.
(ii) At B, construct BX ⊥BE .
(iii) With B as centre, draw an arc of radius 3 cm and let it cut BX at N.
(iv) With E and N as centres, draw arcs of radii 3 cm and 5 cm respectively and let them cut at A.
(v) Join EA and NA.
(vi) BEAN is the required rectangle
Calculation of area:
Area of rectangle BEAN = l × b sq.units
= 5 x 3 = 15sq.cm
13.
Given: NS = 9 cm and ET = 8 cm
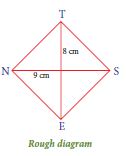
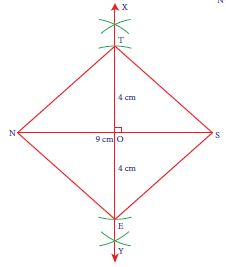
Steps
(i) Draw a line segment NS = 9 cm.
(ii) Draw the perpendicular bisector XY to NS. Let it cut NS at O.
(iii) With O as centre, draw arcs of radius 4 cm on either side of
O which cut OX at T and OY at E.
(iv) Join NE, ES, ST and TN.
(v) NEST is the required rhombus
Calculation of area:
Area of rhombus NEST=\(\cfrac { 1 }{ 2 } \times { d }_{ 1 }\times { d }_{ 2 }sq.units\)
=\(\cfrac { 1 }{ 2 } \times { d }_{ 1 }\times { d }_{ 2 }sq.units\)
= \(\cfrac { 1 }{ 2 } \times 9\times 8=36sq.cm\)
14.
Given: RO = 5 cm and RS = 8 cm
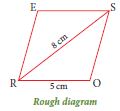
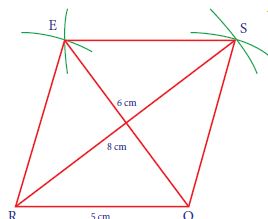
Steps:
(i) Draw a line segment RO = 5 cm.
(ii) With R and O as centres, draw arcs of radii 8 cm and 5 cm respectively and let them cut at S.
(iii) Join RS and OS.
(iv) With R and S as centres, draw arcs of radius 5 cm each and let them cut at E.
(v) Join RE and SE.
(vi) ROSE is the required rhombus.
Calculation of area:
Area of rhombus ROSE =\(\cfrac { 1 }{ 2 } \times { d }_{ 1 }\times { d }_{ 2 }\) sq.units
= \(\cfrac { 1 }{ 2 } \times 8\times 6=24sq.cm\)
15.
(-7)x + 2 x(-7)5 = (-7)10
(-7)x + 2 + 5 = (-7)10
Since the bases are equal, we equate the exponents and get
x + 7 = 10
x = 10 - 7 = 3

8th Standard Syllabus & Materials
8th Standard
TN 8th Tamil இயல் 3 - கல்வி கரையில - பாடறிந்து ஒழுகுதல் Important Questions And Answers Study Material - QB365 Set A
NEW8th Standard
TN 8th Tamil இயல் 3-கல்வி கரையில - பல்துறைக் கல்வி Important Questions And Answers Study Material - QB365 Set A
NEW8th Standard
TN 8th Tamil இயல் 3-கல்வி கரையில - புத்தியைத் தீட்டு Important Questions And Answers Study Material - QB365 Set A
NEW8th Standard
TN 8th Tamil இயல் 2 - ஈடில்லா இயற்கை - தமிழர் மருத்துவம் ( நேர்காணல்) Important Questions And Answers Study Material - QB365 Set A



Tamilnadu Stateboard 8th Standard Subjects
Tamilnadu Stateboard Standards




