
 100% FREE ACCESS
8th Standard Syllabus & Materials
8th Standard
TN 8th Tamil இயல் 3 - கல்வி கரையில - வினைமுற்று Important Questions And Answers Study Material - QB365 Set A
NEW8th Standard
TN 8th Tamil இயல் 2 - ஈடில்லா இயற்கை - மயங்கொலிகள் Important Questions And Answers Study Material - QB365 Set A
NEW8th Standard
TN 8th Tamil இயல் 2 - ஈடில்லா இயற்கை -பட்டமரம் Important Questions And Answers Study Material - QB365 Set A
NEW8th Standard
TN 8th Tamil இயல் 2 - ஈடில்லா இயற்கை - இயற்கையை போற்றுவோம் Important Questions And Answers Study Material - QB365 Set A
NEW8th Standard
TN 8th Tamil இயல் 1 - தமிழ் இன்பம் - ஆழிக்கு இணை Important Questions And Answers Study Material - QB365 Set A
NEW8th Standard
TN 8th Tamil இயல் 2-ஈடில்லா இயற்கை - திருக்குறள் Important Questions And Answers Study Material - QB365 Set A

Published on: 13/05/2022
QB365 provides detailed and simple solution for every book back questions in class 8 Maths subject.It will helps to get more idea about question pattern in every book back questions with solution.
latest Book back QuestionsDownload Tamil Nadu 8th Standard Maths question papers, model tests, one-mark questions, important questions, and public exam papers in PDF format. Free study materials and answer keys for TN State Board students.
Questions + Answers key
Take MCQ Maths Test1.
Draw a suitable pie chart for the following data relating to the cost of construction of a house.
| Particulars | Bricks | Steel | Cement | Timber | Labour | Others |
| Expenses: | 10% | 15% | 25% | 10% | 20% | 20% |
Also, find how much was spent on labour if Rs.55000 was spent for cement.
2.
Draw a pie diagram to represent the following data, which shows the expenditure of paddy cultivation in 2 acres of land.
| Particulars | Seeds | Ploughing | Wages | Fertilizer | Harvest | Others |
| Expenses (Rs) | 2000 | 6000 | 10000 | 7000 | 8000 | 3000 |
Also,
1. Find the percentage of the head in which he had spent more?
2. What percentage of money was spent for seeds?
3.
The number of hours spent by a school student on various activities on a working day is given below. Construct a pie chart.
| Activity | Sleep | School | Play | Home work | Other |
| No of hours | 8 | 6 | 2 | 3 | 5 |
1. Find the percentage of sleeping hours.
2. By what angle is home work more than play?
3. By what angle are other activities less than sleep?
4.
The EB bill(in Rs.) of each of the 26 houses in a village are given below. Construct the frequency table
| 215 | 200 | 120 | 350 | 800 | 600 | 350 | 400 | 180 | 210 | 170 | 305 | 204 |
| 220 | 425 | 540 | 315 | 640 | 700 | 790 | 340 | 586 | 660 | 785 | 290 | 300 |
5.
Form an ungrouped frequency distribution table for the weight of 25 students in STD IV given below and answer the following questions.
25, 24, 20, 25, 16, 15, 18, 20, 25, 16, 20, 16, 15, 18, 25, 16, 24, 18, 25, 15, 27, 20, 20, 27, 25.
(i) Find the range of the weights.
(ii) How many of the students has the highest weight in the class?
(iii) What is the weight to which more number of students belong to?
(iv) How many of them belong to the least weight?
1.
| Particulars | Expenses | Central angle |
| Bricks | 10 % | \(\cfrac { 10 }{ 100 } \times { 360 }^{ 0 }={ 36 }^{ 0 }\) |
| Steel | 16 % | \(\frac{15}{100} \times 360^{\circ}=54^{\circ}\) |
| Cement | 22 % | \(\frac{25}{100} \times 360^{\circ}=90^{\circ}\) |
| Timber | 10 % | \(\cfrac { 10 }{ 100 } \times { 360 }^{ 0 }={ 36 }^{ 0 }\) |
| Labour | 26 % | \(\frac{20}{100} \times 360^{\circ}=72^{\circ}\) |
| Others | 16 % | \(\frac{20}{100} \times 360^{\circ}=72^{\circ}\) |
| Total | 360° |
Cost of construction of a house.
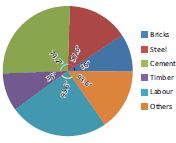
If the expenses on cement is Rs. 55000 then, it represents 22 % and he spent 26 % on labour
Therefore, the expense on Labour = \(\cfrac { 26 }{ 22 } \times 55000\)
= Rs.44,000
| % | Expenses |
| \(\uparrow \begin{matrix} 22 \\ 26 \end{matrix}\) | \(\begin{matrix} 55000 \\ ? \end{matrix}\uparrow \) |
| Direct proportion | |
2.
| Particulars | Expenses | Central angle |
| Seeds | 2000 | \(\cfrac { 2000 }{ 36000 } \times { 360 }^{ 0 }={ 20 }^{ 0 }\) |
| Plough | 6000 | \(\cfrac { 6000 }{ 36000 } \times { 360 }^{ 0 }={ 60 }^{ 0 }\) |
| Coolie | 10000 | \(\cfrac { 10000 }{ 36000 } \times { 360 }^{ 0 }={ 100 }^{ 0 }\) |
| Fertilizer | 7000 | \(\cfrac { 7000 }{ 36000 } \times { 360 }^{ 0 }={ 70 }^{ 0 }\) |
| Harvesting | 8000 | \(\cfrac { 8000 }{ 36000 } \times { 360 }^{ 0 }={ 80 }^{ 0 }\) |
| Others | 3000 | \(\cfrac { 3000 }{ 36000 } \times { 36 }0^{ 0 }={ 30 }^{ 0 }\) |
| Total | 36000 | 360° |
Expenditure of paddy cultivation in 2 acres.
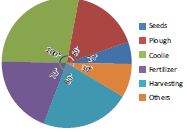
1. He spent more for wages Rs.10,000. Converting into percentage, We have
\(Wages=\cfrac { 10000 }{ 36000 } \times 100\%\)
2. He spent Rs. 2000 for seeds. Converting into percentage,We have
\(\\ Seeds=\cfrac { 2000 }{ 36000 } \times 100\%=5.55\%\)
3.
Number of hours spent in different activities in a day of 24 hours are converted into components parts of 360°.
| Activity | Duration | Central angle |
| Sleep | 8 | \(\cfrac { 8 }{ 24 } \times { 360 }^{ 0 }={ 120 }^{ 0 }\) |
| School | 6 | \(\cfrac { 6 }{ 24 } \times { 360 }^{ 0 }={ 90 }^{ 0 }\) |
| Play | 2 | \(\cfrac { 2 }{ 24 } \times { 360 }^{ 0 }={ 30 }^{ 0 }\) |
| Home work | 3 | \(\cfrac { 3 }{ 24 } \times { 360 }^{ 0 }={ 45 }^{ 0 }\) |
| Others | 5 | \(\cfrac { 5 }{ 24 } \times { 360 }^{ 0 }={ 75 }^{ 0 }\) |
| Total | 24 | 360° |
The time spent by a school student during a day (24 hours)
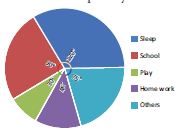
1. The percentage of sleeping hours = \(\cfrac { 8 }{ 24 } \times 100=33.33\%\)
2. Home work is 45°– 30° = 15° more than play
3. Other activities are 120°–75° = 45° less than sleep
4.
Maximum bill amount = Rs. 800
Minimum bill amount = Rs.120
Range = maximum value – minimum value
Range = 800 – 120 = Rs. 680
Suppose if we want to take class size as 100, then the number of possible class intervals = \(\cfrac { Range }{ Class\ size } \)
= \(\cfrac { 680 }{ 100 } =6.8\simeq 7\)
| Class Intervals | Tally Marks | Frequency |
|---|---|---|
| 100-200 | ||| | 3 |
| 200-300 |  |
6 |
| 300-400 | |
6 |
| 400-500 | || | 2 |
| 500-600 | || | 2 |
| 600-700 | ||| | 3 |
| 700-800 | |||| | 4 |
| Total | 26 |
5.
To form a distribution table, arrange the given data in ascending order under Weight column then, put a vertical mark against each variable under Tally marks column and count the number of tally marks against the variable and enter it in Frequency column as given below. Hence, the distribution table is
| Weihght | Tally Marks | Frequency |
| 15 | ||| | 3 |
| 16 | |||| | 4 |
| 18 | ||| | 3 |
| 20 |  |
5 |
| 24 | || | 2 |
| 25 |  |
6 |
| 27 | || | 2 |
| Total | 25 |
Thus, we can tabulate the above table as follows,
| Weight (kg) | 15 | 16 | 18 | 20 | 24 | 25 | 27 |
| Frequency | 3 | 4 | 3 | 5 | 2 | 6 | 2 |
(i) The range of the given data is the difference between the largest and the smallest value. Here, the range = 27– 15 = 12.
(ii) From this table, two of the students have the highest weight of 27 kg.
(iii) 6 students belong to 25 kg weight.
(iv) 3 students belong to the least weight of 15 kg.
So, when we tabulate the given data, it is easy to get the information at a glance.

8th Standard Syllabus & Materials
8th Standard
TN 8th Tamil இயல் 3 - கல்வி கரையில - பாடறிந்து ஒழுகுதல் Important Questions And Answers Study Material - QB365 Set A
NEW8th Standard
TN 8th Tamil இயல் 3-கல்வி கரையில - பல்துறைக் கல்வி Important Questions And Answers Study Material - QB365 Set A
NEW8th Standard
TN 8th Tamil இயல் 3-கல்வி கரையில - புத்தியைத் தீட்டு Important Questions And Answers Study Material - QB365 Set A
NEW8th Standard
TN 8th Tamil இயல் 2 - ஈடில்லா இயற்கை - தமிழர் மருத்துவம் ( நேர்காணல்) Important Questions And Answers Study Material - QB365 Set A



Tamilnadu Stateboard 8th Standard Subjects
Tamilnadu Stateboard Standards




