
 100% FREE ACCESS
8th Standard CBSE Syllabus & Materials
8th Standard CBSE
CBSE 8th Social Science Theme D - Factors of Production - New Model Questions Papers Study Material - QB365 Set A
NEW8th Standard CBSE
CBSE 8th Social Science Theme C - Universal Franchise and India's Electoral System - New Model Questions Papers Study Material - QB365 Set A
NEW8th Standard CBSE
CBSE 8th Social Science Theme B - The Rise of the Marathas - New Model Questions Papers Study Material - QB365 Set A
NEW8th Standard CBSE
CBSE 8th Social Science Theme B - Reshaping India's Political Map - New Model Questions Papers Study Material - QB365 Set A
NEW8th Standard CBSE
CBSE 8th Social Science Theme A - Natural Resources and Their Use - New Model Questions Papers Study Material - QB365 Set A
NEW8th Standard CBSE
CBSE 8th Science Keeping Time with Skies - New Model Questions Papers Study Material - QB365 Set A

Published on: 24/09/2019
Introduction to Graphs
Download CBSE Class 8th Standard CBSE Mathematics question papers, sample papers, important questions, and previous year solved papers in PDF format. Get free study materials, NCERT solutions, and exam preparation resources for Class 8th Standard CBSE Mathematics
Questions + Answers key
Take MCQ Mathematics Test
1.
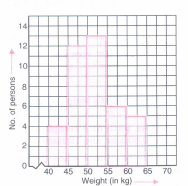
What is the information that you gather from given histogram? Try to list them out.
2.
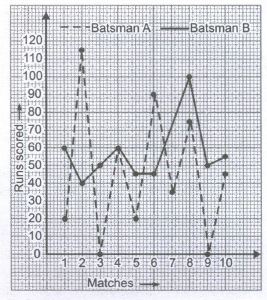
Following graph represents the total runs scored by two batsmen A and B, during each of the ten different matches in the year 2007. Study the graph and answer the following questions.
(i) What information is given on the two axes?
(ii) Which line shows the runs scored by batsman A?
(iii) Were the run scored by them same in any match in 20017 If so, in which match?
(iv) Among the two batsmen, who is steadier? How do you judge it?
3.
Plot the following points and verify if they lie on a line. If they lie on a line, name it.
|(i) (0, 2); (0, 5); (0, 6); (0, 3.5) .
(ii) A (1, 1) ; B (1, 2); C (1, 3); D (1, 4).
(iii) K (1, 3); L (2, 3); M (3, 3); N (4, 3)
(iv) W (2, 6); X (3, 5); Y (5, 3); Z (6, 2)
4.
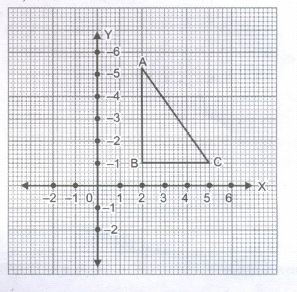
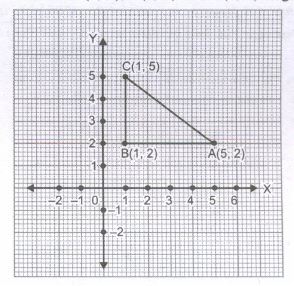
Find the coordinates of the vertices of MBC given in graph. Draw a triangle by taking vertices as A(5, 2), B(1, 2) and C(1, 5).
5.
Draw a line passing through (2, 1) and (1, 2). Find the coordinates of the points at which this line meets the x-axis and y-axis.
6.
The following table shows the export earning of India (in Rs.thousand crore) during five consecutive years:
| Years | 2001-02 | 2002-03 | 2003-04 | 2004-05 | 2005-06 |
| Exports (Rs.in thousand crore) |
132 | 140 | 162 | 202 | 158 |
Draw a bar graph representing the above data.
7.
The sales of a shopkeeper for eight days of a month in any year is given below:
| Date | 1 | 2 | 3 | 4 | 5 | 6 | 7 | 8 |
| Sales(in Rs.) | 3300 | 3390 | 3450 | 3490 | 3370 | 3470 | 3590 | 4000 |
Draw the line graph depicting the above data.
8.
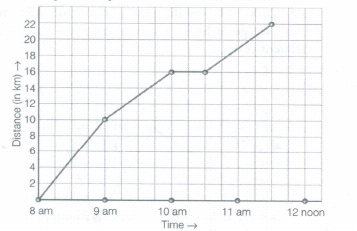
A courier-person cycle from a town to a neighbouring Suburban area to deliver a parcel to a merchant. His distance from the town at different times is shown by the following graph.
(a) What is the scale taken for the time axis?
(b) How much time did the person take for the travel?
(c) How far is the place of the merchant from the town?
(d) Did the person stop on his way? Explain.
(e) During which period did he ride fastest?
9.
The following graph shows the temperature of a patient in a hospital, recorded every hour.
(a) What was the patient's temperature at 1 pm?
(b) When was the patient's temperature 38.5°C?
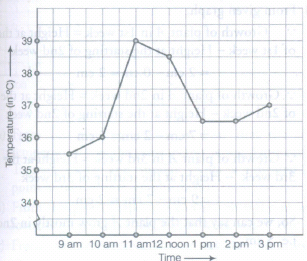
(c) The patient's temperature was the same two times during the period given. What were these two times?
(d) What was the temperature at 1: 30 pm? How did you arrive at your answer?
(e) During which periods did the patient's temperature showed an upward trend?
10.
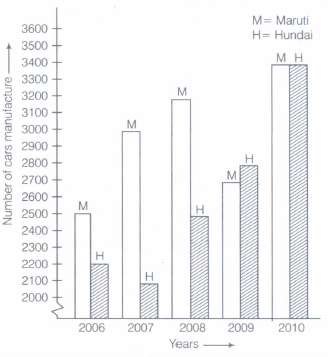
Draw a double bar graph for the following data showing the manufacture of cars of Maruti and Hundai in various years.
| Years \(\rightarrow\) cars \(\downarrow\) |
2006 | 2007 | 2008 | 2009 | 2010 |
| Maruti | 2500 | 3000 | 3200 | 2700 | 3400 |
| Hundai | 2200 | 2100 | 2500 | 2800 | 3400 |
1.
This histogram illustrates the distribution of weights (in kg) of 40 persons of a locality. The information that we gather from this histogram are as follows:
(i) Maximum number of persons in the locality have their weights (in kg) in the interval 50-55.
(ii) Minimum number of persons in the locality have their weights (in kg) in the interval 40-45.
2.
(i) The horizontal axis (or the x-axis) indicates the matches played during the year 2007. The vertical axis (or the y-axis) shows the total runs scored in each match.
(ii) The dotted line shows the runs scored by Batsman A. (This is already indicated at the top of the graph).
(iii) During the 4th match, both have scored the same number of 60 runs. (This is indicated by the point at which both graphs meet).
(iv) Batsman A has one great “peak” but many deep “valleys”. He does not appear to be consistent. B, on the other hand, has never scored below a total of 40 runs, even though his highest score is only 100 in comparison to 115 of A. Also, A has scored a zero in two matches and in a total of 5 matches he has scored less than 40 runs. Since A has a lot of ups and downs, B is a more consistent and reliable batsman.
3.
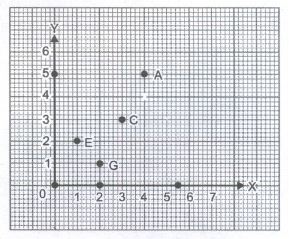
These lie on a line. We can name it as KL or KM or MN etc. It is parallel to x-axis.
These lie on a line. We can name it as XY or WY or YZ etc.
Note that in each of the above cases, graph obtained by joining the plotted points is a line. Such graphs are called linear graphs.
4.
From the graph, the vertices of MBC are: A, Band C. We find that
The coordinates of A are (2, 5).
The coordinates of Bare (2, 1).
The coordinates of Care (5, 1).
The required triangle with vertices as A(5, 2), B(1, 2) and C(1, 5) is given in the following graph.
5.
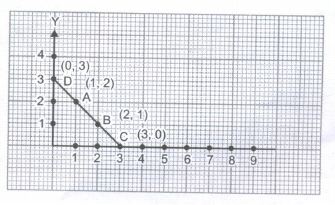
On plotting the given points A(1, 2) and B(2, 1) on the same graph and joining them, we get a straight line AB. When we extend the line AB on both sides, we find that it intersects the x-axis at C(3, 0) and the y-axis at D(0, 3).
6.
.png)
7.
.png)
8.
(a) In the given graph, the scale is taken for the time axis (i.e. along X-axis) is 4 units = 1h.
(b) The person starts travel at 8 am and end at 11: 30 am.
So, total travelling time = Difference between 8 am to 11: 30 am = \(3\frac{1}{2}\)h or 3 h 30 min
(c) From the given graph, it is clear that the distance of place of the merchant from the town is 22 km.
(d) Yes, from the given graph, it is clear that the person was 16 km away from town when the time was 10 am to 10: 30 am. This shows that the person did not tray during the interval 10 am to 10: 30 am. The horizons line segment representing travel during this period is illustrative of this fact.
(e) Distance covered by person between 8 am to 9 arn = 10krn
Distance covered by person between 9 am to 10 am = (16 - 10)km = 6 km
Distance covered by person between 10 am to 10: 30 am = (16 -16) km = 0 km
Distance covered by person between 10: 30 am to 11: 30 am = (22 -16) km = 6 km
Hence, we can say that the courier person ride fastestin between 8 am to 9 am.
9.
(a) From the given graph, it is clear that the patient's temperature at 1 pm was36.5°C.
(b) From the given graph, it is clear that the patient's temperature was 38.5°C at 12 noon.
(c) From the given graph, it is clear that the patient's temperature was same i.e. 36.5°C at 1 pm and 2 pm.
(d) From the given graph, it is clear that the patient's temperature at 1 pm and 2 pm was same, which is 36.5°C. This shows that temperature did not change during the interval 1 pm to 2 pm. Also, 1: 30 pm is between 1 pm and 2 pm, so the temperature at 1: 30 pm was 36.5°C.
(e) From the given graph, it is clear that the patient's temperature showed an upward trend during the periods 9 am to 10 am, 10 am to 11 am and 2 pm to 3 pm, because temperature is increasing in these intervals.
10.
A double bar graph shown below, based on given data in the question:

8th Standard CBSE Syllabus & Materials
8th Standard CBSE
CBSE 8th Science Particulate Nature of Matter - New Model Questions Papers Study Material - QB365 Set A
NEW8th Standard CBSE
CBSE 8th Science Pressure, Winds, Stroms and Cyclones - New Model Questions Papers Study Material - QB365 Set A
NEW8th Standard CBSE
CBSE 8th Mathematics Quadrilaterals - New Model Questions Papers Study Material - QB365 Set A
NEW8th Standard CBSE
CBSE 8th Mathematics A story of Numbers - New Model Questions Papers Study Material - QB365 Set A



CBSE 8th Standard CBSE Subjects
CBSE Standards




