
 100% FREE ACCESS
8th Standard CBSE Syllabus & Materials
8th Standard CBSE
CBSE 8th Social Science Theme D - Factors of Production - New Model Questions Papers Study Material - QB365 Set A
NEW8th Standard CBSE
CBSE 8th Social Science Theme C - Universal Franchise and India's Electoral System - New Model Questions Papers Study Material - QB365 Set A
NEW8th Standard CBSE
CBSE 8th Social Science Theme B - The Rise of the Marathas - New Model Questions Papers Study Material - QB365 Set A
NEW8th Standard CBSE
CBSE 8th Social Science Theme B - Reshaping India's Political Map - New Model Questions Papers Study Material - QB365 Set A
NEW8th Standard CBSE
CBSE 8th Social Science Theme A - Natural Resources and Their Use - New Model Questions Papers Study Material - QB365 Set A
NEW8th Standard CBSE
CBSE 8th Science Keeping Time with Skies - New Model Questions Papers Study Material - QB365 Set A

Published on: 29/10/2025
Download CBSE Class 8th Standard CBSE Social Science question papers, sample papers, important questions, and previous year solved papers in PDF format. Get free study materials, NCERT solutions, and exam preparation resources for Class 8th Standard CBSE Social Science
Questions + Answers key
Take MCQ Social Science Test
1.
Look carefully at the given graph and answer the questions that follow
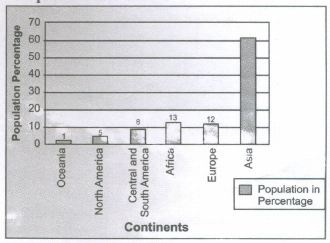
(i) Which continent has the lowest share of population
(ii) Which continent has about 12% of the world population?
(iii) Which two continents have the greatest percentage of population?
(iv) Which two continents have the lowest share of population?
(v) How much percentage of the world's population does Asia support alone?
2.
Study the given population pyramid and answer the following questions:
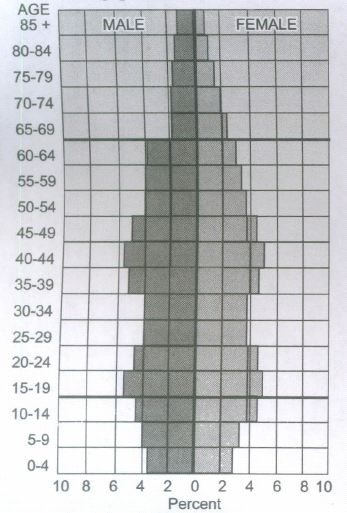
(i) What does the narrow base of the pyramid indicate?
(ii) Looking at the pyramid, the life expectancy of the people seems to be low or high?
(iii) The pyramid extends well beyond 75 years of age. What does it say about the death rate of the country?
(iv) What does the broad middle of the pyramid indicate about the working age of the people of the country?
(v) Name a country the population trend of which matches the population pyramid given here.
3.
Briefly explain the density of population in India
4.
Briefly explain the age, structure and composition of the population of India.
5.
Which are the geographical factors affecting the distribution of population?
6.
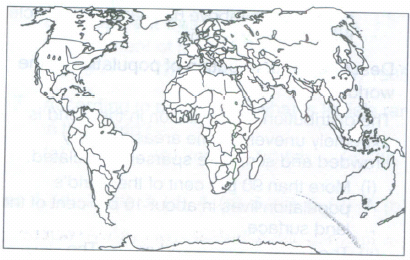
Look at the given figure and find out of these countries how many are in Asia? Locate them on a world map
7.
Describe the distribution of population in the world.
8.
What are the bad effects of population explosion on society? How does population pyramid help in understanding the population of the country?
9.
What is the pattern of population distribution? Is population evenly distributed? How?
10.
Explain the social, cultural and economic impact on population distribution.
1.
(i) Oceania has the lowest share of population
(ii) Europe has about 12%of the world population.
(iii) Asia and Africa have the greatest percentage of population.
(iv) Oceania and North America are the two continents that have the lowest share of population.
(v) Asia alone supports about 61% of the world's population.
2.
(i) The narrow base of the pyramid indicates a low birth rate.
(ii) The pyramid extends well into the BOs, which shows that the life expectancy of the people is pretty high.
(iii) The pyramid's top extends far up showing that the death rate of the featured country is low.
(iv) The broad middle of the pyramid shows that the working age people of the country are abundant, leading to economic development.
(v) The population pyramid matches the population trends of Japan, which has a low birth rate and a low death rate. The life expectancy of the country is high with a good number of working aged people who contribute to the economic growth of the country.
3.
(i) The number of people living in one unit area of the surface area is called population density. The average density of population in the world is 45 persons per sq. km.
(ii) India is one of the most densely populated countries of the world. The average density of population in India is 324 persons per sq. km. according to 2001 census.
(iii) One of the major facts regarding population density in India is that it has been consistently increasing over the years. In 1901,India's population density was only 77 and it increased to 117 in 1951 and finally it has reached 324 in 2001.
(iv) In terms of density, there is great variation among the different states in India. Union Territories of Delhi and Chandigarh have the density of 9300and 7900persons per square kilometers respectively.
(v) Whereas, the density in Arunachal Pradesh and Mizoram is 13 and 43 person per square kilo-meter respectively.
4.
Basically, the population can be divided into three age groups:
(i) 0-14years
(ii) 15-64years
(iii) 65 years and above
1. In these age groups, the 15-64 years age group is considered as working age group and the other two age groups, i.e. 0-14 years and 65+ years are known as dependent age groups or non-working age groups.
2. So, about 61% of the Indian population lies among the working class, but about 39%of the population lies in the dependent age groups and this is a very high percentage. If we compare the age composition of Indian population with other countries, then the scenario will become clearer at global level. At global level, the percentage of working class in India is higher than the low income countries, but it is less than the percentage of working class in the middle and high income countries. Thus, it can be said that India falls between low and middle income country categories at global level. So, government has to make efforts to provide health and education facilities to younger section of the population and also to make arrangements to train people who have reached the working age group.
5.
The geographical factors affecting the distribution of population are:
(i) Topography: People generally prefer living on plains rather than on mountains or plateaus, as these areas are suitable for farming and other similar activities.
(ii) Soil: People prefer to live in areas with fertile soil as it supports agriculture
(iii) Climate: People avoid extreme climates
(iv) Water: People prefer living in the areas where fresh water is easily available.
(v) Minerals : People are attracted towards the areas rich in mineral deposits.
6.
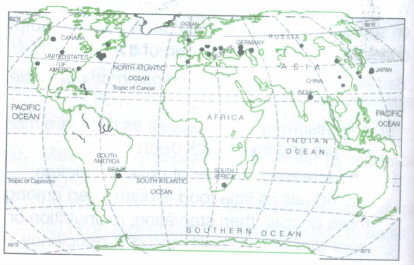
The Countries in Asia are China, India, Indonesia, Pakistan, Bangladesh and Japan
7.
The distribution of population in the world is extremely uneven. Some areas are very
crowded and some are sparsely populated.
(i) More than 90 per cent of the world's population lives in about 10 per cent of the land surface.
(ii) The densely populated areas- The crowded areas are South and South-East
Asia, Europe and North-Eastern North America.
(iii) The sparsely populated areas-Very few people live in high latitude areas, tropical
deserts, high mountains and areas of equatorial forests.
(iv) Almost three-quarters of the world's people live in two continents, Asia and Africa.
(v) Sixty per cent of the uneven distribution of people stay in just 10 countries. All of them have more than 100 million people.
8.
Bad effects of population explosion on our society are:
(i) A pressure upon resources as there are more people and their quick depletion.
(ii) An increased number of poverty-stricken individuals as little food is distributed among more people, then starvation. malnutrition or poor diet with ill health and diet-deficiency diseases would increase.
(iii) Loss of natural environment (forests and such) and loss of ecosystems because they are destroyed to make way for farming and urban developments to accommodate the rising population.
(iv) Irreversible loss of arable land and increase in desertification.
Population pyramid is also called the age-sex pyramid. Population pyramid shows:
(i) The total population which is divided into various age groups. For example 5 to 9 years, 10 to 14 years.
(ii) The percentage of the total population, subdivided into males and females, in each of those groups.
(iii) The numbers of children (below 15 years) are shown at the bottom and reflect the level of births.
(iv) The size of the top shows the numbers of aged people (above 65 years) and reflects the number of deaths.
9.
(i) The way in which the people are spread across the world's surface is called pattern of population distribution.
(ii) Population is very unevenly distributed as 90% of the world's population lives on just 10%of the land surface. Many more people live in the northern hemisphere than in the southern hemisphere, and very few people live in high altitude areas, tropical deserts, high mountains and areas of equatorial forests.The most crowded areas are south and south east Asia,Europe and north eastern North America. Almost 3/4th of the world's population lives in the Asian and African continent. Thus, we see that the population distribution is highly uneven.
10.
Social factors: Areas with better housing, education and health facilities are more populated than others.
Cultural factors: Places with cultural and religious importance attract more people than others.
Economic factors: Industrial areas are more populated as they provide employment opportunities.

8th Standard CBSE Syllabus & Materials
8th Standard CBSE
CBSE 8th Science Particulate Nature of Matter - New Model Questions Papers Study Material - QB365 Set A
NEW8th Standard CBSE
CBSE 8th Science Pressure, Winds, Stroms and Cyclones - New Model Questions Papers Study Material - QB365 Set A
NEW8th Standard CBSE
CBSE 8th Mathematics Quadrilaterals - New Model Questions Papers Study Material - QB365 Set A
NEW8th Standard CBSE
CBSE 8th Mathematics A story of Numbers - New Model Questions Papers Study Material - QB365 Set A



NCERT Books

Syllabus

Exam Pattern

Sample Question Papers

Previous year Question Papers

Important Notes

MCQ Practice test

NCERT Exemplers

Case study Questions

Image Based Questions

Passage based Questions

HOT Questions

Value Based Questions

Model Questions Papers
NCERT ( Book Back ) Questions

Assertion and Reason
Important Questions And Answers

CBSE 8th Standard CBSE Subjects
CBSE Standards


