
 100% FREE ACCESS
6th Standard CBSE Syllabus & Materials
6th Standard CBSE
CBSE 6th Social Science The Value of Work - New Sample Question Papers Study Material - QB365 Set A
NEW6th Standard CBSE
CBSE 6th Social Science Family and Community - New Sample Question Papers Study Material - QB365 Set A
NEW6th Standard CBSE
CBSE 6th Social Science India's Cultural Roots - New Sample Question Papers Study Material - QB365 Set A
NEW6th Standard CBSE
CBSE 6th Social Science India,That is Bharat - New Sample Question Papers Study Material - QB365 Set A
NEW6th Standard CBSE
CBSE 6th Social Science Timeline and sources of history - New Sample Question Papers Study Material - QB365 Set A
NEW6th Standard CBSE
CBSE 6th Social Science Oceans and Continents - New Sample Question Papers Study Material - QB365 Set A

Published on: 31/07/2018
Based on the chapter Data Handling, some of the important questions are covered in this question paper.
Download CBSE Class 6th Standard CBSE Mathematics question papers, sample papers, important questions, and previous year solved papers in PDF format. Get free study materials, NCERT solutions, and exam preparation resources for Class 6th Standard CBSE Mathematics
Questions + Answers key
Take MCQ Mathematics Test
1.
Read the following bar graph and answer the questions given below.
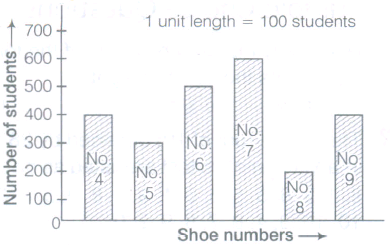
(i) What does this bar graph represent?
(ii) Mention the different number of shoes worn by the students.
(iii) Which shoe number is worn by maximum number of students?
(iv) Which shoe number is worn by minimum number of students?
(v) How many students worn shoe number 9?
(vi) Find total number of students in the school.
2.
The sale of electric bulbs on different days of a week is shown below
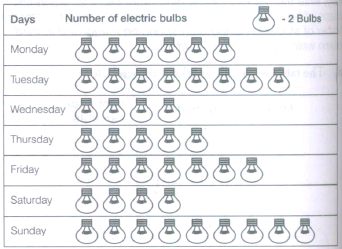
Observe the pictograph and answer the following questions.
(a) How many bulbs were sold on Friday?
(b) On which day, were the maximum number of bulbs sold?
(c) On which of the days, same number of bulbs were sold?
(d) On which of the days, minimum number of bulbs were sold?
(e) If one big carton can hold 9 bulbs. How many cartons were needed in the given week?
3.
Thirty students were interviewed to find out who they want to be in future. Their responses are listed as below:
doctor, engineer, doctor, pilot, officer, doctor, engineer, doctor, pilot, officer, pilot, engineer, officer, pilot, doctor, engineer, pilot, officer, doctor, officer, doctor, pilot, engineer, doctor, pilot, officer, doctor, pilot, doctor, engineer.
Arrange the data in a table using tally marks.
4.
The blood groups of 25 students are recorded as follows:
A, B, 0, A, AB, 0, A, 0, B, A, O, B, A, AB, AB, A, A, B, B, O, B, AB, O, A, B.
Arrange the information in a table using tally marks.
5.
Observe this bar graph, which is showing the sale of shirts in a ready-made shop from Monday to Saturday.
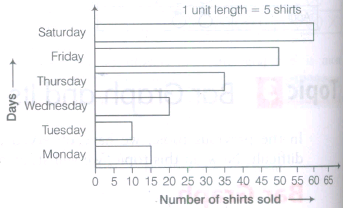
Now, answer the following questions.
(a) What information does the above bar graph give?
(b) What is the scale chosen on the horizontal line representing number of shirts?
(c) On which day, were the maximum number of shirts sold? How many shirts were sold on that day?
(d) On which day, were the minimum number of shirts sold?
(e) How many shirts were sold on Thursday?
6.
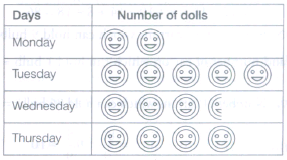
A factory made 200 dolls on Monday, 500 dolls on Tuesday, 350 dolls on Wednesday and 400 dolls on Thursday. Represent the information in the form of pictograph.
7.
The following are the weight in kg of 20 students of a class 25, 16, 17, 15, 23, 10, 9, 15, 16, 17, 15, 16, 23, 25, 16, 15, 23, 9, 10, 16
Prepare a frequency distribution table for the given data.
8.
What type of data is collected from newspaper?
9.
Find the range of data 9, 7, 2, 6, 1, 3, 4, 12.
10.
What is the range of data?
11.
What is data?
12.
How many values in bar graph is represented by each bar.
13.
The choices of the fruits of 42 students in a class are as follows.
A, O, B, M, A, G, B, G, A, G, B, M, A, G, M, A, B, G, M, B, A, O, M, O, G, B, O, M, G, A, A, B, M, O, M, G, B, A, M, O, M, O
Where A, B, G, M and O stand for the fruits Apple, Banana, Grapes, Mango and Orange respectively. Which fruit is liked by most of the students?
O
G
M
A
14.
The marks obtained by 10 students in Science test are given below:
53, 36, 95, 73, 62, 42, 25, 78, 75, 62
Answer the following questions that are related to the given data.
How many students got marks below 62?
3
4
5
2
15.
The marks obtained by 10 students in Science test are given below:
53, 36, 95, 73, 62, 42, 25, 78, 75, 62
Answer the following questions that are related to the given data.
How many students got the same marks?
3
4
2
None of these
16.
The marks obtained by 10 students in Science test are given below:
53, 36, 95, 73, 62, 42, 25, 78, 75, 62
Answer the following questions that are related to the given data.
The maximum marks obtained by any student is
60
95
78
25
17.
Using tally marks, which one of the following represents the number eight?
IIII II
.png)
.png)
.png)
18.
In a pictograph, if a symbol * represents 20 flowers in a basket, then *** stands for _________ flowers.
19.
In a bar graph, bars of __________ width can be drawn horizontally or vertically with ________ spacing between them.
20.
Representation of data in form of pictures is called ___________.
21.
A _____________ represents data through pictures of objects.
22.
A _________ is a collection of numbers gathered to give some meaningful information.
23.
In a bar graph, the gap between two consecutive bars may not be the same.
24.
In a bar graph, each bar (rectangle) represents only one value of the numerical data.
25.
In a bar graph, the width of bars may be unequal.
26.
In a pictograph, if a symbol \(\boxtimes\) represents 50 books in a library shelf, then the symbol .png) represents 25 books.
represents 25 books.
27.
Pictographs and bar graphs are pictorial representations of the numerical data.
1.
(i) This bar graph represents the shoes worn by the students of different numbers.
(ii) Different number of shoes worn by the students are 4, 5, 6, 7, 8 and 9.
(iii) Shoe number 7 is worn by maximum number of students.
(iv) Shoe number 8 is worn by minimum number of students.
(v) 400 students worn shoe number 9.
(vi) Total number of students in the school
= 400 + 300 + 500 + 600 + 200 + 400 = 2400.
2.
In the given pictograph, 1 picture = 2 bulbs
Now, number of bulbs sold on Monday = 6 pictures
= 6 x 2 = 12bulbs
Number of bulbs sold on Tuesday = 8 x 2 = 16 bulbs
Number of bulbs sold on Wednesday = 4 x 2 = 8 bulbs
Number of bulbs sold on Thursday = 5 x 2 = 10 bulbs
Number of bulbs sold on Friday = 7 x 2 = 14 bulbs
Number of bulbs sold on Saturday = 4 x 2 = 8 bulbs
Number of bulbs sold on Sunday = 9 x 2 = 18 bulbs
(a) Number of bulbs sold on Friday = 7 x 2 = 14 bulbs
(b) Maximum number of bulbs were sold on Sunday i.e. 18 bulbs.
(c) The same number of bulbs were sold on Wednesday and Saturday i.e. 8 bulbs.
(d) The minimum number of bulbs were sold on Wednesday and Saturday i.e. 8 bulbs.
(e) Total number of bulbs sold in a week
= 12 + 16 + 8 + 10 + 14 + 8 + 18 = 86
Now, number of cartons which can hold 9 bulbs = 1 and number of carton which can hold 1 bulb = \(\frac{1}{9}\)
\(\therefore\) Number of cartons which can hold 86 bulbs = \(\frac{1\times 86}{9}\)
= \(\frac{86}{9}=9\frac{5}{9}=10\)
Hence, 10 cartons were needed in the given week.
3.
We draw the following table using tally marks for given information.
| Responses | Tally marks | Number of responses |
| Doctor | |
10 |
| Engineer | .png) |
6 |
| Pilot | |
8 |
| Officer | |
6 |
4.
| Blood group | Tally marks | Number of students |
| A | |
8 |
| B | .png) |
7 |
| O | |
6 |
| AB | I I I I | 4 |
5.
(a) Given bar graph shows the number of shirts sold from Monday to Saturday.
(b) Scale on horizontal line is 1 unit = 5 shirts.
(c) From given bar graph, it is clear that maximum number of shirts sold is shown by the largest bar (i.e.or Saturday). Hence, on Saturday 60 shirts were sold.
(d) From given bar graph, it is clear that smallest bar shows the minimum number of sold shirts (i.e. on Tuesday).
Hence, the minimum number of shirts were sold on Tuesday.
(e) From given bar graph, it is clear that on Thursday 35 shirts were sold.
6.
Here, given production of dolls. Monday - 200, Tuesday - 500 Wednesday - 350, Thursday - 400
Let us assume that
100 may be represented by .png)
50 may be represented by .png)
Thus, the pictograph would be
7.
| Weight of students | Tally marks | Number of students |
| 9 | I I | 2 |
| 10 | I I | 2 |
| 15 | I I I I | 4 |
| 16 | I I I I | 5 |
| 17 | I I | 2 |
| 23 | I I I | 3 |
| 25 | I I | 2 |
8.
Secondary data is collected from newspaper.
9.
Range of data = 12 - 1 = 11.
10.
The difference of maximum and minimum value of given data is called the range of data.
11.
Information in raw or unorganised form (such as alphabets. numbers or symbols) that refer to, or represent conditions, ideas or objects.
12.
One
13.
(c)
M
14.
(b)
4
15.
(c)
2
16.
(b)
95
17.
(d)
18.
()
60
19.
()
Uniform, equal
20.
()
Pictograph
21.
()
Pictograph
22.
()
data
23.
(b)
24.
(a)
25.
(b)
26.
(a)
27.
(a)

6th Standard CBSE Syllabus & Materials
6th Standard CBSE
CBSE 6th Social Science Locating Places on the Earth - New Sample Question Papers Study Material - QB365 Set A
NEW6th Standard CBSE
CBSE 6th Science A Journey Through States of Water - New Sample Question Papers Study Material - QB365 Set A
NEW6th Standard CBSE
CBSE 6th Science Temperature and its Measurement - New Sample Question Papers Study Material - QB365 Set A
NEW6th Standard CBSE
CBSE 6th Science Materials Around Us - New Sample Question Papers Study Material - QB365 Set A



CBSE 6th Standard CBSE Subjects
CBSE Standards




