
 100% FREE ACCESS
8th Standard CBSE Syllabus & Materials
8th Standard CBSE
CBSE 8th Social Science Theme D - Factors of Production - New Model Questions Papers Study Material - QB365 Set A
NEW8th Standard CBSE
CBSE 8th Social Science Theme C - Universal Franchise and India's Electoral System - New Model Questions Papers Study Material - QB365 Set A
NEW8th Standard CBSE
CBSE 8th Social Science Theme B - The Rise of the Marathas - New Model Questions Papers Study Material - QB365 Set A
NEW8th Standard CBSE
CBSE 8th Social Science Theme B - Reshaping India's Political Map - New Model Questions Papers Study Material - QB365 Set A
NEW8th Standard CBSE
CBSE 8th Social Science Theme A - Natural Resources and Their Use - New Model Questions Papers Study Material - QB365 Set A
NEW8th Standard CBSE
CBSE 8th Science Keeping Time with Skies - New Model Questions Papers Study Material - QB365 Set A

Published on: 30/07/2018
In Data Handling contains important questions in CBSE 8th Standard Mathematics. It also covered with the most important questions in Data Handling.
Teachers please subscribe Now and Create Unlimited 8th Standard Mathematics question papers with answer keys. For subscription, please Click Here.
Download CBSE Class 8th Standard CBSE Mathematics question papers, sample papers, important questions, and previous year solved papers in PDF format. Get free study materials, NCERT solutions, and exam preparation resources for Class 8th Standard CBSE Mathematics
Questions + Answers key
Take MCQ Mathematics Test
1.
The marks obtained (out of 20) by 30 students of a class in a test are as follows:
14, 16, 15, 11, 15, 14, 13, 16, 8, 10, 7, 11, 18, 15, 14, 19, 20, 7, 10, 13, 12, 14, 15, 13, 16, 17, 14, 11, 10, 20
Prepare a frequency distribution table for the above data using class intervals of equal width in which one class interval is 4-8 (excluding 8 and including 4).
2.
Draw a pie chart of the data given below:
The time spent by a child during a day.
| Sleep | 8h |
| School | 6h |
| Home work | 4h |
| Play | 4h |
| Others | 2h |
3.
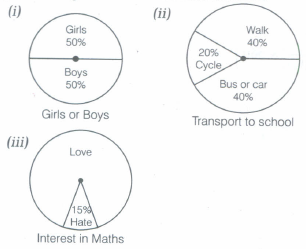
Each of the following pie charts (see the following figures), gives you a different piece of information about your class. Find the fraction of the circle representing each of these information.
4.
If we change the position of any of the bars of a bar graph, would it change the information being conveyed? Why?
5.
Read the following bar graph and answer the following questions.
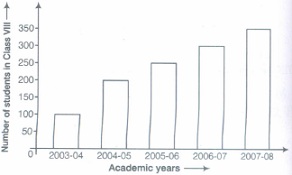
(i) What is the information given by the bar graph?
(ii) In which year is the increase in the number of students maximum?
(iii) In which year is the number of students maximum?
(iv) State whether true of false:
'The number of students during 2005 - 06 is twice that of 2003 - 04.'
6.
If 400 students voted in all, then how many did vote 'others' colour as their favourite?
7.
From a pack of well-shuffled cards, what is the probability of getting an ordinary card?
8.
Choice of food for a group of people.
| Favourite food | Number of people |
| North Indian | 30 |
| South Indian | 40 |
| Chinese | 25 |
| Others | 25 |
| Total | 120 |
9.
The earning of 50 shops on a particular day are as follows (the figures have been estimated to the nearest hundreds):
| Earning (in Rs) | 800 | 1300 | 1700 | 2300 | 2800 | 3200 | 3400 |
| Number of shops | 7 | 9 | 2 | 5 | 17 | 7 | 4 |
Prepare a grouped frequency distribution table taking class interval of equal size, one such interval being 1500 - 2000.
10.
A die was thrown 28 times and following scores were obtained:
3, 2, 3, 6, 1, 5, 2, 6, 3, 5, 4, 1, 6, 1, 4, 2, 5, 1, 5, 2, 4, 3, 2, 3, 3, 6, 4, 1
Prepare the frequency table for the scores.
11.
A coin is tossed 12 times and the outcomes are observed as shown below:
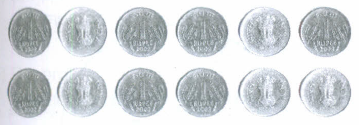
The chance of occurrence of head is
\(\frac{1}{2}\)
\(\frac{5}{12}\)
\(\frac{7}{12}\)
\(\frac{5}{7}\)
12.
Rahul, Varun and Yash are playing a game of spinning a coloured wheel. Rahul wins if spinner lands on red. Varun wins, if spinner lands on blue and Yash wins, if it lands on green. Which of the following spinner should be used to make the game fair?
.png)
.png)
.png)
.png)
13.
A graph showing two sets of data simultaneously is called a
double bar graph
pie chart
histogram
pictograph
14.
Monthly salary of a person is Rs 45000. The central angle of the sector representing his expenses on food and house rent on a pie chart is 60°. The amount he spends on food and house rent is
Rs 7500
Rs 4500
Rs 2500
Rs 6000
15.
The length of a rectangle in a histogram shows the
width of the class
lower limit of the class
upper limit of the class
frequency of the class
16.
In a histogram, class intervals and frequencies are taken along _______ axis and ________ axis respectively.
17.
Histogram bars are drawn with equal ___________ to a class interval without leaving any gap in between.
18.
The class size of the interval 28 - 32 is ____________.
19.
In a __________ experiment, the outcomes can not be predicted exactly in advance.
20.
_________ is used to compare parts to a whole.
21.
The frequency of less than 18 marks is 20.
22.
11 students got full marks.
23.
The probability of getting a number 6 in a throw of a die is \(\frac{1}{6}\) Similarly, the probability of getting a number 4 is \(\frac{1}{4}\)
24.
The central angle of a sector in a pie chart cannot be more than 180o.
25.
In the class intervals 10 - 20, 20 - 30, etc .... respectively, 20 lies in the class interval 10 - 20.
26.
The following pie chart represents the proposed outlay of the 5 yr plan of Rs 40000 crore. Examine the following pie chart and answer the question that follows.
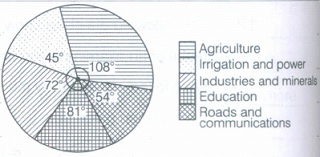
(a) How much amount proposed on agriculture is more than that on industries and minerals in measure?
(b) How much amount (in Rs crore) proposed on irrigation and power is less than that on industries and minerals?
27.
A die is thrown, what is the probability of getting a number less than 3?
1.
| Class interval | Tally marks | Frequency |
| 4 - 8 | II | 2 |
| 8 - 12 | III II | 7 |
| 12 - 16 | III III III | 13 |
| 16 - 20 | III I | 6 |
| 20 - 24 | II | 2 |
| Total | 30 |
2.
We know that total angle at the centre of a circle is 360°.
Fraction part for sleep = \(\frac{Hours\ for\ sleep}{Total\ hours}=\frac{8}{24}=\frac{1}{3}\)
\(\therefore\) Central angle of sector for sleep = \(\frac{1}{3}\times 360^o =120^o\)
Similarly, for other central angles, we get the following table:
First, we find the central angle corresponding to given activities
| Activities | Hours | Fraction parts | Central angles |
| Sleep | 8 | \(\frac{8}{24}=\frac{1}{3}\) | \(\frac{1}{3}\times 360^o=120^o\) |
| School | 6 | \(\frac{6}{24}=\frac{1}{4}\) | \(\frac{1}{4}\times 360^o=90^o\) |
| Homework | 4 | \(\frac{4}{24}=\frac{1}{6}\) | \(\frac{1}{6}\times 360^o=60^o\) |
| Play | 4 | \(\frac{4}{24}=\frac{1}{6}\) | \(\frac{1}{6}\times 360^o=60^o\) |
| Others | 2 | \(\frac{2}{24}=\frac{1}{12}\) | \(\frac{1}{12}\times 360^o=30^o\) |
Now, draw a circle and divide it into sectors with corresponding central angle, we get the required pie chart given below:
.png)
3.
(i) Here, given pie chart shows 100% students of your class, out of which 50% are girls and 50% are boys.
\(\therefore\) Fraction of the circle representing girls = \(\frac{Percentage\ of\ girls}{Percentage\ of\ all\ students}=\frac{50}{100}=\frac{1}{2}\)
[dividing numerator and denominator by 50]
Fraction of the circle representing boys = \(\frac{Percentage\ of\ boys}{Percentage\ of\ all\ students}=\frac{50}{100}=\frac{1}{2}\)
[dividing numerator and denominator by 50]
(ii) Here, given pie chart shows 100% transport to school.
So, Fraction of the circle representing walk = \(\frac{Percentage\ of\ walk}{Total\ Percentage\ of\ transport}=\frac{40}{100}=\frac{2}{5}\)
[dividing numerator and denominator by 20]
Fraction of the circle representing bus or car = \(\frac{Percentage\ of\ cars}{Total\ Percentage\ of\ transport}=\frac{40}{100}=\frac{2}{5}\)
[dividing numerator and denominator by 20]
Fraction of the circle representing cycle = \(\frac{Percentage\ of\ cycle}{Total\ Percentage\ of\ transport}=\frac{20}{100}=\frac{1}{5}\)
[dividing numerator and denominator by 20]
4.
No, because bar heights give the quantity for each category. Since the height remains unchanged. So, the information conveyed regarding the quantity remain unchanged.
5.
From the given bar graph, we find that,
i) The information given by the bar graph is the number of students in Class VIII in various academic years in the school.
(ii)In the year 2004-05, increase in the number of students is maximum.
(iii) The number of students is maximum in the year 2007 - 08.
(iv) False, because the number of students during 2005-06 is more than twice that of 2003-04.
6.
48
7.
In a pack of well-shuffled cards, there are
number of black face cards = 6; number of red jack = 2;
number of red card of ace = 2; number of black kings = 2 ;
number of ordinary card = 52
whereas, in a pack, there are total 52 cards.
\(\therefore\) Probability of getting
an ordinary card = \(\frac{52}{52}=1\)
8.
To display choice of food for a group of people, bar graph is more appropriate.
9.
Frequency distribution table
| Earnings (in Rs) | Number of shops |
| 500 - 1000 | 7 |
| 1000 - 1500 | 9 |
| 1500 - 2000 | 2 |
| 2000 - 2500 | 5 |
| 2500 - 3000 | 17 |
| 3000 - 3500 | 11 |
10.
| Scores | Number of times |
| 1 | 5 |
| 2 | 5 |
| 3 | 6 |
| 4 | 4 |
| 5 | 4 |
| 6 | 4 |
11.
(b)
\(\frac{5}{12}\)
12.
(d)
13.
(a)
double bar graph
14.
(a)
Rs 7500
15.
(d)
frequency of the class
16.
Class interval are taken along X-axis and frequencies are taken along Y-axis in a histogram.
17.
In a histogram, each class interval has equal width and there is no gap in between the bars.
18.
Upper limit - Lower limit = 32 - 28 = 4
19.
()
Random
20.
With a pie chart, we can compare parts to a whole.
21.
(b)
22.
(a)
23.
(b)
24.
(b)
25.
(b)
26.
(a) Rs 4000 crore
(b) Rs 3000 crore.
27.
\(\frac{1}{3}\)

8th Standard CBSE Syllabus & Materials
8th Standard CBSE
CBSE 8th Science Particulate Nature of Matter - New Model Questions Papers Study Material - QB365 Set A
NEW8th Standard CBSE
CBSE 8th Science Pressure, Winds, Stroms and Cyclones - New Model Questions Papers Study Material - QB365 Set A
NEW8th Standard CBSE
CBSE 8th Mathematics Quadrilaterals - New Model Questions Papers Study Material - QB365 Set A
NEW8th Standard CBSE
CBSE 8th Mathematics A story of Numbers - New Model Questions Papers Study Material - QB365 Set A



CBSE 8th Standard CBSE Subjects
CBSE Standards




