
 100% FREE ACCESS
12th Standard Syllabus & Materials
12th Standard
TN 12th Maths Applications of Matrices and Determinants Sample Question Papers Study Material - QB365 Set A
NEW12th Standard
TN 12th Computer Applications மின்னணு தரவு பரிமாற்றம் Sample Question Papers Study Material - QB365 Set A
NEW12th Standard
TN 12th Computer Applications மின் - வணிக பாதுகாப்பு அமைப்புகள் Sample Question Papers Study Material - QB365 Set A
NEW12th Standard
TN 12th Computer Applications மின்னணு செலுத்தல் முறைகள் Sample Question Papers Study Material - QB365 Set A
NEW12th Standard
TN 12th Computer Applications மின் - வணிகம் Sample Question Papers Study Material - QB365 Set A
NEW12th Standard
TN 12th Computer Applications திறந்த மூல கருத்துருக்கள் Sample Question Papers Study Material - QB365 Set A

Published on: 22/08/2026
Download Tamil Nadu 12th Standard Business Maths and Statistics question papers, model tests, one-mark questions, important questions, and public exam papers in PDF format. Free study materials and answer keys for TN State Board students.
Questions + Answers key
Take MCQ Business Maths and Statistics Test
1.
If f (x) = eax then show that f(0), Δf(0), Δ2f(0) are in G.P
2.
What is the difference between Assignment Problem and Transportation Problem?
3.
Write mathematical form of transportation problem.
4.
Define true value ratio.
5.
State the two normal equations used in fitting a straight line.
6.
Define secular trend.
7.
If h = 1 then prove that (E−1Δ)x3 = 3x2 − 3x + 1.
8.
A farmer wants to decide which of the three crops he should plant on his 100-acre farm. The profit from each is dependent on the rainfall during the growing season. The farmer has categorized the amount of rainfall as high medium and low. His estimated profit for each is shown in the table.
| Rainfall | Estimated Conditional Profit(Rs.) | ||
| crop A | crop B | crop C | |
| High | 8000 | 3500 | 5000 |
| Medium | 4500 | 4500 | 5000 |
| Low | 2000 | 5000 | 4000 |
If the farmer wishes to plant only crop, decide which should be his best crop using
(i) Maximin
(ii) Minimax
9.
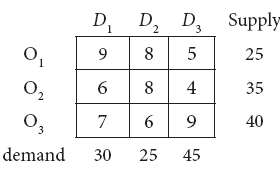
Obtain an initial basic feasible solution to the following transportation problem by using least- cost method.
10.
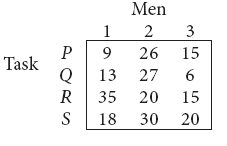
Solve the following assignment problem.
11.
Construct the cost of living Index number for 2015 on the basis of 2012 from the following data using family budget method.
| Commodity | Price | Weight | |
| 2012 | 2015 | ||
| Rice | 250 | 280 | 10 |
| Wheat | 70 | 280 | 5 |
| Corn | 150 | 170 | 6 |
| Oil | 25 | 35 | 4 |
| Dhal | 85 | 90 | 3 |
12.
The following figures relates to the profits of a commercial concern for 8 years
| Year | 1986 | 1987 | 1988 | 1989 | 1990 | 1991 | 1992 | 1993 |
| Profit (Rs.) | 15,420 | 15,470 | 15,520 | 21,020 | 26,500 | 31,950 | 35,600 | 34,900 |
Find the trend of profits by the method of three yearly moving averages.
13.
Find the missing figures in the following table
| x | 0 | 5 | 10 | 15 | 20 | 25 |
| y | 7 | 11 | - | 18 | - | 32 |
14.
Find f(2.8) from the following table.
| x | 0 | 1 | 2 | 3 |
| f(x) | 1 | 2 | 11 | 34 |
15.
Using Newton’s forward interpolation formula find the cubic polynomial.
| x | 0 | 1 | 2 | 3 |
| f(x) | 1 | 2 | 1 | 10 |
16.
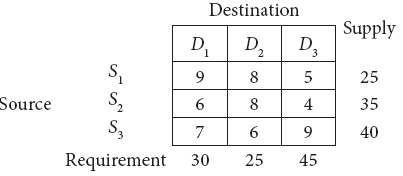
Determine an initial basic feasible solution to the following transportation problem by using North West Corner rule
17.
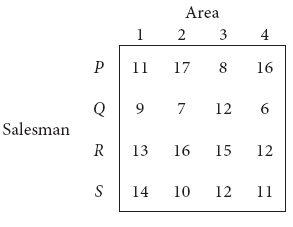
Find the optimal solution for the assignment problem with the following cost matrix.
18.
Ten samples each of size five are drawn at regular intervals from a manufacturing process. The sample means ( \(\overset{-}{X}\) ) and their ranges (R ) are given below:
| Sample number | 1 | 2 | 3 | 4 | 5 | 6 | 7 | 8 | 9 | 10 |
| \(\overset {-}{X}\) | 49 | 45 | 48 | 53 | 39 | 47 | 46 | 39 | 51 | 45 |
| R | 7 | 5 | 7 | 9 | 5 | 8 | 8 | 6 | 7 | 6 |
Calculate the control limits in respect of \(\overset {-}{X}\) chart. (Given A2 = 0.58, D3 = and D4 = 2.115) Comment on the state of control.
19.
Using the following data, construct Fisher’s Ideal index and show how it satisfies Factor Reversal Test and Time Reversal Test?
| Commodity | Price in Rupees per unit | Number of units | ||
| Base year | Current year | Base year | Current year | |
| A | 6 | 10 | 50 | 56 |
| B | 2 | 2 | 100 | 120 |
| C | 4 | 6 | 60 | 60 |
| D | 10 | 12 | 50 | 24 |
| E | 8 | 12 | 40 | 36 |
20.
The following table shows the number of salesmen working for a certain concern:
| Year | 1992 | 1993 | 1994 | 1995 | 1996 |
| No. of salesmen | 46 | 48 | 42 | 56 | 52 |
Use the method of least squares to fit a straight line and estimate the number of salesmen in 1997.
21.
If c is a constant, then Δc.f(x) ______________
0
c.f(Δx)
c.Δf(x)
f(Δcx)
22.
If f (x)=x2 + 2x + 2 and the interval of differencing is unity then Δf (x) _______.
2x −3
2x +3
x + 3
x − 3
23.
If ‘n’ is a positive integer Δn[ Δ-n f(x)] _______.
f(2x)
f(x+ h)
f (x)
Δf(x)
24.
If h = 1, then Δ(x2) = _______.
2x
2x −1
2x +1
1
25.
The purpose of a dummy row or column in an assignment problem is to _______.
prevent a solution from becoming degenerate
balance between total activities and total resources
provide a means of representing a dummy problem
none of the above
26.
In a degenerate solution number of allocations is _______.
equal to m+n–1
not equal to m+n–1
less than m+n–1
greather than m+n–1
27.
A typical control charts consists of ________.
CL, UCL
CL, LCL
CL, LCL, UCL
UCL, LCL
28.
How many causes of variation will affect the quality of a product?
4
3
2
1
29.
Cost of living at two different cities can be compared with the help of ________.
Consumer price index
Value index
Volume index
Un-weighted index
30.
Factors responsible for seasonal variations are ________.
Weather
Festivals
Social customs
All the above
1.
Given f(x) = eax
∴ f(0) = e0x = 1 (1)
Δf(x) = f(x + h) - f(x) (2)
Δf(0) = f(1) - f(0) = ea(1) - e0 = ea-1 (2)
Δ2f(0) = Δ [Δf(0)]
= Δ[f(1) + f(0)] = Δf(1) - f(1) - Δ(0)
= f(2) - f(1) - (ea - 1)
= e2a - ea - ea + 1
Δ2f(0) = e2a- 2ea + 1
From (1), (2) & (3), the three terms are 1, ea - 1, e2a -2ea+1
⇒ 1, ea -1, (ea - 1)2 [∵ (a - b)2 = a2 - 2ab + b2]
Common ratio r = \(\frac { { e }^{ a }-1 }{ 1 } =\frac { ({ { e }^{ a }-a) }^{ 2 } }{ { e }^{ a }-1 } \) = ea - 1
Since the common ratio is same throughout Δf(0) and Δ2f(0) forms a G.P.
2.
The assignment problem is a special case of transportation problem where the number of sources and destinations are equal. Here, jobs represent sources and machines represent destinations.
3.
The objective function is minimize Z = \(\overset { m }{ \underset { i=1 }{ \Sigma } } \overset { n }{ \underset { j=1 }{ \Sigma } } { { C }_{ ij } }{ x }_{ ij }\) subject to the constraints
\(\overset { n }{ \underset { j=1 }{ \Sigma } }{ x }_{ ij } = a_i, i=1,2,.....m\) (Supply constraints)
\(\overset { m }{ \underset { i=1 }{ \Sigma } }{ x }_{ ij } = b_j, j=1,2,.....n\) (demand constraints)
xij ≥, 0 for all i, j (non-negative restrictions)
4.
The ratio between the total value of current period and total value of the base period is known as true value ratio.
(\( \frac{\sum P_{1} q_{1}}{\sum p_{0} q_{0}}\) is a true value tario)
5.
The two normal equations are
\(\sum\) Y = n a + b \(\sum\) X
\(\sum\) XY = a \(\sum\) X + b \(\sum\)X2 where n is the number of years given in the data.
6.
It is a general tendency of time series to increase or decrease or stagnates during a long period of time. An upward tendency is usually observed in population of a country, production, sales, prices in industries, income of individuals etc., A downward tendency is observed in deaths,epidemics, prices of electronic gadgets, water sources, mortality rate etc. It is not necessarily that the increase or decrease should be in the same direction throughout the given period of time. This feature is known as secular trend.
7.
Given h = 1
LHS = (E−1Δ) x3
= Δ(E-1(x3))
= Δ(x - h)3 [∵ E-1f(x) = f(x - nh)]
= Δ(1 - h)3 [∵ h = 1]
= (x - 1+ 1)3 - (x - 1)3 [∵ Δf(x) =f(x + h) - f(x)]
= x3 - (x - 1)3
= x3 - (x3 - 3x2 + 3x - 1)
[∵ (a - b)3 = a3 - 3a2b + 3ab2 - b3]
= x3 - x3 + 3x2 - 3x + 1
= 3x2 - 3x + 1
= RHS
Hence proved
8.
| Estimated Conditional Profit 0 | |||||
| Rainfall | High | Medium | Low | Minimum payoff | Maximum payoff |
| Crop A | 8000 | 4500 | 2000 | 2000 | 8000 |
| Crop B | 3500 | 4500 | 5000 | 3500 | 5000 |
| Crop C | 5000 | 5000 | 4000 | 4000 | 5000 |
(i) Max (2000,3500,4000) = 4000
∴ Crop C is the best according to maximin criteria
(ii) Min (8000,5000,5000) = 5000
∴ Crop B and C are best according to minimax criteria
9.
First allocation:
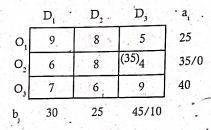
Second allocation:
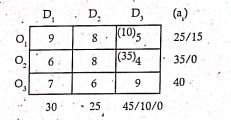
Third allocation:
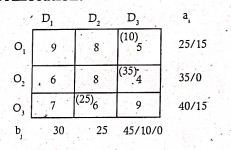
Fourth allocation:
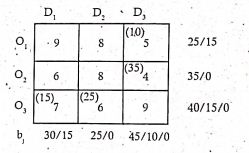
Final allocation:
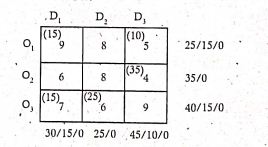
The total transportation cost is
\( =(15 \times 9)+(10 \times 5)+(35 \times 4) +(15 \times 7)+(25 \times 6) \)
= 135 + 50 + 140 + 105 + 150 = Rs. 580
10.
Since the number of columns is less than the number of rows, given assignment problem is unbalanced one. To balance it , introduce a dummy column with all the entries zero. The revised assignment problem is
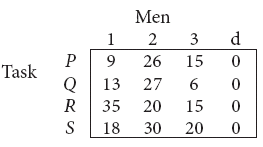
Here only 3 tasks can be assigned to 3 men.
Step 1: Its not necessary, since each row contains zero entry. Go to Step 2.
Step 2:
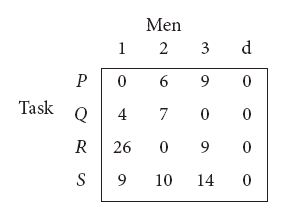
Step 3 (Assignment) :
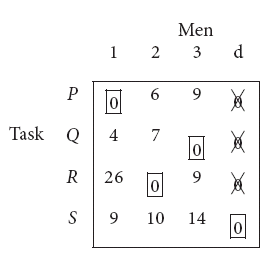
Since each row and each columncontains exactly one assignment,all the three men have been assigned a task. But task S is not assigned to any Man. The optimal assignment schedule and total cost is
| Task | Men | cost |
| P | 1 | 9 |
| Q | 3 | 6 |
| R | 2 | 20 |
| s | d | 0 |
| Total cost | 35 | |
The optimal assignment (minimum) cost = Rs. 35
11.
| Commodity | Price | P = \(\frac {p_{1}}{p_{0}}\) \(\times 100\) | V | [PV | |
| 2012 (p0) | 2015 (p0) | ||||
| Rice | 250 | 280 | 112 | 10 | 1120 |
| Wheat | 70 | 85 | 121.42 | 5 | 607.1 |
| Corn | 150 | 170 | 113.33 | 6 | 679.98 |
| Oil | 25 | 35 | 140 | 4 | 560 |
| Dhal | 85 | 90 | 105.88 | 3 | 317.64 |
| 28 | 3284.72 | ||||
Using family budget method,
C.L.I = \(\frac {\sum PV}{\sum V}\) = \(\frac {3284.72}{28}\) = 117.31
12.
| Year X | Profit (Rs) Y | 3-yearly moving total | 3-yearly moving average |
| 1986 | 15420} | - | - |
| 1987 | {15470} | 46410 | 15470 (∴ 46410 / 3) |
| 1988 | {{11520} | 52010 | 17336.666 |
| 1989 | {{21020 | 63040 | 21013.333 |
| 1990 | {{26500 | 79470 | 26490 |
| 1991 | 31950 | 94050 | 31350 |
| 1992 | 35600 | 102450 | 34150 |
| 1993 | 34900 | - | - |
13.
Let the missing entries be y2 and y4
Since only four values of f(x) are given, the polynomial which fits the data is of degree 3.
Hence fourth differences are zero
⇒ (E - 1)4yk = 0
⇒ (E4- 4E3 + 6E2 - 4E + 1) yk = 0 (1)
Put k = 0 in (1) we get,
y4 - 4y3 + 6y2 - 4y1 + y0 = 0
y4 - 4(18) + 6y2 - 4(11) + 7 = 0
⇒ y4 - 72 + 6y2 - 44 + 7 = 0
⇒ y4 + 6y2 = 109 (2)
Put k = 1 in (1) we get,
(E4- 4E3 + 6E2 - 4E + 1) y1 = 0
⇒ y5 - 4y4 + 6y3 - 4y2 +y1 = 0
⇒ 32 - 4 (y4) + 6 (18) - 4y2 + 11 = 0
32 - 4y4 + 108 - 4y2 + 11 = 0
⇒ -4y4 - 4y2 + 151 = 0
| -4y4 - 4y2 | = | -151 | |
| (2) \(\times\) 4 ➝ | 4y4 + 24y2 | = | 436 |
| Adding, | 20y2 | = | 285 |
Adding,
⇒ y2 = 14.25
Substituting y2 = 14.25 in (2) we get,
y4 + 6 (14.25) = 109
⇒ y4 + 85.5 = 109
⇒ y4 = 109 - 58.5
⇒ y4 = 23.5
14.
Given
| x | 0 | 1 | 2 | 3 |
| f(x) | 1 | 2 | 11 | 34 |
Find f(2.8)
Since the required value 2.8 is at the end of the table, apply Newton's backward interpolation formula.
xn + nh = 2.8 ⇒ 3 + n (1) = 2.8
⇒ n = 2.8 - 3 = -0.2
The difference table is
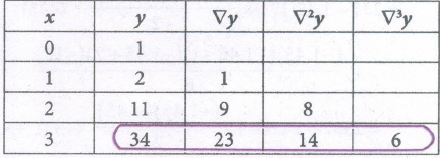
Newton's backward interpolation formula is
y(x = xn + nh) = \(\frac { n }{ 1! } { \triangledown y }_{ n }+\frac { n(n+1) }{ 2! } { \triangledown }^{ 2 }{ y }_{ n }+\frac { n(n+1)(n+2) }{ 3! } { \triangledown }^{ 3 }{ y }_{ n }\)
⇒ y(2.8) = 34 + (-0.2) (23) + \(\frac { (-0.2)(-0.2+1) }{ 2 } (14)+\frac { (0.2)(-0.2+1)(-0.2+2) }{ 6 } \)(16)
⇒ y(2.8) = 34 - 4.6 + (-0.2) (0.8) (7) + (-0.2) (0.8) (1.8)
⇒ y(2.8) = 34 - 4.6 - 1.12- 0.288
⇒ y(2.8) = 27.992
15.
The forward interpolation formula is
\({ y }_{ ({ x=x }_{ 0 }+nh) }={ y }_{ 0 }+\frac { n }{ 1! } =\triangle { y }_{ 0 }+\frac { n(n-1) }{ 2! } { \triangle }^{ 2 }{ y }_{ 0 }+\frac { n(n-1)(n-2) }{ 3! } { \triangle }^{ 3 }{ y }_{ 0 }+...\)
Here x0 + nh = x ⇒ x0 = 0, h = 1
∴ 0 + n = x ⇒ n = x.
The difference table is
| x | y = f(x) | Δy | Δ2y | Δ3y |
|---|---|---|---|---|
| 0 | 1 | |||
| 1 | ||||
| 1 | 2 | -2 | ||
| -1 | 12 | |||
| 2 | 1 | 10 | ||
| 9 | ||||
| 3 | 10 |
\({ y }_{ (n=x) }={ y }_{ 0 }+\frac { n }{ 1! } =\triangle { y }_{ 0 }+\frac { n(n-1) }{ 2! } { \triangle }^{ 2 }{ y }_{ 0 }+\frac { n(n-1)(n-2) }{ 3! } { \triangle }^{ 3 }{ y }_{ 0 }+...\)
\(y=1+\frac { n }{ 1! } (1)+\frac { n(n-1) }{ 2! } (-2)+\frac { n(n-1)(n-2) }{ 6 } (12)\)
⇒ y = 1 + x + (x2 - x)(-1) + x(x2 - 3x + 2) (2)
⇒ y = 1 + x - x2 + x + 2x3 - 6x2 + 4x
⇒ y = 1+ 6x - 7x2 + 2x3
Hence, the cubic polynomial is 2x3 - 7x2+ 6x + 1.
16.
Here total supply = 25 + 35 + 40 = 100
total requirement = 30 + 25 + 45 100
total supply = total requirement
∴ The given problem is a balanced transportation problem.
Hence, there exists a feasible solution for the given transportation problem.
North West Corner Rule:
I - allocation:
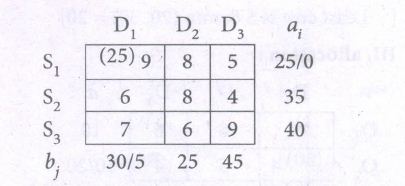
[∵ min (25, 30) = 25]
II - allocation:
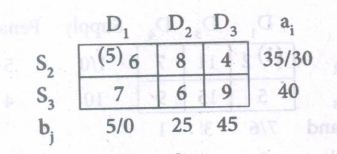
[∵ min (5, 35) = 5]
III - allocation:
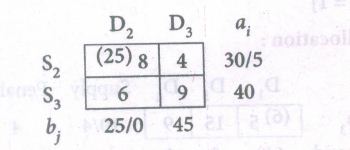
[∵ min (25, 30) = 25]
IV - allocation:
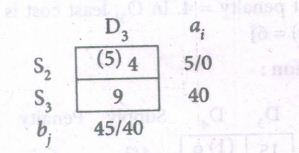
[∵ min (5, 45) = 5]
V - allocation:
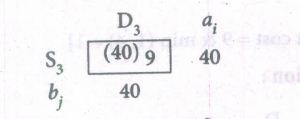
[∵ min (40, 40) = 40]
Thus, the allocations are
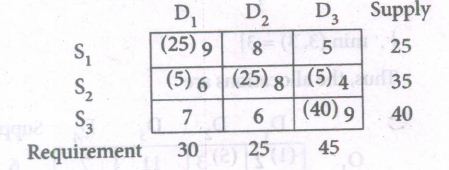
∴ The transportation schedule is
S1 → D1, S2 → D1, S2 → D2, S2 → D3, S3 → D3
Hence, the total transportation cost
= 25(9) + 5(6) + 25(8) + 5(4) + 40(9)
= 225 + 30 + 200 + 20 + 360
= Rs. 835
17.
Here, the number of rows and columns are equal.
∴ The given assignment problem is balanced.
Step 1 : Select a smallest element in each row and subtract this from all the elements in its row.
∴ The cost matrix: of the given assignment problem is
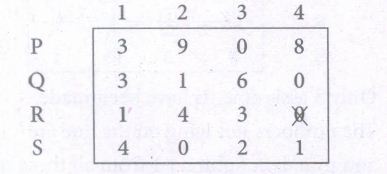
Column 1 contains no zero. Go to step 2.
Step 2 : Select the smallest element (1) in column 1 and subtract this from all the elements in its column.
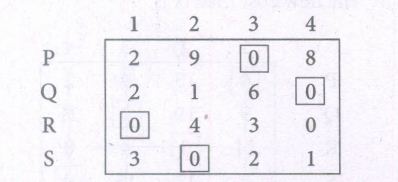
Since each row and column contains atleast one zero, assignments can be made.
Step 3 : Examine the rows with only one zero.
Row P, Q and S contains exactly one zero, mark them by 0 and mark the other zeros in the column byX.
Thus, all the four assignments have been made.
∴ The optimal assignment schedule and total cost is
| Salesman | Area | Cost |
|---|---|---|
| P | 3 | 8 |
| Q | 4 | 6 |
| R | 1 | 13 |
| S | 2 | 10 |
| Total Cost | Rs. 37 | |
18.
\(\begin{array}{|c|c|c|c|c|c|c|c|c|c|c|c|} \hline \text { Sample number } & 1 & 2 & 3 & 4 & 5 & 6 & 7 & 8 & 9 & 10 & \text { Total } \\ \hline \bar{X} & 49 & 45 & 48 & 53 & 39 & 47 & 46 & 39 & 51 & 45 & 462 \\ \hline \mathbf{R} & 7 & 5 & 7 & 9 & 5 & 8 & 8 & 6 & 7 & 6 & 68 \\ \hline \end{array}\)
\(\overline{\bar{X}}=\frac{\sum \bar{X}}{10}=\frac{462}{10}=46.2 \)
\(\bar{R}=\frac{\sum R}{10}=\frac{68}{10}=6.8 \)
\(\text { The control limits for } \overline{\mathrm{X}} \text { chart is }\)
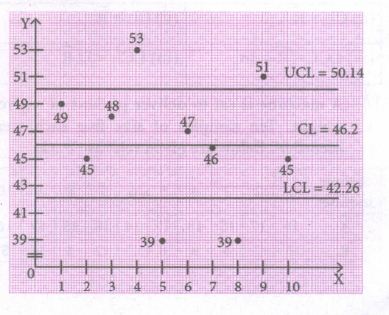
\(\mathrm{UCL}=\overline{\overline{\mathrm{X}}}+\mathrm{A}_{2} \overline{\mathrm{R}}=46.2+(0.58)(6.8)=50.14\)
\(\mathrm{CL}=46.2\)
\(\mathrm{LCL}=\overline{\mathrm{X}}-\mathrm{A}_{2} \overline{\mathrm{R}}=46.2-(0.58)(6.8)=42.26 \)
The control limits for range chart is
\(\mathrm{UCL}=\mathrm{D}_{4} \overline{\mathrm{R}}=(2.115)(6.8)=14.38 \)
\(\mathrm{CL}=\overline{\mathrm{R}}=6.8 \)
\(\mathrm{LCL}=\mathrm{D}_{3} \overline{\mathrm{R}}=0(6.8)=0\)
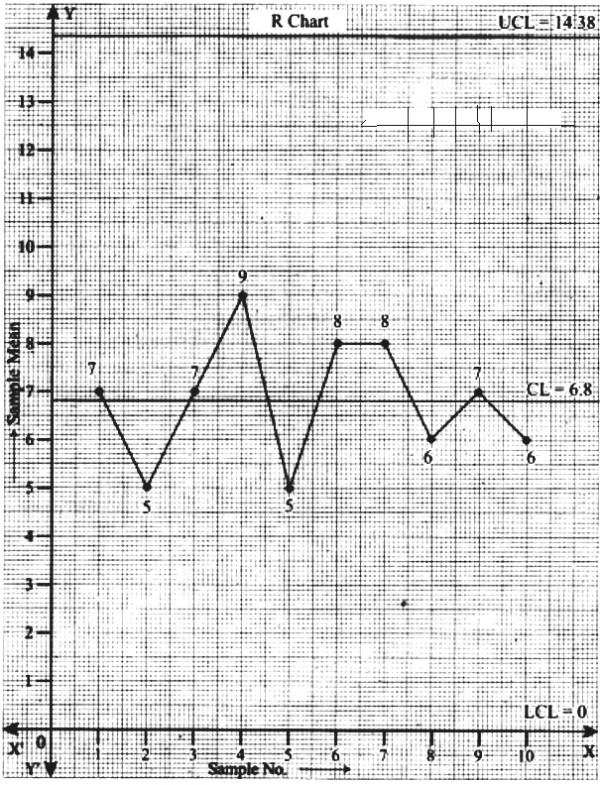
From the \(\overline X\) chart, we see that 4 points are outside the control limit lines. So we say that the process is out of control.
Conclusion: The above diagram shows all the three control lines with the data points plotted, since 2 points fall out of the control limits, we can say that the process is out of control.
19.
| Commodity | Price in Rupees per unit | Number of units | ||
| p0 | p1 | q0 | q1 | |
| A | 6 | 10 | 50 | 56 |
| B | 2 | 2 | 100 | 120 |
| C | 4 | 6 | 60 | 60 |
| D | 10 | 12 | 50 | 24 |
| E | 8 | 12 | 40 | 36 |
| p0q0 | p0q1 | p1q0 | p1q1 |
| 300 | 560 | 500 | 336 |
| 200 | 240 | 200 | 240 |
| 240 | 360 | 360 | 240 |
| 500 | 288 | 600 | 240 |
| 320 | 432 | 480 | 288 |
| 1560 | 1880 | 2140 | 1344 |
Fisher's price index number
\(P^{P}_{01}\) = \(\sqrt \frac {\sum p_{1}q_{0}\times \sum p_{1}q_{1}}{{\sum p_{0}q_{0}\times \sum p_{0}q_{1}}}\) × 100
= \(\sqrt \frac{2140\times1880}{1560\times1344} \times 100\)
= \(\sqrt \frac{4023200}{2096640} \times 100\)
= \(\sqrt {1.9188} \times 100\)
\(P^{F}_{01}\) = 138.5
Time reversal test :
P01 × P10 = \(\sqrt \frac{\sum p_{1}q_{0}\times{p_{1}q_{1}}\times{p_{0}q_{1}}\times{p_{0}q_{0}}}{{\sum p_{0}q_{0}\times{p_{0}q_{1}}\times{p_{1}q_{1}}\times{p_{1}q_{0}}}}\)
= \(\sqrt \frac{2140\times1880 \times 1344\times1560}{1560\times1344 \times 1880\times2140 }\)
= \(\sqrt 1\) = 1
Time reversal test = 1
Factor reversal test:
P01 × Q 01 = \(\sqrt \frac{\sum p_{1}q_{0}\times{p_{1}q_{1}}\times{p_{0}q_{1}}\times{p_{0}q_{0}}}{{\sum p_{0}q_{0}\times{p_{0}q_{1}}\times{p_{1}q_{1}}\times{p_{1}q_{0}}}}\)
\(=\sqrt \frac{2140\times1880 \times 1344\times1560}{1560\times1344 \times 1880\times2140 }\)
= \(\sqrt{(\frac{1880}{1560})^2}\)
= \(\frac {1880}{1560}\)
P01 × Q01 = \({\frac {\sum p_{1}q_{1}}{\sum p_{0}q_{0}}}\)
20.
| Year (X) | No. of Salesmen Y | X = x -1994 | X2 | XY |
| 1992 | 46 | -2 | 4 | -92 |
| 1993 | 48 | -1 | 1 | -48 |
| 1994 | 42 | 0 | 0 | 0 |
| 1995 | 56 | 1 | 1 | 56 |
| 1996 | 52 | 2 | 4 | 104 |
| 244 | 0 | 10 | 20 |
Smce \(\sum\)X = 0, a =\(\frac {\sum Y}{n}\) = \(\frac {244}{5}\) = 48.8
b = \(\frac {\sum XY}{\sum X^2}\) = \(\frac {20}{10}\) = 2
∴ The required equation of the straight line trend is given by
Y = a + bX \(\Rightarrow \) Y = 48.8 + 2X
\(\Rightarrow \) Y = 48.8 +2 (X - 1994) .... (1)
∴ Number of salesmen in 1997 is put X = 1997 in (1)
∴ Y = 48.8 + 2 (1997 - 1994)
= 48.8 + 2 (3)
= 48.8 + 6 = 54.8
∴ Number of salesmen in 1997 is 54.8
21.
(c)
c.Δf(x)
22.
(b)
2x +3
23.
(c)
f (x)
24.
(c)
2x +1
25.
(b)
balance between total activities and total resources
26.
(c)
less than m+n–1
27.
(c)
CL, LCL, UCL
28.
(c)
2
29.
(a)
Consumer price index
30.
(d)
All the above

12th Standard Syllabus & Materials
12th Standard
TN 12th Computer Applications வலையமைப்பு வடமிடல் Sample Question Papers Study Material - QB365 Set A
NEW12th Standard
TN 12th Computer Applications களப்பெயர் முறைமை (DNS) Sample Question Papers Study Material - QB365 Set A
NEW12th Standard
TN 12th Computer Applications வலையமைப்பு எடுத்துக்காட்டுகள் மற்றும் நெறிமுறைகள் Sample Question Papers Study Material - QB365 Set A
NEW12th Standard
TN 12th Computer Applications கணினி வலையமைப்பு ஓர் அறிமுகம் Sample Question Papers Study Material - QB365 Set A



Tamilnadu Stateboard 12th Standard Subjects

Maths

Chemistry

Physics

Biology

Computer Science
Business Maths and Statistics

Economics

Commerce

Accountancy

History

Computer Applications
Biology
Computer Technology
Computer Applications
Computer Science
Business Maths and Statistics
Commerce
Economics
Maths
Chemistry
Physics
Computer Technology
History
Accountancy

Tamil

English

French
Tamilnadu Stateboard Standards


