
 100% FREE ACCESS
10th Standard CBSE Syllabus & Materials
10th Standard CBSE
CBSE 10th Social Science ECO - Globalisation and the Indian Economy - New Model Questions Papers Study Material - QB365 Set A
NEW10th Standard CBSE
CBSE 10th Social Science ECO - Money and Credit - New Model Questions Papers Study Material - QB365 Set A
NEW10th Standard CBSE
CBSE 10th Social Science ECO - Sectors of the Indian Economy - New Model Questions Papers Study Material - QB365 Set A
NEW10th Standard CBSE
CBSE 10th Social Science ECO - Development - New Model Questions Papers Study Material - QB365 Set A
NEW10th Standard CBSE
CBSE 10th Social Science PS - Outcomes of Democracy - New Model Questions Papers Study Material - QB365 Set A
NEW10th Standard CBSE
CBSE 10th Social Science PS - Gender, Religion and Caste - New Model Questions Papers Study Material - QB365 Set A

Published on: 22/10/2025
Download CBSE Class 10th Standard CBSE Maths question papers, sample papers, important questions, and previous year solved papers in PDF format. Get free study materials, NCERT solutions, and exam preparation resources for Class 10th Standard CBSE Maths
Questions + Answers key
Take MCQ Maths Test
1.
Find the value of \(\lambda \) if the mode of the following data is 20 :
15,20,25, 18, 13, 15,25, 15, 18, 17, 20, 25, 20, \(\lambda \) ,18
2.
Consider the following distribution:
| Marks Obtained | 0 or More | 10 or More | 20 Or More | 30 Or More | 40 Or More | 50 Or More |
| Number of students | 63 | 58 | 55 | 51 | 48 | 42 |
(i) Calculate the frequency of the class 30 - 40.
(ii) Calculate the class mark of the class 10 - 25
3.
Construct the frequency distribution table for the given data.
| Marks | Number of students |
|---|---|
| Less than 10 | 14 |
| Less than 20 | 22 |
| Less than 30 | 37 |
| Less than 40 | 58 |
| Less than 50 | 67 |
| Less than 60 | 75 |
4.
Find the probability of getting multiple of 3 in a single throw of an ordinary die.
5.
From a well-shuffled pack of cards, a card is drawn at random. Find the probability of getting a black queen.
6.
The mode of the following frequency distribution is 38. Find the value of x.
| Class interval | 0-10 | 10-20 | 20-30 | 30-40 | 40-50 | 50-60 | 60-70 |
| Frequency | 7 | 9 | 12 | 16 | x | 6 | 11 |
7.
Following is the distribution of marks obtained by 60 students in Economics test:
| Marks | No. of students |
|---|---|
| More than 0 More than 10 More than 20 More than 30 More than 40 More than 50 |
60 56 40 20 10 3 |
Calculate the arithmetic mean.
8.
Find the mean of the following data:
| Class | Less than 20 | Less than 40 | Less than 60 | Less than 80 | Less than 90 |
| Frequency | 15 | 37 | 74 | 99 | 120 |
9.
Two coins are tossed simultaneously. Find the probability of getting
(i) exactly two head
(ii) atleast one head
10.
Two dice are thrown at the same time.Find the probability of getting:
(i)Same number on both dice
(ii)Different numbers on both dice
11.
From a well-shuffled pack of playing cards, black jacks, black kings and black aces are removed. A card is then drawn at random from the pack. Find the probability of getting
(a) a red card. (b) not a diamond card.
12.
For an event \(E,\ P(\overset { - }{ E } )=1-P(E)\) .
13.
P(E)+P(\(\overset{-}{E}\))=1.
14.
In a class, test marks (out of 80) of students are given in the following data:
| Marks (Less than) | 20 | 30 | 40 | 50 | 60 | 70 | 80 |
| Number of candidates | 4 | 12 | 22 | 34 | 44 | 48 | 50 |
Draw a 'less than type' ogive for the above data and from the curve, find median and verify the result
15.
A box contains 20 cards from 1 to 20. A card is drawn at random from the box. Find the probability that the number on the drawn card is:
(i) divisible by 2 or 3.
(ii) a prime number
16.
The mode of a distribution is 55 and the modal class is 45-60 and the frequency preceding the modal class is 5 and the frequency after the modal class is 10. Find the frequency of the modal class.
17.
A group consists of 12 persons, out of which 3 are extremely patient, other 6 are extremely honest and rest are extremely kind. A person from the group is selected at random. Assuming that each person is equally likely to be selected, find the probability of selecting a person who is
(i) extremely kind or honest
(ii) Which of the above values you prefer more?
18.
If the mean of 6, 7, x, 8, y, 14 is 9, then
x + y = 21
x + y = 19
x - y = 19
x - y = 21
19.
There is a green square board of side 2a unit circumscribing a red circle. Jayadev is asked to keep a dot on the above said board. Find the probability that he keeps the dot on the green region.
\(\frac{\pi}{4}\)
\(\frac{4-\pi}{4}\)
\(\frac{\pi-4}{4}\)
\(\frac{4}{\pi}\)
20.
For an event E, P(E)+ P\((\bar{E})\)= x, then the value of x3-3, is
-2
2
1
-1
21.
If P(E) = 0.65, ,then the value of P (not E) is
1.65
0.25
0.65
0.35
22.
A bag contains 3 red balls, 5 white balls and 7 black balls. The probability that a ball drawn from the bag at random will be neither red nor black is
\(\frac{1}{3}\)
\(\frac{1}{5}\)
\(\frac{7}{15}\)
\(\frac{8}{15}\)
23.
If the mean of five observations x, x + 2, x + 4, x + 6 and x + 8 is 11, then the values of x is
4
7
11
6
24.
The given figure shows a disc on which a player spins an arrow twice.
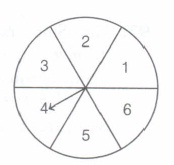
The fraction \(\frac{x}{y}\) is formed, where 'a' is y the number of sectors on which the arrow stops on the first spin and 'b' is the number of the sectors in which the arrow stops on the second spin. In each spin, each sector has equal chance of selection by the arrow, then the probability that the fraction \(\frac{x}{y}\) ≥ 1.
\(\frac{7}{12}\)
\(\frac{5}{12}\)
\(\frac{11}{12}\)
\(\frac{1}{2}\)
25.
| Expenditure | 0-10 | 10-20 | 20-30 | 30-40 | 40-50 |
| No of famileis | 14 | 23 | 27 | 21 | 15 |
What is the mode of the given data
24
22
25
21
26.
The lower limit of the modal class of the following data is
| C.I | 0-10 | 10-20 | 20-30 | 30-40 | 40-50 |
| Frequency | 5 | 8 | 13 | 7 | 6 |
10
50
30
20
27.
Which measure of central tendency takes in account all the data?
Mean
Median
Mode
All of the above
28.
The relation connecting the measures of central tendencies is
Mode = 2 median + 3 mean
Mode = 3 median – 2 mean
Mode = 3 median + 2 mean
Mode = 2 median – 3 mean
29.
The median of the following data is:
| Rent (in Rs) | 15-25 | 25-35 | 35-45 | 45-55 | 55-65 | 65-75 | 75-85 | 85-95 |
| No. of houses | 8 | 10 | 15 | 25 | 40 | 20 | 15 | 7 |
65
45
50
58
30.
The median of first ten natural numbers is
6
5.5
11
5
31.
A batsman in his 12th innings makes a score of 63 runs and thereby increases his average score by 2. His average score after 12th
41
60
51
45
32.
If the median of the following data is 166.79, then the mean and mode are
| Class Interval | Frequency |
| 130-140 | 5 |
| 140-150 | 9 |
| 150-160 | 17 |
| 160-170 | 28 |
| 170-180 | 24 |
| 180-190 | 10 |
| 190-200 | 7 |
Mode = 161.9 Mean = 168
Mode = 152.9 Mean = 166.73
Mode = 160.9 Mean = 167
Mode = 167.3, Mean = 168.03
33.
Probability of an event E + Probability of the event ‘not E’
0
1
Insufficient data
None of these
34.
In a lottery, there are 5 prizes and 20 blanks. The probability of getting a prize is
1/5
1/2
1/4
1/3
35.
A number is chosen at random from the numbers -3, -2, -1, 0, 1, 2, 3. The probability that |X| < 2 is
3/7
1/7
2/7
5/7
36.
A middle school decided to run the following spinner game as a fund-raiser on Christmas Carnival.
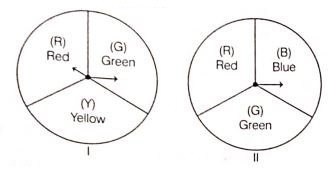
Making Purple: Spin each spinner once. Blue and red make purple. So, if one spinner shows Red (R) and another Blue (B), then you 'win', One such outcome is written as 'RB'.
Based on the above, answer the following questions
(i) List all possible outcomes of the game.
(ii) Find the probability of 'Making Purple'.
(iii) For each win, a participant gets Rs 10, but if he/she loses, he/she has to pay Rs 5 to the school.
If 99 participants played, calculate how much fund could the school have collected.
Or
If the same amnount of Rs 5 has been decided for winnings or losing the game, then how much fund had been collected by school? (Number of participants = 99)
37.
In a school, Class X B and C students appeared for Sunday Sample paper test 05 and marks obtained out of 80 are formulated in a table as follows:
| Marks | Number of students |
| Less than 10 | 8 |
| Less than 20 | 20 |
| Less than 30 | 30 |
| Less than 40 | 50 |
| Less than 50 | 60 |
| Less than 60 | 70 |
| Less than 70 | 75 |
| Less than 80 | 80 |
(a) How many students secured less than 40 marks?
| (i) 50 | (ii) 40 | (iii) 60 | (iv) 30 |
(b) What is the upper limit of modal class?
| (i) 20 | (ii) 30 | (iii) 40 | (iv) 50 |
(c) The median class is :
| (i) 10-20 | (ii) 20-30 | (iii) 30-40 | (iv) 40-50 |
(d) The mean marks of the students is :
| (i) 35.8 | (ii) 35.9 | (iii) 36 | (iv) 36.5 |
(e) Class mark of the class preceding the modal class is :
| (i) 35 | (ii) 30 | (iii) 25 | (iv) 45 |
38.
An inspestor in an enforcement squad of electricity department visit to a locality of 100 families and record their monthly consumption of electricity, on the basis of family members, electronic items in the house and wastage of electricity, which is summarise in the following table.
| Monthly Consumption (in kwh) |
0-100 | 100-200 | 200-300 | 300-400 | 400-500 | 500-600 | 600-700 | 700-800 | 800-900 | 900-1000 |
| Number of families | 2 | 5 | x | 12 | 17 | 20 | y | 9 | 7 | 4 |
Based on the above information, answer the following questions.
(i) The value of x + y is
| (a) 100 | (b) 42 | (c) 24 | (d) 200 |
(ii) If the median of the above data is 525, then x is equal to
| (a) 10 | (b) 8 | (c) 9 | (d) none of these |
(iii) What will be the upper limit of the modal class?
| (a) 400 | (c) 650 | (b) 600 | (d) 700 |
(iv) The average monthly consumption of a family of this locality is approximately
| (a) 520 kwh | (b) 522 kwh | (c) 540 kwh | (d) none of these |
(v) If A be the assumed mean, then A is always
| (a) > (Actual mean) | (b) < (Actual Mean) |
| (c) = (Actual Mean) | (d) can't say |
1.
Writing the data as discrete frequency distribution, we get
| x i | fi |
|---|---|
| 13 | 1 |
| 15 | 3 |
| 17 | 1 |
| 18 | 3 |
| 20 | 3 |
| \(\lambda \) | 1 |
| 25 | 3 |
For 20 to be mode of the frequency distribution, \(\lambda \) =20
2.
| Class Interval | cf | f |
| 0-10 | 63 | 5 |
| 10-20 | 58 | 3 |
| 20-30 | 55 | 4 |
| 30-40 | 51 | 3 |
| 40-50 | 48 | 6 |
| 50-60 | 42 | 42 |
So, frequency of the class 30 - 40 is 3.
Class mark of the class: 10-25 = \(\frac { 10+25 }{ 2 } \)
\(=\frac { 35 }{ 2 } =17.5\)
3.
Here, we have the cumulative frequency distribution of less than type. We observe that the number of students getting marks less than 10 is 14 and 22 students have marks less than 20.
Therefore, number of students getting marks between 10 and 20 is 22-14=8. Similarly, the number of students getting marks between 20 and 30 is 37-22=15 and so on.
Thus, we have the following frequency distribution table
| Marks | Number of students |
|---|---|
| 0-10 | 14 |
| 10-20 | 22-14=8 |
| 20-30 | 37-22=15 |
| 30-40 | 58-37=21 |
| 40-50 | 67-58=9 |
| 50-60 | 75-67=8 |
4.
Elementary events associated to the given random experiment, throwing an ordinary die are 1,2,3,4,5,6.
∴ n(S)=6
Let E be the events of getting multiple of 3, i.e.3,6.
∴ n(E)=12
Now, \(P(E)=\frac { n(E) }{ n(S) } =\frac { 2 }{ 6 } =\frac { 1 }{ 3 } \)
Hence, the probability of getting multiple of 3 in a single throw of an ordinary die is \(\frac { 1 }{ 3 } \) .
5.
Total number of ways to draw a card = 52
Number of ways to draw a black queen = 2
\(\therefore\) Probability of getting a black green = \(\frac{2}{52}=\frac{1}{26}\)
6.
x = 15
7.
| Class Interval | No. of students fi | Mid value xi | fixi |
|---|---|---|---|
| 0-10 10-20 20-30 30-40 40-50 50-60 |
60 - 56 = 4 56 -10 = 15 40 - 20 = 20 20 - 10 = 10 10 - 3 = 7 3 |
5 15 25 35 45 55 |
20 240 500 350 315 165 |
| Total | \(\sum { { f }_{ i } } =60\) | \(\sum { { f }_{ i } } {x}_{i}=1590\) |
Mean = \({ { \sum { { f }_{ i } } {x}_{i} }\over{ \sum { { f }_{ i } } } }={ {1590 }\over{ 60} }=26.5\)
8.
| C.I | fi | xi | xifi |
| 0-20 | 15 | 10 | 150 |
| 20-40 | 22 | 30 | 660 |
| 40-60 | 37 | 50 | 1850 |
| 60-80 | 25 | 70 | 1750 |
| 80-100 | 21 | 90 | 1800 |
| Total | \(\Sigma fi=120\) | \(\Sigma xifi=6300\) |
Mean x= \(\frac { \Sigma f_{ i }x_{ i } }{ \Sigma f_{ i } } =\frac { 6300 }{ 120 } =52.5\)
9.
When two coins are tossed simultaneously, then possible outcomes are (H, H), (H, T), (T, H) and (T, T)
\(\therefore \) Total number of outcomes = 4
(i) Let E1 be the event of getting exactly two head.
Then, the outcomes favourable to E1 is (H, H).
\(\therefore \) Number of outcomes favourable to E1 = 1
\(\therefore \) P(E1) = \(\frac{1}{4}\)
(ii) Let E2 be the event of getting atleast one head, i.e. one head or two head.
Then, favourable outcomes are (H, T), (H, H) and (H, T)
\(\therefore \) Number of outcomes favourable to E2 = 3
\(\therefore \) P (E2 ) = \(\frac{3}{4}\)
10.
When two dice are thrown, then sample space contains 36 outcomes.
(i)P (same number on both dice)=\({6\over36}={1\over6}\)
[(1,1), (2,2), (3,3), (4,4), (5,5), (6,6)]
(ii)P (different numbers on both dice) =\(1-{1\over6}={5\over6}\)
11.
As black jacks, black kings and black aces are removed
Then remaining cards are 52 - 6 = 46.
\(\therefore \) Total outcomes of drawing the card are 46.
(a) Favourable outcomes of a red card are 26.
\(\therefore \) Probability of a red card = \(\frac { 26 }{ 46 } =\frac { 13 }{ 23 } \)
(b) Favourable outcomes for not a diamond are 46-13 = 33
\(\therefore \) Probability of not a diamond card = \(\frac { 33 }{ 46 } \).
12.
(a)
13.
(a)
14.
Ans. 42.5
15.
No. of possible outcomes = 20 1
(i) Total no. divisible by 2 or 3 = 6, 12, 18 =3
P(divisible by 2 or 3) = \(\frac{3}{20}\)
(ii) Prime numbers = 2, 3, 5, 7, 11, 13, 17, 19 = 8
P(a prime. no.) =\(\frac{8}{20}\)= \(\frac{2}{5}\)
16.
15
17.
Given, a group consists 12 persons.
\(\therefore \) Total number of outcomes = 12
(i) Given, number of extremely patient persons = 3
\(\therefore \) Number of favourable outcomes = 3
\(\therefore \) P (extremely patient) = \(\frac{3}{12} = \frac{1}{4}\)
(ii) Given, number of extremely honest persons = 6 and number of extremely kind persons
= 12 - 6 - 3 = 3
\(\therefore \) Number of favourable outcomes = Number of extremely kind persons + Number of extremely honest persons = 6 + 3 = 9
\(\therefore \) P (extremely kind or honest) = \(\frac{9}{12}=\frac{3}{4}\)
18.
(b)
x + y = 19
19.
(b)
\(\frac{4-\pi}{4}\)
20.
(a)
-2
21.
(d)
0.35
22.
(a)
\(\frac{1}{3}\)
23.
(b)
7
24.
(a)
\(\frac{7}{12}\)
25.
(a)
24
26.
(d)
20
27.
(a)
Mean
28.
(b)
Mode = 3 median – 2 mean
29.
(d)
58
30.
(b)
5.5
31.
(a)
41
32.
(a)
Mode = 161.9 Mean = 168
33.
(b)
1
34.
(a)
1/5
35.
(a)
3/7
36.
(i) Possible outcomes = {RR, RB, RG, GR, GB, GG, YR, YB, YG}
(ii) Total outcomes = 9
Favourable outcomes = (RB}|
\(\therefore\) Probability = \(\frac{1}{9}\)
(iii) Since, probability of wining the game =\(\frac{1}{9}\)
and probability of lossing the game = \(\frac{8}{9}\)
Given,number of participants = 99
\(\therefore\) Number of winnerstudents = 99 \(\times\) \(\frac{1}{9}\)
= 11
and number of students that losses the game
\(=\frac{99 \times 8}{9}=88\)
\(\therefore\) Fund collected by school
= 88 \(\times\) 5 - 11 \(\times\) 10
= 440 - 110
= Rs 330
Or
If the same amount of Rs 5 has been decided for winning or loosing the game.
\(\therefore\) Fund collected by school
= 88 \(\times\) 5 - 11 \(\times\) 5 = 77 \(\times\)5 = Rs 385
37.
(a) (i) 50
(b) (iii) 40
(c) (iii) 30-40
(d) (ii) 35.9
(e) (iii) 25
38.
We have the following table:
| Class interval | Frequency | Cumulative frequency |
| 0-100 | 2 | 2 |
| 100-200 | 5 | 7 |
| 200-300 | x | 7+ x |
| 300-400 | 12 | 19 + x |
| 400-500 | 17 | 36 + x |
| 500-600 | 20 | 56 + x |
| 600-700 | y | 56 + x + y |
| 700-800 | 9 | 65 + x + y |
| 800-900 | 7 | 72 + x + y |
| 900-1000 | 4 | 76 + x + y |
| Total | 76 + x + y |
(i) (c): Here, it is given that total frequency = 100
\(\therefore\) 76 + x + y = 100 \(\Rightarrow\) x + y = 24
(ii) (c): Here \(\frac{N}{2}=\frac{100}{2}=50\)
Also, median = 525
\(\therefore\) Median class is 500-600.
\(\text { Now, median }=l+\left(\frac{N / 2-c . f .}{f}\right) \times h \)
\(\Rightarrow 525=500+\left(\frac{50-(36+x)}{20}\right) \times 100 \)
\(\Rightarrow 5=50-36-x \Rightarrow x=9\)
(iii) (b) : Since, maximum frequency is 20, so modal class is 500 - 600. Hence, upper limit of modal class is 600.
(iv) (b) : Since, x + y = 24 \(\Rightarrow\) y = 24 - 9 = 15
Required average consumption
\(\begin{aligned}
& 50 \times 2+150 \times 5+250 \times 9+350 \times 12+450 \times 17 \\
=& \frac{+550 \times 20+650 \times 15+750 \times 9+850 \times 7+950 \times 4}{100} \\
=& \frac{52200}{100}=522 \mathrm{kwh}
\end{aligned}\)
(v) (d)

10th Standard CBSE Syllabus & Materials
10th Standard CBSE
CBSE 10th Social Science PS - Federalism - New Model Questions Papers Study Material - QB365 Set A
NEW10th Standard CBSE
CBSE 10th Social Science PS - Power Sharing - New Model Questions Papers Study Material - QB365 Set A
NEW10th Standard CBSE
CBSE 10th Social Science GEO - Manufacturing Industries - New Model Questions Papers Study Material - QB365 Set A
NEW10th Standard CBSE
CBSE 10th Social Science GEO - Minerals and Energy Resources - New Model Questions Papers Study Material - QB365 Set A



NCERT Books

Syllabus

Exam Pattern

Sample Question Papers

Previous year Question Papers

Important Notes

MCQ Practice test

NCERT Exemplers

Case study Questions

Image Based Questions

Passage based Questions

HOT Questions

Value Based Questions

Model Questions Papers
NCERT ( Book Back ) Questions

Assertion and Reason
Important Questions And Answers

CBSE 10th Standard CBSE Subjects
CBSE Standards



