
 100% FREE ACCESS
10th Standard CBSE Syllabus & Materials
10th Standard CBSE
CBSE 10th Social Science ECO - Globalisation and the Indian Economy - New Model Questions Papers Study Material - QB365 Set A
NEW10th Standard CBSE
CBSE 10th Social Science ECO - Money and Credit - New Model Questions Papers Study Material - QB365 Set A
NEW10th Standard CBSE
CBSE 10th Social Science ECO - Sectors of the Indian Economy - New Model Questions Papers Study Material - QB365 Set A
NEW10th Standard CBSE
CBSE 10th Social Science ECO - Development - New Model Questions Papers Study Material - QB365 Set A
NEW10th Standard CBSE
CBSE 10th Social Science PS - Outcomes of Democracy - New Model Questions Papers Study Material - QB365 Set A
NEW10th Standard CBSE
CBSE 10th Social Science PS - Gender, Religion and Caste - New Model Questions Papers Study Material - QB365 Set A

Published on: 20/10/2025
Download CBSE Class 10th Standard CBSE Maths question papers, sample papers, important questions, and previous year solved papers in PDF format. Get free study materials, NCERT solutions, and exam preparation resources for Class 10th Standard CBSE Maths
Questions + Answers key
Take MCQ Maths Test
1.
Form the frequency distribution table from the following data:
| Marks (out of 90) | Number of candidates |
|---|---|
| More than or equal to 80 More than or equal to 70 More than or equal to 60 More than or equal to 50 More than or equal to 40 More than or equal to 30 More than or equal to 20 More than or equal to 10 More than or equal to 0 |
4 6 11 17 23 27 30 32 34 |
2.
(i) Find the mode of the following data
25, 16, 19, 48, 19, 20, 34, 15, 19, 20, 21, 24, 19, 16, 22, 16, 18, 20, 16, 19.
(ii) If one of the 19's is changed to 16 in the above data, find the new mode.
3.
The sum of the lower limit of the median class and the upper limit of the modal class
| Class | 10-20 | 20-30 | 30-40 | 40-50 | 50-60 | 60-70 |
|---|---|---|---|---|---|---|
| Frequency | 1 | 3 | 5 | 9 | 7 | 3 |
4.
If \(u_{ i }=\frac { x_{ i }-20 }{ 10 } ,\quad \sum { f_{ i }u_{ i }=30 } \) and \(\sum { f_{ i }=40 } \) , find the value of \(\overline { x } \) .
5.
In an arranged series of 4n terms, which term is median?
6.
Complete mean of the grouped data:
| Monthly salary | No. of persons |
|---|---|
| 325.5 - 350.5 350.5 - 375.5 375.5 - 400.5 400.5 - 425.5 425.5 - 450.5 450.5 - 475.5 475.5 - 500.5 |
20 10 10 5 1 2 2 |
7.
Find the mean of the following distribution by step deviation method
| Class | 0-10 | 10-20 | 20-30 | 30-40 | 40-50 | 50-60 |
| Frequency | 5 | 13 | 20 | 15 | 7 | 5 |
Let assumed mean, a = 35 and h = 10
8.
Following frequency distribution shows the daily expenditure on milk of 30 households in a locality
| Daily Expenditure on Milk (in Rs) | 0-30 | 30-60 | 60-90 | 90-120 | 120-150 |
| Number in households | 5 | 6 | 9 | 6 | 4 |
Find the mode for the above data
9.
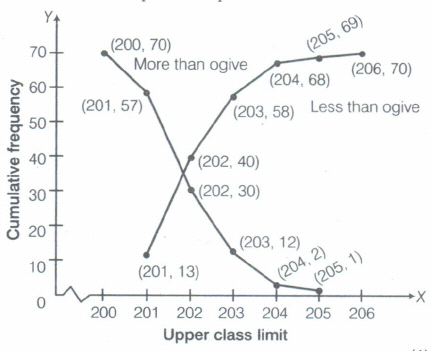
The weights of tea in 70 packets are shown in the following table:
| Weight (in grams) | 200-201 | 201-202 | 202-203 | 203-204 | 204-205 | 205-206 |
|---|---|---|---|---|---|---|
| Number of packets | 13 | 27 | 18 | 10 | 1 | 1 |
Draw the 'less than type' and 'more than type' ogives for the data.
10.
The following distribution gives the daily income of 50 workers of a factory:
| Daily income (in RS) | 100-120 | 120-140 | 140-160 | 160-180 | 180-200 |
|---|---|---|---|---|---|
| Number of workers | 12 | 14 | 8 | 6 | 10 |
Write the above distribution as 'less than type' cumulative frequency distribution.
11.
Find median for the following data
| Height (incm) [less than] | 120 | 140 | 160 | 180 | 200 |
| Number of students | 12 | 26 | 34 | 40 | 50 |
12.
Consider a grouped frequency distribution. of marks obtained, out of 100, by 58 students, in a certain examination, as follows
| Marks | 0-10 | 10-20 | 20-30 | 30-40 | 40-50 | 50-60 | 60-70 | 70-80 | 80-90 | 90-100 |
| Number of Students | 5 | 7 | 4 | 2 | 3 | 6 | 7 | 9 | 8 | 7 |
Form the cumulative frequency distribution of less than type and more than type
13.
During the medical check-up 35 students of a class, their weights were recorded as follows:
| Weight (in kg) | Number of students |
|---|---|
| Less than 38 | 0 |
| Less than 40 | 3 |
| Less than 42 | 5 |
| Less than 44 | 9 |
| Less than 46 | 14 |
| Less than 48 | 28 |
| Less than 50 | 32 |
| Less than 52 | 35 |
Draw a 'less than type' ogive for the given data. Hence, obtain the median weight from the graph and verify the result by using the formula. What are benefits of regular medical check-up?
14.
Draw 'less than ogive' and 'more than ogive' for the following distribution and hence find its median.
| Class interval | 20-30 | 30-40 | 40-50 | 50-60 | 60-70 | 70-80 | 80-90 |
|---|---|---|---|---|---|---|---|
| Frequency | 10 | 8 | 12 | 24 | 6 | 25 | 15 |
15.
The following table gives the literacy rate (in %) of 25 cities.
| Literacy rate | 50-60 | 60-70 | 70-80 | 80-90 |
|---|---|---|---|---|
| Number of cities | 9 | 6 | 8 | 2 |
Find the median class and modal class.
16.
The time in seconds, taken by 150 athletes to run a 100m hurdle race are tabulated below
| Time (sec) | 13-14 | 14-15 | 15-16 | 16-17 | 17-18 | 18-19 |
| Number of Athletes | 2 | 4 | 5 | 71 | 48 | 20 |
The number of athletes who completed the race in less than 17 sec, is
11
71
82
68
17.
If the mean of the following distribution is 6, find the value of ‘p’.
| x | 2 | 4 | 6 | 10 | p+6 |
| f | 3 | 2 | 3 | 1 | 2 |
7
12
8
6
18.
If the mean and the median are 25.41 and 26.5 respectively. then the mode is
29
28.68
25.6
28
19.
The relation connecting the measures of central tendencies is
Mode = 2 median + 3 mean
Mode = 3 median – 2 mean
Mode = 3 median + 2 mean
Mode = 2 median – 3 mean
20.
Median of the data given below will lie in the class
| Height(in cm) | frequency |
| Below 140 | 4 |
| 140-145 | 7 |
| 145-150 | 18 |
| 150-155 | 11 |
| 155-160 | 6 |
| 160-165 | 5 |
150-155
140-145
160-165
145-150
21.
Vocational training complements traditional education by providing practical skills and hands on experience. While education equips individuals with a broad knowledge base, vocational training focuses on job-specific skills, enhancing employability thus making the student self-reliant. Keeping this in view, a teacher made the following table giving the frequency distribution of students/adults undergoing vocational training from the training institute.

| Age (in years) | 15-19 | 20-24 | 25-29 | 30-34 | 35-39 | 40-44 | 45-49 | 50-54 |
| Number of participants | 62 | 132 | 96 | 37 | 13 | 11 | 10 | 4 |
From the above, answer the following questions.
(a) What is the lower limit of the modal class of the above data?
(b) (i) Find the median class of the above data.
Or
(ii) Find the number of participants of age less than 50 yr who undergo vocational training.
(c) Give the empirical relationship between mean, median and mode.
22.
Shweta went to a beach with her uncle. From a point A where Shweta was standing, a ship and light house come in a straight line as shown in the figure.
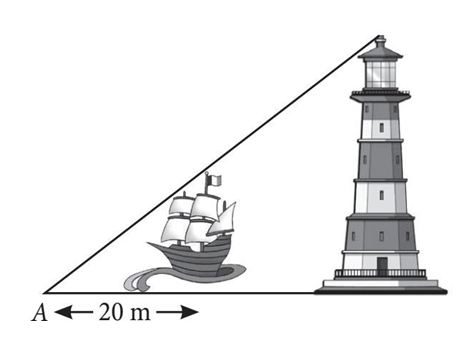
(i) Which similarity criteria can be seen in this case, if ship and lighthouse are considered as straight lines?
| (a) AA | (b) SAS | (c) SSS | (d) ASA |
(ii) The distance between Shweta and the ship is twice as much as the height of the ship. What is the height of the ship?
| (a) 40m | (b) 10 m | (c) 15 m | (d) 25m |
(iii) If the distance of Shweta from the lighthouse is twelve times the height of the ship, then the ratio of the heights of ship and lighthouse is
| (a) 3 : 1 | (b) 1 : 4 | (c) 1 : 6 | (d) 2 : 3 |
(iv) What is the ratio of the distance between Shweta and top of ship to the dista nce between the tops of ship and lighthouse?
| (a) 1 : 5 | (b) 1 : 6 | (c) 2 : 5 | (d) Can't be determined |
23.
100m RACE
A stopwatch was used to find the time that it took a group of students to run 100 m.
| Time in (sec) | 0-20 | 20-40 | 40-60 | 60-80 | 80-100 |
| No.of students | 8 | 10 | 13 | 6 | 3 |
(i) Estimate the mean time taken by a student to finish the race.
| (a) 54 | (b) 63 | (c) 43 | (d) 50 |
(ii) What will be the upper limit of the modal class ?
| (a) 20 | (b) 40 | (c) 60 | (d) 80 |
(iii) The construction of cumulative frequency table is useful in determining the
| (a) Mean | (b) Median | (c) Mode | (d) All of the above |
(iv) The sum of lower limits of median class and modal class is
| (a) 60 | (b) 100 | (c) 80 | (d) 140 |
(v) How many students finished the race within 1 minute?
| (a) 18 | (b) 37 | (c) 31 | (d) 8 |
24.
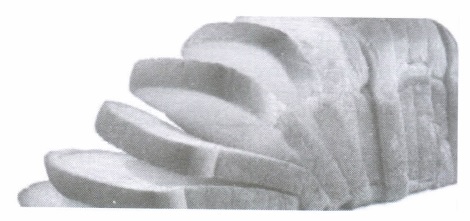
A bread manufacturer wants to know the lifetime of the product. For this, he tested the life time of 400 packets of bread. The following tables gives the distribution of the life time of 400 packets.
| Lifetime (in hours) | Number of packets (Cumulative frequency) |
| 150-200 | 14 |
| 200-250 | 70 |
| 250-300 | 130 |
| 300-350 | 216 |
| 350-400 | 290 |
| 400-450 | 352 |
| 450-500 | 400 |
Based on the above information, answer the following questions.
(i) If m be the class mark and b be the upper limit of a class in a continuous frequency distribution, then lower limit of the class is
| (a) 2m + b | (b) 2m+\(\sqrt{b}\) | (c) m - b | (d) 2m-b |
(ii) The average lifetime of a packet is
| (a) 341 hrs | (b) 300 hrs | (c) 340 hrs | (d) 301 hrs |
(iii) The median lifetime of a packet is
| (a) 347 hrs | (b) 340 hrs | (c) 346 hrs | (d) 342 hrs |
(iv) If empirical formula is used, then modal lifetime of a packet is
| (a) 340 hrs | (b) 341 hrs | (c) 348 hrs | (d) 349 hrs |
(v) Manufacturer should claim that the lifetime of a packet is
| (a) 346 hrs | (b) 341 hrs | (c) 340 hrs | (d) 347hrs |
25.
An inspestor in an enforcement squad of electricity department visit to a locality of 100 families and record their monthly consumption of electricity, on the basis of family members, electronic items in the house and wastage of electricity, which is summarise in the following table.
| Monthly Consumption (in kwh) |
0-100 | 100-200 | 200-300 | 300-400 | 400-500 | 500-600 | 600-700 | 700-800 | 800-900 | 900-1000 |
| Number of families | 2 | 5 | x | 12 | 17 | 20 | y | 9 | 7 | 4 |
Based on the above information, answer the following questions.
(i) The value of x + y is
| (a) 100 | (b) 42 | (c) 24 | (d) 200 |
(ii) If the median of the above data is 525, then x is equal to
| (a) 10 | (b) 8 | (c) 9 | (d) none of these |
(iii) What will be the upper limit of the modal class?
| (a) 400 | (c) 650 | (b) 600 | (d) 700 |
(iv) The average monthly consumption of a family of this locality is approximately
| (a) 520 kwh | (b) 522 kwh | (c) 540 kwh | (d) none of these |
(v) If A be the assumed mean, then A is always
| (a) > (Actual mean) | (b) < (Actual Mean) |
| (c) = (Actual Mean) | (d) can't say |
1.
Frequency distribution table
| Marks | No.of candidates |
|---|---|
| 0-10 10-20 20-30 30-40 40-50 50-60 60-70 70-80 80-90 |
2 2 3 4 6 6 5 2 4 |
2.
(i) Mode is 19.
(ii) If 19 is changed to 1 6. then frequency of 16 is 5 and frequency of 19 becomes 1i.e.,16 has maximum frequency
\(\Rightarrow\) 16 is the mode.
3.
| Class | 10-20 | 20-30 | 30-40 | 40-50 | 50-60 | 60-70 |
|---|---|---|---|---|---|---|
| Frequency | 1 | 3 | 5 | 9 | 7 | 3 |
| Cumulative Frequency | 1 | 4 | 9 | 18 | 25 | 28 |
Median class : 40 - 50 \(\Rightarrow \) Lower Limit =40
Modal class : 40 - 50 \(\Rightarrow \) Upper Limit = 50
Their sum = 40+50=90
4.
Given, \( \sum { f_{ i }u_{ i }=30 } \), \(\sum { f_{ i }=40 } \) and \(u_{ i }=\frac { x_{ i }-20 }{ 10 } \)
We know that, \(u_{ i }=\frac { x_{ i }-a }{ h } \)
On comparing, we get a=20, h=10
\(\therefore \quad \overline { x } =a+\left\{ \frac { \sum { f_{ i }u_{ i } } }{ \sum { f_{ i } } } \right\} \times h=20+\left\{ \frac { 30 }{ 40 } \right\} \times 10\\ =20+\frac { 30 }{ 4 } =\frac { 80+30 }{ 4 } =\frac { 110 }{ 4 } =27.5\)
5.
Here, number of terms, N=4n, whch is an even number.
Median=Mean of \(\left( \frac { n }{ 2 } \right) \) th term and \(\left( \frac { n }{ 2 } +1 \right) \) th term
i.e. Median=Mean of (2n)th term and (2n+1)th term.
6.
Let a = 413,h = 25
| Monthly Salary | xi | No. of person (fi) | \({u}_{i}={ { {x}_{i}-a}\over{h } }\) | fiui |
|---|---|---|---|---|
| 325.5 -350.5 350.5 - 375.5 375.5 - 400.5 400.5 - 425.5 425.5 - 450.5 450.5 - 475.5 475.5 -500.5 |
338 363 388 413 438 463 488 |
20 10 ln 5 1 2 2 |
-3 -2 -1 0 1 2 3 |
-60 -20 -10 0 1 4 6 |
| Total | \(\sum { { f }_{ i } } \) =50 | \(\sum { { f }_{ i } } {u}_{i}\) = -79 |
\(\bar{x}=a+{ {\sum { { f }_{ i } }{u}_{i} }\over{ \sum { { f }_{ i } } } }\times h=413+{ { (-79)}\over{ 50} }\times25=413-{ { 79}\over{ 2} }=413-39.5\) = 373.5
7.
| xi (class marks) | \(u_{ i }=\frac { x_{ i }-a }{ h } \) | fi | fiui |
| 5 | -3 | 5 | -15 |
| 15 | -2 | 13 | -26 |
| 25 | -1 | 20 | -20 |
| 35 | 0 | 15 | 0 |
| 45 | 1 | 7 | 7 |
| 55 | 2 | 5 | 10 |
| Total | \(\Sigma f_{ i }=65\) | \(\Sigma f_{ i }u_{ i }=-44\) |
\(\overset { - }{ x } =a+\frac { \Sigma f_{ i }u_{ i } }{ \Sigma f_{ i } } \times h\)
\(=35+\frac { -44 }{ 65 } \times 10=35-6.76=28.24\)
8.
Here, maximum frequency = 9, hence modal class is 60 - 90
Mode= L+h \(\left( \frac { f_{ 1 }-f_{ 0 } }{ 2f_{ 1 }-f_{ 0 }-f_{ 2 } } \right) \)
Here, - 60,f1 = 9,f0 = 6,f2= 6 and h = 30.
Mode = 60+30 \(\left( \frac { 9-6 }{ 2\times 9-6-6 } \right) \)
= \(60+\frac { 30\times 3 }{ 6 } =60+15\)
=75
9.
10.
We construct a cumulative frequency distribution of the less than type as follows:
| Daily income (in RS) | Number of workers | Cumulative frequency (cf) |
|---|---|---|
| Less than 120 | 12 | 12 |
| Less than 140 | 14 | 12+14=26 |
| Less than 160 | 8 | 26+8=34 |
| Less than 180 | 6 | 34+6=40 |
| Less than 200 | 10 | 40+10=50 |
Taking upper class limits of class intervals on x-axis and their respective frequencies on y-axis, its ogive can be drawn as follows.
11.
Ans.138.57 cm
12.
Cumulative frequency distribution of the less than type
Here, the number of students who have scored marks less than 10 are 5. The number of students who have scored marks less than 20 includes the number of students who have scored marks from 0-10 as well as the number of students who have scored marks from 10-20.
Thus, the total number of students with marks less than 20 is 5 + 7, i.e. 12. So, the cumulative frequency of the class 10-20 is 12.
Similarly, on computing the cumulative frequencies of the other classes, i.e. the number of students with marks less than 30, less than 40, ... less than 100, we get the distribution which is called the cumulative frequency distribution of the less than type.
| Marks obtained | Number of students (cumulative frequency) |
| Less than 10 | 5 |
| Less than 20 | 5 + 7 = 12 |
| Less than 30 | 12 + 4 = 16 |
| Less than 40 | 16 + 2 = 18 |
| Less than 50 | 18 + 3 = 21 |
| Less than 60 | 21 + 6 = 27 |
| Less than 70 | 27 + 7 = 34 |
| Less than 80 | 34 + 9 = 43 |
| Less than 90 | 43 + 8 = 51 |
| Less than 100 | 51 + 7 = 58 |
Here, 10,20,30, ... , 100 are the upper limits of the respective class intervals.
Cumulative frequency distribution of the more than type
For this type of distribution, we make the table for the number of students with scores, more than or equal to 0, more than or equal to 10, more than or equal to 20 and so on. From the question, we observed that all 58 students have scored marks more than or equal to O.
There are 5 students scoring marks in the interval 0-10, it shows that there are 58 - 5 = 53 students getting more than or equal to 10 marks. In the same manner, the number of students scoring 20 marks or above = 53 - 7 = 46 students, scoring 30 or above = 46 - 4 = 42 students and so on.
Similarly, computing the cumulative frequencies of the other classes, i.e. the number of students with marks more than or equal to 40, more than or equal to 50, ... , we get the distribution which is called the cumulative frequency distribution of the more than type.
| Marks obtained | Number of students (cumulative frequency) |
| More than or equal to 0 | 58 |
| More than or equal to 10 | 58 - 5 = 53 |
| More than or equal to 20 | 53 - 7 = 46 |
| More than or equal to 30 | 46 - 4 = 42 |
| More than or equal to 40 | 42 - 2 = 40 |
| More than or equal to 50 | 40 - 3 = 37 |
| More than or equal to 60 | 37 - 6 = 31 |
| More than or equal to 70 | 31 - 7 = 24 |
| More than or equal to 80 | 24 - 9 = 15 |
| More than or equal to 90 | 15 - 8 = 7 |
Here, 0, 10,20,30, ... ,90 are the lower limits of the respective class intervals.
13.
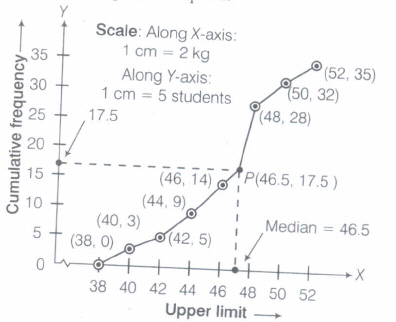
Benefits of regular medical check-up are
(t) It enables us to take pre-medical action on time.
(it) It reduces the chances of getting sick.
14.
Ans. 50
15.
| Literacy rate | 50-60 | 60-70 | 70-80 | 80-90 |
|---|---|---|---|---|
| Number of cities | 9 | 6 | 8 | 2 |
| Cumulative frequency (cf) | 9 | 15 | 23 | 25 |
Here, \(\frac { n }{ 2 } =\frac { 25 }{ 2 } =12.5\)
Since, cumulative frequency just greater than 12.5 and corresponding class is 60-70.
Median class=60-70
Since, highest frequency is 9 and corresponding class is 50-60
Modal class=50-60
16.
(c)
82
17.
(d)
6
18.
(b)
28.68
19.
(b)
Mode = 3 median – 2 mean
20.
(d)
145-150
21.
(a) Modal class is the class interval in a frequency distribution table which has the highest frequency. According to the given data, the highest frequency is 132 and the class interval corresponding to it is 20-24.
Thus, the modal class of the above data is 20-24.
Hence, lower limit of the modal class is 20.
(b) (i) Convert the given data as continuous classes and calculate the cumulative frequency.
| Class interval (Age) | Frequency (f) | Comulative frequency (cf) |
| 14.5 - 19.5 | 62 | 62 |
| 19.5 - 24.5 | 132 | 194 |
| 24.5 - 29.5 | 96 | 290 |
| 29.5 - 34.5 | 37 | 327 |
| 34.5 - 39.5 | 13 | 340 |
| 39.5 - 44.5 | 11 | 351 |
| 44.5 - 49.5 | 10 | 361 |
| 49.5 - 54.5 | 4 | 365 |
Here, N = 365 (odd)
\(\frac{N}{2}=\frac{365}{2}=182.5\)
Cumulative frequency greater than and nearer to 182.5 is 194 which belongs to the class interval 19.5-24.5
\(\therefore\) The median class of the above data is 19.5 - 24.5.
(ii) Number of participants of age less than 50 yr who undergo vocational training
= 62 + 132 + 96 + 37 + 13 + 11 + 10 = 361
Therefore, required number of participants is 361.
(c) The empirical relationship between mean, median and mode is given by
Mode = 3 Median - 2 Mean
22.
(i) (a)
In \(\triangle A B C \text { and } \triangle A D E,\)
\(\angle A=\angle A\) (common)
\(\angle B=\angle D\) (coorresponding angles)
\(\therefore \quad \Delta A B C \sim \Delta A D E\) (By AA similarity criteria)
(ii) (b)
We have, \(A B=2 B C \Rightarrow B C=\frac{20}{2}=10 \mathrm{~m}\)
So,height of ship = 10m
(iii) (c)
We have, AD=12 BC
\(\Rightarrow A D=12 \times 10=120 \mathrm{~m}\)
\(\therefore \triangle A B C \sim \triangle A D E\)
\(\therefore \frac{A B}{A D}=\frac{B C}{D E}\)
\(\Rightarrow \frac{B C}{D E}=\frac{20}{120}=\frac{1}{6}\)
So,ratio of height of ship and light house is 1:6
(iv) (a)
Since,\(\triangle A B C \sim \triangle A D E\)
\(\Rightarrow \frac{A B}{A D}=\frac{A C}{A E}\)
\(\Rightarrow \frac{A E}{A C}-1=6-1 \Rightarrow \frac{A E-A C}{A C}=5 \Rightarrow \frac{E C}{A C}=5\)
\(\Rightarrow \frac{A C}{E C}=\frac{1}{5}\)
\(\therefore\) Required ratio = 1 :5
(v) (b)
Height of lighthouse = DE
Now, \(\frac{B C}{D E}=\frac{1}{6}\)
\(\Rightarrow D E=6 B C\)
= 6 X 10 = 60m
23.
(i) (c):
| Time in (sec) | x | f | cf | fx |
| 0-20 | 10 | 8 | 8 | 80 |
| 20-40 | 30 | 10 | 18 | 300 |
| 40-60 | 50 | 13 | 31 | 650 |
| 60-80 | 70 | 6 | 37 | 420 |
| 80-100 | 90 | 3 | 40 | 270 |
| Total | 40 | 1720 |
\(\text { Mean }=\frac{1720}{40}\)
= 43
(ii) (c): 60
(iii) (b): Median
(iv) (c): Median class 40 - 60, Modal class = 40 - 60
Sum of lower limits of median class and modal class = 40 + 40 = 80
(v) (c): Number of students are = 8 + 10 + 13
= 31
24.
(i) (d): We know that,
\(\text { Class mark }=\frac{\text { Lower limit }+\text { Upper limit }}{2} \)
\(\Rightarrow m=\frac{\text { Lower limit }+b}{2} \Rightarrow \text { Lower limit }=2 m-b\)
(ii) (a):
| Lifetime (in hours) | Class mark (xi) | fi | di=xi-A | fi di |
| 150 -200 | 175 | 14 | -150 | -2100 |
| 200 -250 | 225 | 56 | -100 | -5600 |
| 250 -300 | 275 | 60 | -50 | -3000 |
| 300 -350 | 325 = A | 86 | 0 | 0 |
| 350 -400 | 375 | 74 | 50 | 3700 |
| 400 -450 | 425 | 62 | 100 | 6200 |
| 450 -500 | 475 | 48 | 150 | 7200 |
| Total | 400 | 6400 |
\(\begin{aligned}
&\therefore \quad \text { Average lifetime of a packet }\\
&=A+\frac{\sum f_{i} d_{i}}{\sum f_{i}}=325+\frac{6400}{400}=341 \mathrm{hrs}
\end{aligned}\)
(iii) (b) : \(\text { Here, } N=400 \Rightarrow \frac{N}{2}=200\)
Also, cumulative frequency for the given distribution are 14, 70, 130,216,290,352,400
\(\therefore\) c.f just greater than 200 is 216, which is
corresponding to the interval 300-350.
l= 300, f=86, c.f = 130, h = 50
\(\therefore \quad \text { Median }=l+\left(\frac{\frac{N}{2}-c . f .}{f}\right) \times h=300+\left(\frac{200-130}{86}\right) \times 50\)
= 300 + 40.697 = 340.697 ""340 hrs (approx.)
(iv) (a) : We know that Mode = 3 Median - 2 Mean
= 3(340.697) -2(341)
= 1022.091 - 682 = 340.091 ""340 hrs
(v) (c): Since, minimum of mean, median and mode is approximately 340 hrs. So, manufacturer should claim that lifetime of a packet is 340 hrs.
25.
We have the following table:
| Class interval | Frequency | Cumulative frequency |
| 0-100 | 2 | 2 |
| 100-200 | 5 | 7 |
| 200-300 | x | 7+ x |
| 300-400 | 12 | 19 + x |
| 400-500 | 17 | 36 + x |
| 500-600 | 20 | 56 + x |
| 600-700 | y | 56 + x + y |
| 700-800 | 9 | 65 + x + y |
| 800-900 | 7 | 72 + x + y |
| 900-1000 | 4 | 76 + x + y |
| Total | 76 + x + y |
(i) (c): Here, it is given that total frequency = 100
\(\therefore\) 76 + x + y = 100 \(\Rightarrow\) x + y = 24
(ii) (c): Here \(\frac{N}{2}=\frac{100}{2}=50\)
Also, median = 525
\(\therefore\) Median class is 500-600.
\(\text { Now, median }=l+\left(\frac{N / 2-c . f .}{f}\right) \times h \)
\(\Rightarrow 525=500+\left(\frac{50-(36+x)}{20}\right) \times 100 \)
\(\Rightarrow 5=50-36-x \Rightarrow x=9\)
(iii) (b) : Since, maximum frequency is 20, so modal class is 500 - 600. Hence, upper limit of modal class is 600.
(iv) (b) : Since, x + y = 24 \(\Rightarrow\) y = 24 - 9 = 15
Required average consumption
\(\begin{aligned}
& 50 \times 2+150 \times 5+250 \times 9+350 \times 12+450 \times 17 \\
=& \frac{+550 \times 20+650 \times 15+750 \times 9+850 \times 7+950 \times 4}{100} \\
=& \frac{52200}{100}=522 \mathrm{kwh}
\end{aligned}\)
(v) (d)

10th Standard CBSE Syllabus & Materials
10th Standard CBSE
CBSE 10th Social Science PS - Federalism - New Model Questions Papers Study Material - QB365 Set A
NEW10th Standard CBSE
CBSE 10th Social Science PS - Power Sharing - New Model Questions Papers Study Material - QB365 Set A
NEW10th Standard CBSE
CBSE 10th Social Science GEO - Manufacturing Industries - New Model Questions Papers Study Material - QB365 Set A
NEW10th Standard CBSE
CBSE 10th Social Science GEO - Minerals and Energy Resources - New Model Questions Papers Study Material - QB365 Set A



NCERT Books

Syllabus

Exam Pattern

Sample Question Papers

Previous year Question Papers

Important Notes

MCQ Practice test

NCERT Exemplers

Case study Questions

Image Based Questions

Passage based Questions

HOT Questions

Value Based Questions

Model Questions Papers
NCERT ( Book Back ) Questions

Assertion and Reason
Important Questions And Answers

CBSE 10th Standard CBSE Subjects
CBSE Standards



