
 100% FREE ACCESS
11th Standard CBSE Syllabus & Materials
11th Standard CBSE
CBSE 11th Economics PART-A - Presentation of Data - New Sample Question Papers Study Material - QB365 Set A
NEW11th Standard CBSE
CBSE 11th Economics PART-A - Organisation of Data - New Sample Question Papers Study Material - QB365 Set A
NEW11th Standard CBSE
CBSE 11th Economics PART-A - Collection of Data - New Sample Question Papers Study Material - QB365 Set A
NEW11th Standard CBSE
CBSE 11th Economics PART-A - Introduction to Economics and Statistics - New Sample Question Papers Study Material - QB365 Set A
NEW11th Standard CBSE
CBSE 11th Business Studies International Trade Sample Question Papers Study Material - QB365 Set A
NEW11th Standard CBSE
CBSE 11th Business Studies Evolution and Fundamentals of Business Sample Question Papers Study Material - QB365 Set A

Published on: 03/10/2019
Revenue
Download CBSE Class 11th Standard CBSE undefined question papers, sample papers, important questions, and previous year solved papers in PDF format. Get free study materials, NCERT solutions, and exam preparation resources for Class 11th Standard CBSE undefined
Questions + Answers key
Take MCQ Biology Test
1.
What is the relationship between TR and Price line when price is constant?
2.
The demand function of a commodity x is Qx = 12 - Px (where Qx = the quantity demanded of a commodity x and Px = price of the commodity x). Derive the TR and MR schedules when the price of commodity varies from Rs 12 to Rs 1.
3.
Calculate TR, AR and MR from the following data.
| Price(Rs) | 1 | 2 | 3 | 4 | 5 | 6 | 7 |
| units sold | 100 | 90 | 80 | 70 | 60 | 50 | 40 |
4.
Calculate TR, AR and MR from the following data.
| Units sold | 10 | 9 | 8 | 7 | 6 | 5 | 4 |
| Price(Rs) | 1 | 2 | 3 | 4 | 5 | 6 | 7 |
5.
What is revenue of a firm? Give meaning of average revenue and marginal revenue. What happens to average revenue when marginal revenue is: (i) Greater than average revenue; (ii) equal to average revenue; (iii) less than average revenue?
6.
Explain the relation between marginal revenue and average revenue when a firm is able to sell more quantity of output: (i) at the same price. (ii) only by lowering the price.
7.
Calculate TR, MR and AR.
| Price(Rs) | 4 | 5 | 6 | 7 |
| Units sold | 1 | 2 | 3 | 4 |
8.
Complete the following table.
| Output (units) | 1 | 2 | 3 | 4 |
|---|---|---|---|---|
| AR(Rs) | - | - | 11 | - |
| MR(Rs) | 15 | - | - | 3 |
| TR(Rs) | - | 26 | - | - |
9.
Complete the following table.
| Price(Rs) | 8 | 6 | 4 | 2 |
|---|---|---|---|---|
| Output (units) | 1 | 2 | 3 | 4 |
| TR(Rs) | - | - | - | - |
| MR(Rs) | - | - | - | - |
10.
Calculate TR and MR from the following data.
| units sold | 1 | 2 | 3 | 4 | 5 | 6 |
|---|---|---|---|---|---|---|
| AR(Rs) | 25 | 23 | 21 | 19 | 18 | 15 |
11.
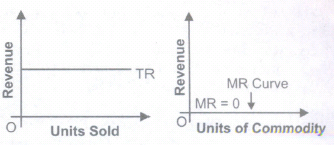
Comment on the shape of the MR curve in case the TR curve is a
(i) positively sloped straight line,
(ii) horizontal straight line.
12.
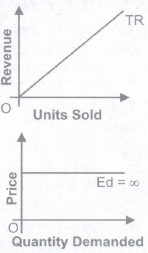
Whatwouldbetheshapeofthe demand curve so that the total revenue curve is
(a) A positively sloped straight line passing through the origin?
(b) A horizontal line?
13.
Compute the total revenue, marginal revenue and average revenue schedules in following table. Market price of each unit of goods is Rs 10.
| Quantity sold | 0 | 1 | 2 | 3 | 4 | 5 | 6 |
| TR(Rs) | |||||||
| AR(Rs) | |||||||
| MR(Rs) |
14.
Define revenue.
15.
When is price (AR) different from MR?
16.
What is the behaviour of average revenue in a market in which a firm can sell more only by lowering the price?
17.
When TR falls, what happens to MR?
18.
Define marginal revenue.
19.
Define total revenue.
1.
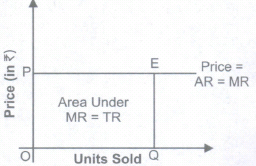
When price of a commodity is constant, Price = AR = MR at all levels of output. Therefore, price line is the same as MR curve. Also, TR = ΣMR. So, the area under MR curve or price line will be equal to TR. In Figure, TR at OQ level of output = OP x OQ = Area under price line.
2.
| Price(Rs) | units sold | TR(Rs)=PxQ | MR(Rs)MRn=TRn-TRn-1 |
|---|---|---|---|
| 12 | 0 | 0 | - |
| 11 | 1 | 11 | 11 |
| 10 | 2 | 20 | 9 |
| 9 | 3 | 27 | 7 |
| 8 | 4 | 32 | 5 |
| 7 | 5 | 35 | 3 |
| 6 | 6 | 36 | 1 |
| 5 | 7 | 35 | -1 |
| 4 | 8 | 32 | -3 |
| 3 | 9 | 27 | -5 |
| 2 | 10 | 20 | -7 |
| 1 | 11 | 11 | -9 |
Note: Putting the various values of price from Rs 12 to Rs 1 in Q = 12 - Px, we get the corresponding values of the quantities demanded (For example, Qx will be 0 when Px = 12).
3.
| Price(Rs)(P) | units sold(Q) | TR(Rs)=PxQ | \(AR(Rs)=\frac{TR}{Q}\) | \(MR(Rs)\frac{\triangle TR}{\triangle Q}\) |
| 1 | 100 | 100 | 1 | -8 |
| 2 | 90 | 180 | 2 | -6 |
| 3 | 80 | 240 | 3 | -4 |
| 4 | 70 | 280 | 4 | -2 |
| 5 | 60 | 300 | 5 | 0 |
| 6 | 50 | 300 | 6 | 2 |
| 7 | 40 | 280 | 7 | - |
(i) MR has been calculated m the reverse order, i.e., from bottom to top.
(ii) MR has been calculated after dividing the change in TR by 10 units (as units sold are given at the gap of 10 units).
4.
| Units sold(Q) | Price(Rs)(P) | TR(Rs)=PxQ | \(AR(Rs)=\frac{TR}{Q}\) | MR(Rs)MRn=TRn-TRn-1 |
|---|---|---|---|---|
| 10 | 1 | 10 | 1 | -8 |
| 9 | 2 | 18 | 2 | -6 |
| 8 | 3 | 24 | 3 | -4 |
| 7 | 4 | 28 | 4 | -2 |
| 6 | 5 | 30 | 5 | 0 |
| 5 | 6 | 30 | 6 | 2 |
| 4 | 7 | 28 | 7 | - |
(i) MR has been calculated in the reverse order, i.e., from bottom to top (As MR is the revenue from the sale of each successive unit).
(ii) MR of the 4th unit has not been calculated as the total revenue from 3 units is not given.
5.
Revenue of a firm refers to receipts from the sale of output in a given period.
Average Revenue: The per unit revenue received from the sale of given amount of output is known as Average Revenue.
Marginal revenue: Marginal revenue is the additional revenue when an additional unit of output is sold.
(i) Average Revenue rises
(ii) Average Revenue is constant and maximum
(iii) Average revenue falls
6.
(i) Relationship between Average Revenue and Marginal Revenue at a same price
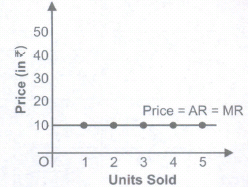
(a) When price remains the same at all output levels, the firm cannot influence the prevailing market price of the commodity. The price is given to it.
(b) It can sell any amount of the commodity at this given price. Under such a case firm's average and marginal revenue remains equal and their curves coincide as shown in given figure.
(ii) Relationship between Average Revenue and Marginal Revenue by lowering the price
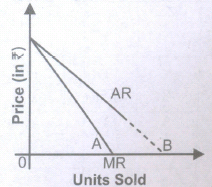
(a) When price falls, with rise in output, then AR falls, MR also falls but at a much faster rate. As a result, the revenue from every additional unit (i.e.MR) will be less than AR.
(b) As a result, both AR and MR curves slope downwards from left to right. This can be explained with the help of given Figure.
7.
| Price (Rs)(P) | Units sold(Q) | TR(Rs)TR=PxQ | MR(Rs)MRn=TRn-TRn-1 | \(AR(Rs)=\frac{TR}{Q}\) |
|---|---|---|---|---|
| 4 | 1 | 4 | 4 | 4 |
| 5 | 2 | 10 | 6 | 5 |
| 6 | 3 | 18 | 8 | 6 |
| 7 | 4 | 28 | 10 | 7 |
8.
| Output (units) | AR | MR | TR |
|---|---|---|---|
| 1 | \(15[\frac{TR}{Q}]\) | 15 | 15[MR at unit 1] |
| 2 | \(13[\frac{TR}{Q}]\) | \(11[\frac{\triangle TR}{\triangle Q}]\) | 26 |
| 3 | 11 | \(7[\frac{\triangle TR}{\triangle Q}]\) | 33[AR x Q] |
| 4 | \(9[\frac{TR}{Q}]\) | 3 | 36[33 + 3] |
9.
| Price (P)(Rs) | Output (units) | TR(Rs)=PxQ | MR(Rs) MRn=TRn-TRn-1 |
|---|---|---|---|
| 8 | 1 | 8 | 8 |
| 6 | 2 | 12 | 4 |
| 4 | 3 | 12 | 0 |
| 2 | 4 | 8 | -4 |
10.
| Units sold (Q) | AR(Rs) | TR(Rs)=PxQ | MR(Rs)=TRn-TRn-1=MRn |
|---|---|---|---|
| 1 | 25 | 25 | 25 |
| 2 | 23 | 46 | 21 |
| 3 | 21 | 63 | 17 |
| 4 | 19 | 76 | 13 |
| 5 | 18 | 90 | 14 |
| 6 | 15 | 90 | 0 |
11.
(i) When TR curve is positively sloped straight line, MR is a horizontal line. MR coincides with the demand curve. Price or AR is constant at each level of output.
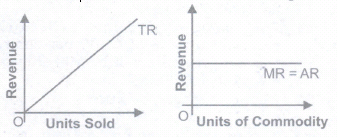
When AR is constant, MR is also constant.
(ii) When TR is a horizontal straight line, MR is zero. It is because horizontal TR means when price falls, quantity demanded rises in the same proportion. Thus, MR is zero. MR curve coincides with the x-axis.
12.
(a) When TR curve is a positively sloping straight line passing through the origin, demand curve (or price line) will be horizontal. It is shown in the shown in the reason is that demand curve is also the price line. When TR is a straight positively sloped line, price at each level of output is constant.
(b) When TR is a horizontal line, demand curve is a rectangular hyperbola. It is shown:
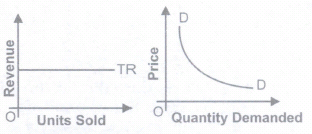
The reason is that, the price at each level of output declines.
13.
| (P) | (Q) | TR=PxQ | AR(Price)= | MRn=TRn-TRn-1 |
| 10 | 0 | 0 | - | - |
| 10 | 1 | 10 | 10 | 10 |
| 10 | 2 | 20 | 10 | 10 |
| 10 | 3 | 30 | 10 | 10 |
| 10 | 4 | 40 | 10 | 10 |
| 10 | 5 | 50 | 10 | 10 |
| 10 | 6 | 60 | 10 | 10 |
14.
()
Revenue of a firm refers to receipts from the sale of output in a given period.
15.
()
Price (AR) is different from MR when more units of a commodity can be sold by reducing the price as in monopoly and monopolistic competition.
16.
()
Average revenue will fall.
17.
()
MR is negative.
18.
()
The amount received from the sale of additional unit of output is known as Marginal Revenue.
19.
()
The amount received from the sale of given amount of output is known as Total Revenue.
For example, if a firm sells 100 chairs at a price of Rs 200 per chair, the total revenue will be 100 Chairs x Rs 200 =Rs 20,000.

11th Standard CBSE Syllabus & Materials
11th Standard CBSE
CBSE 11th Business Studies Forms of Business Organisation Sample Question Papers Study Material - QB365 Set A
NEW11th Standard CBSE
CBSE 11th Business Studies Business, Trade and Commerce Sample Question Papers Study Material - QB365 Set A
NEW11th Standard CBSE
CBSE 11th Physics Waves Sample Question Papers Study Material - QB365 Set A
NEW11th Standard CBSE
CBSE 11th Physics Kinetic Theory Sample Question Papers Study Material - QB365 Set A



CBSE 11th Standard CBSE Subjects
CBSE Standards










