
 100% FREE ACCESS
11th Standard Syllabus & Materials
11th Standard
TN 11th Tamil இயற்கை வேளாண்மை,சுற்றுச்சூழல் -செய்யுள் - மனோன்மணீயம் Important Questions And Answers Study Material - QB365 Set A
NEW11th Standard
TN 11th Tamil என்னுயிர் என்பேன் -துணைப்பாடம் - இசைத்தமிழர் இருவர் Important Questions And Answers Study Material - QB365 Set A
NEW11th Standard
TN 11th Tamil மொழி கலை -செய்யுள் - ஒவ்வொரு புல்லையும் Important Questions And Answers Study Material - QB365 Set A
NEW11th Standard
TN 11th Tamil பீடு பெற நில் - இலக்கணம் - பகுபத உறுப்புகள் Important Questions And Answers Study Material - QB365 Set A
NEW11th Standard
TN 11th Tamil பீடு பெற நில் - துணைப்பாடம் - வாடிவாசல் Important Questions And Answers Study Material - QB365 Set A
NEW11th Standard
TN 11th Tamil பீடு பெற நில் - செய்யுள் - குறுந்தொகை Important Questions And Answers Study Material - QB365 Set A

Published on: 13/09/2019
Download Tamil Nadu 11th Standard Economics question papers, model tests, one-mark questions, important questions, and public exam papers in PDF format. Free study materials and answer keys for TN State Board students.
Questions + Answers key
Take MCQ Economics Test
1.
Which year is treated as 'Year of Population Explosion'?
1941
1961
1921
1931
2.
_____________refers to all those natural resources or gifts in nature which are provided free to man.
Land
Labour
Capital
Organisation
3.
As a factor of production, tools and accessories constitute_____________.
land
labour
capital
enterprise
4.
___________rent disappear, when one of the supply of goods increases.
Scarcity
Differential
Quasi
Transfer
5.
Average Revenue (AR) curves in perfect competition are______________.
Steep
fairly flat
parallel to X-axis
sloping up
6.
The cardinal utility approach was criticised by the English Economist
J.R.Hicks
R.GD. Allen
F.W. Edgeworth
J.M. Keynes
7.
_______ which analyses the interrelationship between economy and Environment.
Rural Economics
Health Economics
Environmental Economics
Developmental Economics
8.
The demand curve slopes upwards from left to right known as
Exceptional demand curve
Shift in demand curve
Extension and contraction demand curve
Steep sloping demand curve
9.
Reward paid to capital is
Interest
Profit
Wages
Rent
10.
The indifference curve are
vertical
horizontal
positive sloped
Negatively sloped
11.
12.
__________ represent Human capital.
Money
Efficiency
Hard work
All the above
13.
The term or word 'Economics' comes from language
Latin
Ancient Greek
Spanish
British
14.
____ is also called as 'Retrospective Cost'.
Floating
Sunk Cost
Economic Cost
Money Cost
15.
The relationship between the price of a commodity and the supply of commodity is
Negative
Positive
Zero
Increase
16.
Identify the correct characteristics of utility
It is equivalent to 'usefulness'
It has moral significance
It is same as pleasure
It depends upon consumer's mental attitude
17.
Growth definition takes into account
The problem of choice in the dynamic framework of Economics
The problem of unlimited means in relation to wants
The production and distribution of wealth
The material welfare of human beings
18.
Money cost is also known as _____ cost.
explicit
implicit
social
real
19.
A scientific study of the characteristics of population is _____
Topography
Demography
Geography
Philosophy
20.
'Economics is a study of mankind in the ordinary business of life' - It is the statement of
Adam Smith
Lionel Robbins
Alfred Marshall
Samuelson
21.
Write the various aspects of demographic trends in India
22.
What is meant by marginal rate of substitution?
23.
Define "Quasi Rent" in the words of Alfred Marshall.
24.
Define Average product?
25.
Classify the market based on the competitions?
26.
Mention any two types of price discrimination.
27.
Give the meaning of deductive method.
28.
Explain ordinal utility approach.
29.
Explain the importance of microeconomics.
30.
What is meant by density of population? State the nature of density of population in India.
31.
What are the determinants of Demand? Explain.
32.
Explain the Marginal Productivity Theory of Wage.
33.
Explain the concept of 'cost minimization!
34.
35.
Discuss Thiruvalluvar's contribution to Indian economy.
36.
Explain the 'Indifference curve Analysis' with the help of diagrams.
37.
Define Total Revenue and Explain its behaviour when the price is constant and when the price is declining.
38.
State the welfare definition given by Alfred Marshall and assess it.
39.
Explain the law of Equi-marginal utility
40.
41.
Discuss the short run cost curves with suitable diagram.
1.
(b)
1961
2.
(a)
Land
3.
(c)
capital
4.
(c)
Quasi
5.
(c)
parallel to X-axis
6.
(c)
F.W. Edgeworth
7.
(c)
Environmental Economics
8.
(a)
Exceptional demand curve
9.
(a)
Interest
10.
(d)
Negatively sloped
11.
(a)
12.
(a)
Money
13.
(b)
Ancient Greek
14.
(b)
Sunk Cost
15.
(b)
Positive
16.
(d)
It depends upon consumer's mental attitude
17.
(a)
The problem of choice in the dynamic framework of Economics
18.
(a)
explicit
19.
(b)
Demography
20.
(c)
Alfred Marshall
21.
Various aspects of demographic trends in India are:
(i) Size of population
(ii) Rate of growth
(iii) Birth and death rates
(iv) Density of population
(v) Sex-ratio
(vi) Life-expectancy at birth
(vii) Literacy ratio
22.
The shape of an indifference curve provides useful information about preferences. Indifference curve replaces the concept of marginal utility with the concept of the marginal rate of substitution.
23.
Alfred Marshall introduced the concept of Quasi-Rent. He defined "Quasi-Rent is the income derived from machines and other appliances made by man".
24.
The result of the total product divided by the total units of the input employed. In other words, it refers to the output per unit of the input.
Mathematically; AP = TP/N
Where,
AP = Average Product
TP = Total Product
N = Total units of inputs employed.
25.
(a) Monopoly - Single
(b) Duepoly - Two seller
(c) Oligopoly - A few sellers
26.
Personal - Different prices are charged for different individuals. (eg) railway
Geographical - Different prices are charged at different places for the same product.
27.
(i) In deductive method we move from general to particular.
(ii) It is also called as analytical (or) abstract method.
28.
F. W. Edgeworth and Vilfredo Pareto criticised the Cardinal Utility Approach. It is otherwise called "Indifference Curve Approach". J. R. Hicks and R.G.D. Allen Approach. J. R. Hicks in his book "Value and Capital" gave a final shape to this "Indifference Curve Analysis".
Scale of Preference: This theory is also based on scale of preference. A rational consumer usually prefers the combination of goods which gives him maximum level of satisfaction. Thus, the consumer can arrange goods and their combination in order of their satisfaction.
Such an arrangement of combination of goods in the order of level of satisfaction is called the "Scale of Preference".
Assumptions:
(i) It assumes that the consumer possesses 'complete information' about all the relevant aspects of economic environment.
(ii) Consumer behaves rationally.
(iii) It also assumes 'continuity'. This means that the consumers are capable of ordering or ranking all combination of goods.
(iv) The consumer is not interested in anyone commodity as that utility analysis, but is a combination of goods.
(v) It assumes that the consumer has before him in indifference map for a pair of commodities.
(vi) The prices of these goods are given in the market and are assumed to be constant.
29.
The importance of microeconomics are:
(i) To understand the operation of an economy.
(ii) To provide tools for economic policies.
(iii) To examine the condition of economic welfare.
(iv) Efficient utilization of resources.
(v) Useful in international trade.
(vi) Useful in decision making.
(vii) Optimal resource allocation.
(viii) Basis for prediction.
(ix) Price determination.
(x) Calculated to promote efficiency in production and the welfare of the masses.
(xi) Useful in public finance.
30.
Density of population: It refers to the average number of persons residing per square kilometre. It represents the man-land ratio. As the total land area remains the same, an increase in population causes density of population to rise.
Density of population = \(\frac { Total\ population }{ Land\ area\ of\ the\ region } \)
Table: Density of population
| Year | Density of population (No. of persons per sq. km) |
| 1951 | 117 |
| 2001 | 325 |
| 2011 | 382 |
(i) Just before Independence, the density of population was less than 100.
(ii) But after independence, it has increased rapidly from 117 in 1951 to 325 in 2001.
(iii) According to 2011 census, the present Density of population is 382. Thus, the pressure of population on land has been rising.
(iv) Kerala, West Bengal, Bihar and Uttar Pradesh have density higher than the India's average density.
(v) Bihar is the most densely populated state in the country with 1,102 persons living per sq. km followed by West Bengal with 880.
(vi) Arunachal Pradesh has low density of population of only 17 persons.
31.
Determinants of Demand:
(1) Changes in Tastes and Fashions: The demand for some goods and services is very susceptible to changes in tastes and fashions
(2) Changes in Weather: An unusually dry summer results in a increase in the demand for cool drinks.
(3) Taxation and Subsidy: If fresh taxes are levied or the existing rates of taxation on commodities are increased their prices go up. The subsidies will bring down the prices. Therefore taxes reduce demand and subsidies raise demand.
(4) Changes in Expectations: Expectations also bring about a change in demand. Expectation of rise in price in future results in increase in demand.
(5) Changes in Savings: Savings and demand are inversely related.
(6) State of Trade Activity: During the periods of boom and prosperity, the demand for all commodities tends to increase. On the contrary, during times of depression there is a general slackening of demand.
(7) Advertisement: In advanced capitalistic countries advertising is a powerful instrument increasing the demand in the market.
(8) Changes in Income: An increase in family income may increase the demand for durables like video recorders and refrigerators. Equal distribution of income enables poor to get more income. As a result consumption level increases.
(9) Change in Population: The demand for goods depends on the size of population. An increase in population tends to increase the demand for goods and a decrease in population tends to decrease the demand (if other things remain constant).
32.
(i) The application of general theory of distribution to wage fixation is the marginal productivity theory of wages.
(ii) According to the theory wages are determined by the marginal productivity of labour and equal to it at the point of equilibrium.
(iii) Under perfect competition wage is paid equal to marginal product of labour (wage = MPL). But in real world where there is imperfect competition, there is exploration of labour and wage is less than MPL.
33.
(i) As the profit is the difference between total revenue and total cost.
(ii) Cost minimization is a necessary condition for achieving the profit maximization goal of the firm.
(iii) Cost minimization implies that the costs of inputs have to be reduced for the purpose.
(iv) The costs of inputs include the prices of raw materials, wages and salaries of labour, expenditure on machinery and equipment, depreciation on machines etc.
34.
35.
Thiruvalluvar: The economic ideas of Thiruvalluvar are found in his immortal work, Thirukkural, a book of ethics. Even though scholars differ widely over the estimation of the period of Thiruvalluvar, it is generally believed that, he belongs to the Sangam age in Tamil Nadu around third century A.D. Thiruvalluvar's work is marked by pragmatic idealism. A large part of Valluvar's economic ideas are found in the second part of Thirukkural, the porutpal. It deals with wealth. Thiruvalluvar is a fundamental thinker. He believes that rains are the basic support of life. Since rain provides food, it forms the basis for stable economic life. Agriculture which is the most fundamental economic activity depends on rain, "It is rain that both ruins and aids the ruined to rise".
(i) Factors of Production: Thiruvalluvar has made many passing references about the factors of production viz., Land, Labour, Capital, Organisation, Time, Technology etc. He says, "Unfailing harvest, competent body of men, group of men, whose wealth knows no diminution, are the components of an economy". (KuraI61)
(ii) Agriculture: According to Thiruvalluvar, agriculture is the most fundamental economic activity. They are the axle-pin of the world, for on their prosperity revolves prosperity of other sectors of the economy, 'The ploughmen alone', he says "live as the freemen of the soil; the rest are mere slaves that follow on their toil" (Kural 1032). Valluvar believes that agriculture is superior to all other occupation.
(iii) Public Finance: Thiruvalluvar has elaborately explained Public Finance under the headings Public Revenue, Financial Administration and Public expenditure. He has stated these as
1) Creation of revenue,
2) Collection of revenue,
3) Management of revenue
4) Public expenditure
(iv) Public Expenditure: Valluvar has recommended a balanced budget. "It is not a great misfortune for a state if its revenues are limited, provided the expenditure is kept within bounds." He has given certain guidelines for a budgetary policy. "Budget for a surplus, if possible, balances the budget at other times, but never budget for a deficit." Valluvar advocates the following main items of public expenditure:
1) Defence
2) Public Works and
3) Social Services.
(v) External Assistance: Valluvar was against seeking external assistance. According to Kural No. 739, countries taking external assistance are not to be considered as countries at all. In other words, he advocated a self-sufficient economy.
(vi) Poverty and Begging: Valluvar consideres freedom from hunger as one of the fundamental freedoms that should be enjoyed by every citizen. According to him 'poverty' is the root cause of all other evils which would lead to ever-lasting sufferings. It is to be noted that the number of people living below poverty line, begging, sleeping on the road sides and rag picking in India has been increasing.
(vii) Wealth: Valluvar has regarded wealth as only a means and not an end. He said, "Acquire a great fortune by noble and honourable means." He condemned hoarding and described hoarded wealth as profitless richness. To him industry is real wealth and labour is the greatest resource.
(viii) Welfare State: Thiruvalluvar is for a welfare state. In a welfare state there will be no poverty illiteracy, disease and industry. The important elements of a welfare state are
1) perfect health of the people without disease
2) abundant wealth
3) good crop
4) prosperity and happiness and
5) full security for the people.
36.
INDIFFERENT CURVE ANALYSIS:
Scale of preference:
This theory is also based on scale of preference. A rational consumer usually prefers the combination of goods which gives him maximum level of satisfaction. Thus, the consumer can arrange goods and their combination in order of their satisfaction. Such an arrangement of combination of goods in the order of level of satisfaction is called the "Scale of Preference". Assumptions :
1. The consumer is rational and his aim is to derive maximum satisfaction.
2. Utility cannot be cardinally measured, but can be ranked or compared or ordered by ordinal number such as I, II, III and so on.
3. The Indifference Curve Approach is based on the concept "Diminishing Marginal Rate of Substitution".
4. The consumer is consistent, This assumption is called as the assumption of transitivity. If the consumer prefers combination A to B and B to C, then he should prefer A to C. If A > B and B > C, then A > C.
An Indifference Schedule: An indifference schedule may be defined as a schedule of various combinations of two commodities which will give the same level of satisfaction. In other words, indifference Schedule is a table which shows the different combination of two goods that gives equal satisfaction to the consumer.
Indifference Schedule
| Apple | Orange |
| 1 2 3 4 5 |
20 15 12 10 9 |
Table has five combinations of two commodities. Apple and Orange. Each of these combinations give the consumer the same level of satisfaction without discrimination. In the schedule, the combinations are arranged in such a way that the consumer is indifferent among the combinations. Hence, this schedule is called as, "Indifference Schedule". He will neither be better off nor worse off whichever combination he chooses.
An Indifference Curve
Different combinations of two commodities (as found in Indifference Schedule) can be presented in a diagram. Then consumer gets different points and when such points are connected, a curve is obtained. The said curve is called as "Indifference Curve".
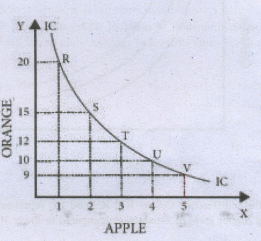
Therefore, an indifference curve is the locus of all combinations of commodities from which the consumer derives the same level of satisfaction. It is also called "Iso-Utility Curve" or Equal Satisfaction Curve". Indifference Curve is illustrated in diagram. X axis represents apple and Y axis represents orange. Point : R' represents combination of 1 apple and 20 oranges, at'S' 2 apples and 15 oranges and at 'T; 3 apples and 12 oranges. Similarly UV points are obtained. These five points give the same level of satisfaction. The consumer will be neither better off nor worse off in choosing anyone of these points. When one joins all these five points (RS, T) U and V one can get the Indifference Curve: IC'.
An Indifference Map :
One can draw several indifference curves each representing an indifference schedule. Hence, an Indifference Map is a family or collection or set of indifference curves corresponding to different levels of satisfaction. The Indifference Map is illustrated in Diagram
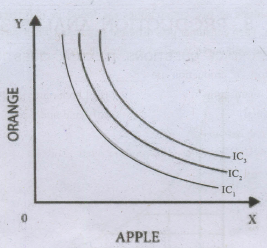
In the diagram, the indifference Curves \({ IC }_{ 1 }\)' \({ IC }_{ 2 }\) and \({ IC }_{ 3 }\) represent the Indifference Map, Upper IC representing higher level of satisfaction compared to lower IC.
37.
Total Revenue:
Total revenue is the amount of income received by the firm from the sale of its products. It is obtained by multiplying the price of the commodity by the number of units sold.
TR = p x Q
where, TR denotes Total Revenue, P denotes Price and
Q denotes Quantity sold.
For example, a cell-phone company sold 100 cell-phones at the price of t500 each. TR is
Rs.50,000. (TR= 500 x 100 = 50,000).
Total Revenue - Constant Price
| Quantity sold (Q) |
Price (P) |
Total Revenue (TR) |
|
1 |
5 |
5 10 15 20 2 30 |
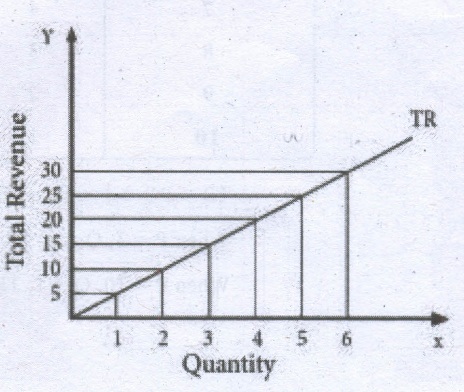
When price is constant, the behaviour of TR is shown in the table and the diagram, assuming P = 5. When P = 5; TR = PQ
When price is declining with increase in quantity sold. (Eg. Imperfect Competition on the goods market) the behaviour of TR is shown in the table and in the diagram. TR can be obtained from Demand function: If Q = 11-P, When P = 1, Q = 10
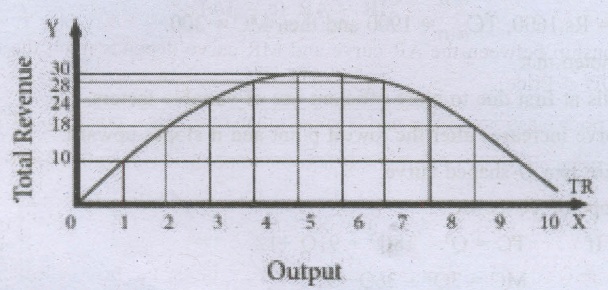
Total Revenue - Price declining
| Quantity sold (Q) | Price (P) | Total Revenue (TR) |
|
1 |
10 |
10 |
TR = PQ = 1 x 10 = 10
When P = 3, Q = 8, TR = 24
When P = 10, Q = 1, TR = 10
38.
Welfare Definition :
Alfred Marshall Alfred Marshall (1842-1924) in his book "Principles of Economics" (1890) defines Economics thus: "Political Economy" or Economics is a study of mankind in the ordinary business of life; it examines that part of individual and social action which is most closely connected with the attainment and with the use of the material requisites of well-being. Thus, it is on one side a study of wealth; and on the other, and more important side, a part of the study of man.
The important features of Marshall's definition are:
(a) Economics does not treat wealth as the be-all and end-all of economic activities. Man promotes primarily welfare and not wealth.
(b) The science of Economics contains the concerns of ordinary people who are moved by love and not merely guided or directed by the desire to get maximum monetary benefit,
(c) Economics is a social science. It studies people in the society who influence one another.
Criticism
(a) Marshall regards only material things. He does not consider immaterial things, such as the services of a doctor, a teacher and so on. They also promote people's welfare.
(b) In the theory of wages, Marshall ignores the amount of money that goes as reward for the services of 'immaterial' services.
(c) Marshall's definition is based on the concept of welfare. But it is not clearly defined. Welfare varies from person to person, country to country and one period to another. Marshall clearly distinguishes between those things that are capable of promoting welfare of people and those things that are not. Things like liquor that are not capable of promoting welfare but command a price, come under the purview of Economics.
(d) However, welfare means happiness or comfortable living conditions of an individual or group of people. The welfare of an individual or nation is dependent not only on the stock of wealth possessed but also on political, social and cultural activities of the nation.
39.
Introduction:
(i) The law of diminishing marginal utility was extended and is called Law of Equi-marginal utility
(ii) Law of substitution or Law of consumer's Equilibrium or Gossen's II law or law of maximum satisfaction.
Definition:
Marshall, "If a person has a thing which he can put to several uses, he will distribute it among these uses in such a way that it has the same marginal utility in all. For, if it had a greater marginal utility in one use than another, he would gain by taking away some of it from the second use and applying it to first.
Assumption
(i) Consumer is rational and wants maximum satisfaction.
(ii) Utility is measurable in cardinal numbers.
(iii) Marginal utility of money is constant.
(iv) Income of the consumer is given.
(v) There is perfect competition.
(vi) Price is given.
(vii) Law of diminishing marginal utility operates
Explanation:
(i) The consumer has Rs. 11.
(ii) He wants to spend it on apple ( Rs 1 each) and orange (Rs. 1 each)
(iii) He will be in equilibrium only when he gets maximum satisfaction ie.
\(\mathrm{K}=\frac{\text { Marginal utility of apple }}{\text { Price of apple }}=\frac{\text { Marginal utility of orange }}{\text { Price of orange }}\)
If is \(\frac{\mathrm{MU_A}}{\mathrm{P_A}}\) less than \(\frac{\mathrm{MU_O}}{\mathrm{P_O}}\) he would transfer money from apple to orange till it is equal.
He should buy 6 units of apple & 5 units of oranges. He gets (92 + 58) = 150 units satisfaction.
\(\frac{\mathrm{MU_A}}{\mathrm{P_A}}=\frac{\mathrm{MU_O}}{\mathrm{P_O}}=\frac{4}{1}=\frac{4}{1}\)
| Apple | orange | |||
| Units of Commodities | Total Utility | marginal Utility | Total Utility | marginal Utility |
| 1 | 25 | 25 | 30 | 30 |
| 2 | 45 | 20 | 41 | 11 |
| 3 | 63 | 18 | 49 | 8 |
| 4 | 78 | 15 | 54 | 5 |
| 5 | 88 | 10 | 58 | 4 |
| 6 | 92 | 4 | 61 | 3 |
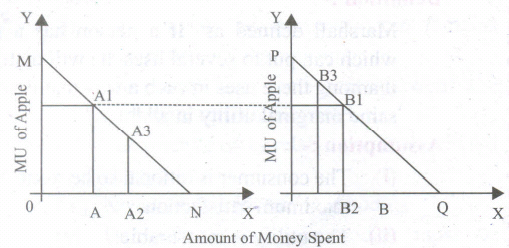
Explanation:
(i) X axis shows amount of money spent
(ii) Y axis shows marginal utility of apple and orange.
(iii) If consumer spends Rs.6 on apple and Rs.5 on orange MU will be equal.
(iv) ie. AA1 = BB1 = 4 = 4. So he gets maximum utility.
Criticisms:
(i) Utility cannot be measured.
(ii) No consumer compares the utility and disutility from each unit of the commodity while buying it.
(iii) This law cannot be applied to durable goods.
Conclusion:
(i) The law of Equi-marginal utility is an improvement over the law of diminishing marginal utility because it can be used for many commodities consumed at the same time.
40.
41.
Average fixed cost:
1. It refers to the fixed cost per unit of output.
2. It declines as output increases as fixed cost is constant.
3. It never touches the axis.
4. It is rectangular hyperbola.
.JPG)
Average variable cost:
1. It is the variable cost per unit of output.
2. It initially declines and then increases with the increase of output
3. This is due to law of returns.
4. AVC curve is a 'U' shaped curve.
.JPG)
Average total cost or average cost:
1. It is got by dividing TC by Q or by adding AFC and AVC.
2. It is u shaped.
3. Initially it declines, reaches minimum when the plant is used optimally & rises beyond the optimum output.
4. This is due to the law of variable proportions.
.JPG)
Marginal cost:
1. It is the change in total cost resulting from producing one extra unit of output.
2. First it falls due to more efficient use of variable factors.
3. It increases after the lowest point and it slopes upward.
4. It is 'u' shaped.
.JPG)
| Q (in unit) | TFC in (Rs) | TVC in (Rs) | TC in (in Rs)TFC + TVC | ATC (TC/Q)(in Rs) | AFC in(Rs) | AVC in(Rs) | ATC (AFC + AVC)(in Rs) |
| 0 | 1000 | 0 | 1000 | α | 0 | 0 | 0 |
| 1 | 1000 | 200 | 1200 | 1200 | 1000 | 200 | 1200 |
| 2 | 1000 | 300 | 1300 | 650 | 500 | 150 | 650 |
| 3 | 1000 | 400 | 1400 | 466 | 333 | 133 | 466 |
| 4 | 1000 | 600 | 1600 | 400 | 250 | 150 | 400 |
| 5 | 1000 | 900 | 1900 | 380 | 200 | 180 | 380 |

11th Standard Syllabus & Materials
11th Standard
TN 11th Tamil பீடு பெற நில் - செய்யுள் - காவடிச்சிந்து Important Questions And Answers Study Material - QB365 Set A
NEW11th Standard
TN 11th Tamil பீடு பெற நில் - உரைநடை - மலை இடப்பெயர்கள் : ஓர் ஆய்வு Important Questions And Answers Study Material - QB365 Set A
NEW11th Standard
TN 11th Tamil மாமழை போற்றுதும் - துணைப்பாடம் - யானை டாக்டர் Important Questions And Answers Study Material - QB365 Set A
NEW11th Standard
TN 11th Tamil மாமழை போற்றுதும் - செய்யுள் - ஐங்குறுநூறு Important Questions And Answers Study Material - QB365 Set A



Tamilnadu Stateboard 11th Standard Subjects

Maths

Commerce
Economics

Biology

Business Maths and Statistics

Accountancy

Computer Science

Physics

Chemistry
Maths
Biology
Economics
Physics
Chemistry

History
Business Maths and Statistics

Computer Science
Accountancy

Computer Applications
History
Computer Technology
Commerce
Computer Applications
Computer Technology

Tamil

English

French
Tamilnadu Stateboard Standards
