
 100% FREE ACCESS
11th Standard CBSE Syllabus & Materials
11th Standard CBSE
CBSE 11th Economics PART-A - Presentation of Data - New Sample Question Papers Study Material - QB365 Set A
NEW11th Standard CBSE
CBSE 11th Economics PART-A - Organisation of Data - New Sample Question Papers Study Material - QB365 Set A
NEW11th Standard CBSE
CBSE 11th Economics PART-A - Collection of Data - New Sample Question Papers Study Material - QB365 Set A
NEW11th Standard CBSE
CBSE 11th Economics PART-A - Introduction to Economics and Statistics - New Sample Question Papers Study Material - QB365 Set A
NEW11th Standard CBSE
CBSE 11th Business Studies International Trade Sample Question Papers Study Material - QB365 Set A
NEW11th Standard CBSE
CBSE 11th Business Studies Evolution and Fundamentals of Business Sample Question Papers Study Material - QB365 Set A

Published on: 05/03/2020
11th Standard CBSE Economics Annual Exam Model Question 2020
Download CBSE Class 11th Standard CBSE undefined question papers, sample papers, important questions, and previous year solved papers in PDF format. Get free study materials, NCERT solutions, and exam preparation resources for Class 11th Standard CBSE undefined
Questions + Answers key
Take MCQ Biology Test
1.
Which values are of utmost importance in making of a project?
2.
The yield of wheat and rice per acre for4 10 districts of a state is as under:
| District | 1 | 2 | 3 | 4 | 5 | 6 | 7 | 8 | 9 | 10 |
| Wheat | 12 | 10 | 15 | 19 | 21 | 16 | 18 | 9 | 25 | 10 |
| Rice | 22 | 29 | 12 | 23 | 18 | 15 | 12 | 34 | 18 | 12 |
Calculate for each crop
(i) Range
(ii) Q.D.
(iii) Mean deviation about mean
(iv) Mean deviation about median
(v) Standard deviation
(vi) Which crop has greater variation?
(vii) Compare the values of different measures for each crop.
3.
Why do we need an index number?
4.
What are the requisites of an ideal average?
5.
Equilibrium price of an essential medicine is too high. Explain what possible steps can be taken to bring down the equilibrium price but only through the market forces. Also, explain the series of changes that will occur in the market.
6.
How is correlation different from causation?
7.
Convert the series given below into exclusive series.
| Age | No of Students |
| (x) | (f) |
| 0-9 | 3 |
| 10-19 | 4 |
| 20-29 | 10 |
| 30-39 | 7 |
| 40-49 | 6 |
8.
What are the functions of a graph?
9.
From the data given below, find Q1 and Q3.
| Mid Values | 10 | 20 | 30 | 40 | 50 | 60 |
| Frequency | 3 | 5 | 8 | 6 | 5 | 3 |
10.
What are the essentials of a good statistical table? Using an imaginary example, indicate different parts of a table.
11.
Explain in brief steps involved in construction of a pie diagram.
12.
Compare between perfect competition and monopoly.
13.
Explain why will a producer not be in equilibrium if the conditions of equilibrium are not met.
14.
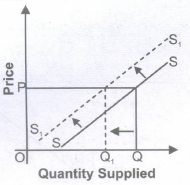
Explain different types of non random sampling methods in short.
15.
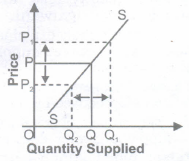
Distinguish between change in quantity supplied and change in supply. Use diagram.
16.
Statistics is indispensible in every field. Explain.
17.
What are the different phases in the Law of Variable Proportions in terms of marginal product? Give reason behind each phase. Use diagram.
18.
Differentiate between Economics as a positive and as a normative Science.
19.
The total fixed cost of a firm is Rs.12. Given below is its marginal cost schedule. Calculate total cost and average variable cost for each given level of output.
| Output | 1 | 2 | 3 | 4 | 5 | 6 |
|---|---|---|---|---|---|---|
| Marginal Cost(Rs.) | 9 | 7 | 2 | 4 | 8 | 12 |
20.
Explain the implications of large number of sellers in a perfectly competitive market.
21.
From the schedule provided below calculate the total revenue, demand curve and the price elasticity of demand:
| Quantity | 1 | 2 | 3 | 4 | 5 | 6 | 7 | 8 | 9 |
| Marginal Revenue | 10 | 6 | 2 | 2 | 2 | 0 | 0 | 0 | -5 |
22.
There is given the price of a good, how does a consumer decide as to how much quantity of that goods to buy?
23.
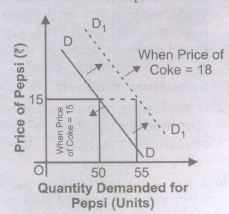
Explain with the help of diagrams, the effect of the following changes on the demand of a commodity:
(i) A rise in price of Substitute good.
(ii) A rise in price of Complementary good.
24.
Discuss the central problems of an economy
25.
Which of the following is a tool for analysis of data?
Tables
Histogram
Mean
All of the above
26.
What do you call the partition value which divides the series into two equal parts?
Upper quartile
Lower quartile
Mode
Median
27.
Upper limit of any class is:
Same
Different
Both (a) and (b) are possible
None of these
28.
The algebraic sum of deviations of 8,3,7 from the Arithmetic Mean viz., 6 is:
-1
0
1
5
29.
Of the following measures, which can measure Qualitative variable?
Karl Pearson's coefficient of correlation
Scatter diagram
Spearman's rank correlation
All of the above
30.
Which measure is based on only the central fifty percent of the observations?
Standard deviation
Mean deviation
Quartile deviation
All these measures
31.
A frequency polygon is obtained by:
Constructing a frequency histogram
Constructing a cumulative frequency histogram
Linking the mid-points from a frequency histogram
Using a line graph
32.
Whether classification is done first or tabulation?
Classification follows tabulation
Both are done simultaneously
Classification precedes tabulation
No criterion
33.
With a given supply curve a decrease in demand causes
an overall decrease in price but an increase in equilibrium quantity
an overall increase in price but a decrease in equilibrium quantity.
an overall decrease in price and a decrease in equilibrium quantity
no change in overall price but a reduction in equilibrium quantity
34.
The most appropriate diagram to represent the data relating to components of cost of production is:
Frequency polygon
Pie diagram
Histogram
Line graph
35.
If MC is more than MR at a particular level of output, how will the producer react to maximize the profits________________
Decrease Production
Increase Production
Increase Revenue
None of these
36.
Price discrimination is one of the features of________
monopolistic competition
monopoly
perfect competition
oligopoly
37.
Which of the following statement is true?
Statistics deals with all kinds of data
Statistics can be used by one and all.
It is very difficult to misuse statistics
Statistics can mould data to make god or devil from it.
38.
What is the root cause of all economic problems?
Scarcity
Excess Demand
Excess Supply
Deficient Demand
39.
A good questionnaire should have questions which are:
Not personal
Well ordered
Logical
All the above
40.
Which one of the following options is not a characteristic of a perfectly competitive market?
Large number of firms in the industry
Outputs of the firms are perfect substitutes for one another
Firms face downward-sloping demand curves
Resources are very mobile.
41.
Supply is the
limited resources that are available with the seller.
cost of producing a good.
entire relationshipbetweenthe quantity supplied and the price of good
willingness to produce a good if the technology to produce it becomes available
42.
How does TR change with output when MR is negative?
TR falls with the increase in output
TR rise with the increase in output
TR falls with the decrease in output
None of these.
43.
If the average cost is falling,
marginal cost is rising
marginal cost is falling
marginal cost is equal to average cost
it is impossible to tell if marginal cost is rising or falling
44.
The short run, as economists use the phrase, is characterized by:
At least one fixed factor of production and firms neither leaving nor entering the industry.
A period where the law of diminishing returns does not hold.
No variable inputs-that is all the factors of production are fixed.
All inputs being variable.
45.
When income of the consumer falls the impact on price-demand curve of an inferior good is:
Shifts to the right.
Shifts to the left.
There is upward movement along the curve
There is downward movement along the curve.
46.
The price elasticity of demand is defined as the responsiveness of:
price to a change in quantity demanded.
quantity demanded to a change in price
price to a change in income.
quantity demanded to a change in income
47.
Which of the following options is a property of an indifference curve?
It is convex to the origin
The marginal rate of substitution is constant as you move along an indifference curve
Marginal utility is constant as you move along an indifference curve.
Total utility is the greatest where the 45 degrees line cuts the indifference curve
48.
Which one of the following alternatives illustrate a decrease in unemployment using the PPF?
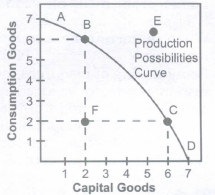
A movement down along the PPF.
A rightward shift of the PPF.
A movement from a point on the PPF to a point inside the PPF.
A movement from a point inside the PPF to a point on the PPF.
49.
Explain the effects of 'maximum price ceiling' on the market of a good. Use diagram.
50.
What do you mean by a statistical project?
51.
The Consumer price index in India is continuously rising over the year 2012 and 2013. Which value is compromised with the rising wholesale price index?
52.
Find Mean and standard deviation from the following series.
| Daily Income | No of families |
| Less than 100 | 5 |
| 100-200 | 9 |
| 200-300 | 12 |
| 300-400 | 2 |
| 400 and above | 2 |
53.
What is weighted mean? When is it useful?
54.
What do you mean by positive and negative correlation?
55.
What are the main objectives of tabulation?
56.
What kind of diagrams are more effective in representing the following?
(a) Monthly Rainfall in a year
(b) Composition of population of Delhi by Religion
(c) Components of cost in a factory
57.
Find median from the data given below:
| Wages (per hour): | 20 | 25 | 30 | 35 | 40 | 45 | 50 |
| Number of Workers: | 5 | 7 | 6 | 10 | 5 | 4 | 4 |
58.
Explain different types of two-dimensional diagrams.
59.
What is meant by price rigidity, under oligopoly.
60.
"MC should be rising at the point of Producer's Equilibrium". Comment.
61.
"All statistics are numerical facts but all numerical facts are not statistics." Explain.
62.
Name different methods of sampling. Explain anyone.
63.
Economists are money minded people who are concerned with profits and profits only. Defend or refute. Justify your answer.
64.
Calculate TR, AR and MR from the following data.
| Units sold | 10 | 9 | 8 | 7 | 6 | 5 | 4 |
| Price(Rs) | 1 | 2 | 3 | 4 | 5 | 6 | 7 |
65.
"In perfect competition, industry is the price maker and firm is the price taker." Discuss.
66.
Explain effect of technological changes on supply of a product.
67.
Why do household buy more at a lower price than at a higher price?
68.
Price elasticity of demand for a product is 'unity'. A household buys 25 units of this product at the price of RS 5 per unit. If the price of product rises by Rs 1, how much quantity of the product will the household buy?
69.
If the total product curve is a straight line through the 'origin, what would be the shape of the average product and marginal product curves look like?
70.
Define cost. State the relation between marginal cost and average variable cost.
71.
What will be the impact of recently launched 'Clean India Mission' (Swachh Bharat Mission) on the Production Possibilities curve of the economy and why?
72.
A consumer consumes only two goods X and Y. At a consumption level of these two goods, he finds that the ratio of marginal utility to price in case of X is higher than that in case of Y. Explain the reaction of the consumer.
1.
(a) Originality: Project must not be copied but an original work of investigator.
(b) Sample Selection: Sample must be randomly selected. There must not be any bias in selection of the sample else the entire motto of preparing project will defeat.
(c) Decision Making: Many decisions are required to be taken in making of a project. Therefore, decision making is another important value.
(d) Communication Skills: In order to get information from people, one needs to be tactful. It calls for good communication skills.
2.
For Wheat
Range = L - S = 25 - 9 = 16
\(Q.D={Q_3-Q_2\over2}\)
First we need to arrange this data in ascending or descending order.
| 9 | 10 | 10 | 12 | 15 | 16 | 18 | 19 | 21 | 25 |
\(Q_1={N+1\over4}th \ item\)
\(={10+1\over4}th \ item\)
=2.75th item
Since 2 and 3 item are equal therefore,
Q1 =10
\(Q_3={3(N+1)\over4}th \ item\)
= 7.25th item
= 18 + (19 - 18) x 0.75 = 18.75
Q.D=\({18.75-10\over 2}=4.375\)
M.D. about Mean
| x | I X-Mean l =D | D2 |
| 9 | 6.5 | 42.25 |
| 10 | 5.5 | 30.25 |
| 10 | 5.5 | 30.25 |
| 12 | 3.5 | 12.25 |
| 15 | 0.5 | 0.25 |
| 16 | 0.5 | 0.25 |
| 18 | 2.5 | 6.25 |
| 19 | 3.5 | 12.25 |
| 21 | 5.5 | 30.25 |
| 25 | 9.5 | 90.25 |
| Total | \(\sum D=43\) | \(\sum D^2=354.5\) |
Mean=\({\sum X\over N}={155\over10}=15.5\)
\(M.D.={\sum |D|\over N}\)
M.D. = 43/10 = 4.3
Mean Deviation about Median
\(Median ={N+1\over 2}th \ item\)
\(={10+1\over 2}th \ item\)
= 5.5th item
Median = 15.5
Since Mean and Median are equal therefore, M.D. from mean and median will also be equal.
\(S.D=\sqrt{\sum D^2\over N}=\sqrt{35435\over10}\)
= 5.43 snesh
Coefficient of Variation
=\({S.D\over Mean}\times 100\)
\(={5.43\over 15.5}\times 100=29.45\%\)
For Rice
Range = L - S = 34 - 12 = 22
\(Q.D={Q_3-Q_2\over2}\)
First we need to arrange this data in ascending or descending order.
| 12 | 12 | 12 | 15 | 18 | 18 | 22 | 23 | 29 | 34 |
\(Q_1={N+1\over4}th \ item\)
\(={10+1\over4}th \ item\)
=2.75th item
Since 2 and 3 item are equal therefore ,
Q1 =12
\(Q_3={3(N+1)\over4}th \ item\)
= 7.25th item
= 22 + (23 - 22) x 0.75
= 22.75
\(Q.D.={22.75-12\over2}\)
\(={10.75\over2}=5.375\)
M.D. about Mean
| X | I X-Mean l =D | D2 |
| 12 | 7.5 | 56.25 |
| 12 | 7.5 | 56.25 |
| 12 | 7.5 | 56.25 |
| 15 | 4.5 | 20.25 |
| 18 | 1.5 | 2.25 |
| 18 | 1.5 | 2.25 |
| 22 | 2.5 | 6.25 |
| 23 | 3.5 | 12.25 |
| 29 | 9.5 | 90.25 |
| 34 | 14.5 | 210.25 |
| Total | \(\sum D=60\)\(\) | \(\)\(\sum D^2=512.5\) |
\(Mean={\sum X\over N}={195\over 10}=19.5\)
\(M.D={\sum |D|\over N}\)
M.D. = 60/10 = 6
Mean Deviation about Median
\(Median={N+1\over2}th \ item\)
\(={10+1\over2}th \ item\)
= 5.5th item
Since 5th and 6th item are equal, 5.5th item
= 18. Median is 18.
| X | IX - Median I = D |
| 12 | 6 |
| 12 | 6 |
| 12 | 6 |
| 15 | 3 |
| 18 | 0 |
| 18 | 0 |
| 22 | 4 |
| 23 | 5 |
| 29 | 11 |
| 34 | 16 |
| Total | \(\sum D=57\) |
\(M.D={\sum |D|\over N}\)
M.D. = 57/10 = 5.7
\(S.D=\sqrt{\sum D^2\over N}\)
\(=\sqrt{512.5\over10}=7.16\)
Coefficient of Variation
\(={S.D\over Mean}\times 100\)
\(={7.16\over19.5}\times 100=36.72\%\)
3.
We need an index number because:
Index numbers are indispensable tools of economics and business analysis.
Following are the main uses of index numbers.
1. Index numbers are used as economic barometers: Index number is a special type of averages which helps to measure the economic fluctuations on price level, money market, economic cycle like inflation, deflation etc.
2. They are useful in forecasting future economic activity: Index numbers are used not only in studying the past and present workings of our economy but also important in forecasting future economic activity. Index numbers measure the purchasing power of money. Index of Exports and Imports provides relevant information regarding foreign trade and accordingly government can formulate its export-import policy, business men who are engaged in foreign trade can take their decisions and one can predict changes in inflow or outflow of foreign exchange.
3. The cost of living index numbers determine whether the real wages are rising or falling or remain constant: The real wages can be obtained by dividing the money wages by the corresponding price index and multiplied by 100. Real wages helps us in determining the purchasing power of money. Index numbers are used in deflating. Index numbers are highly useful in deflating i.e. they are used to adjust the wages for cost of living changes and thus transform nominal wages into real wages, nominal income to real income, nominal sales to real sales etc. through appropriate index numbers.
4. Used in Deflating: Deflating means correcting or adjusting a value which has inflated. It makes allowances for the effect of price changes. When prices rise, the purchasing power of money declines. If the money incomes of people remain constant between two periods and prices of commodities are doubled the purchasing power of money is reduced to half. For example if there is an increase in the price of rice from Rs.10/ kg in the year 1980to Rs.20/kg in the year 1982. then a person can buy only half kilo of rice with no. so the purchasing power of a rupee is only 50paise in 1982 as compared to 1980.
Thus the purchasing power of money \(=\frac { 1 }{ Price\quad Index } \) In times of rising prices the money wages should be deflated by the price index to get the figure of real wages. The real wages alone tells whether a wage earner is in better position or in worst position.
For calculating real wage, the money wages or income is divided by the corresponding price index and multiplied by 100.
Money wages i.e. Real wages = \(\\ \frac { Money\quad wages }{ Priceindex } \times 100\)
Thus Real Wage Index \(=\frac { Realwagescurrentyear }{ Realwagesofbaseyear } \times 100\)
5. Index numbers helps in formulating suitable economic policies and planning: Many of the economic and business policies are guided by index numbers. For example while deciding the increase of DA of the employees; the employer's have to depend primarily on the cost of living index. If salaries or wages are not increased according to the cost of living it leads to strikes, lock outs etc. The index numbers provide some guide lines that one can use in making decisions.
6. They are used in studying trends and tendencies: Since index numbers are most widely used for measuring changes over a period of time, the time series so formed enable us to study the general trend of the phenomenon under study. For example for last 8 to 10 years we can say that imports are showing upward tendency. Businessmen need to know the trends in the market to take decisions about wage rates, prices of the product, prices of raw materials etc. Therefore, index numbers are very useful for them.
4.
(i) It should be rigidly defined. If an average is left to the estimation of an observer and if it is not a definite and fixed value it cannot be representative of a series. The bias of the investigator in such cases would considerably affect the value of the average. If the average is rigidly defined; this instability in its value would be no more, and it would always be a definite figure,
(ii) It should be based on all the observations of the series. If some of the items of the series are not taken into account in its Calculation the average cannot be said to be a representative one. As we shall see later on there are some averages which do not take into account all the values of a group and to this extent they are not satisfactory averages.
(iii) It should be capable of further algebraic treatment. If an average does not possess this quality, its use is bound to be very limited. It will not be possible to calculate, say, the combined average of two or more series from their individual averages; further it will not be possible to study the average relationship of various parts of a variable if it is expressed as the sum of two or more variables. Many other similar studies would not be possible if the average is not capable of further algebraic treatment.
(iv) It should be easy to calculate and simple to follow. If the calculation of the average involves tedious mathematical processes it will not be readily understood and its use will be confined only to a limited number of persons. It can never be a popular average. As such, one of the qualities of a good average is that it should not be too abstract or mathematical and there should be no difficulty in its calculation. Further, the properties of the average should be such that they can be easily understood by persons of ordinary intelligence.
(v) It should not be affected by fluctuations of sampling. If two independent sample studies are made in any particular field, the averages thus obtained, should not materially differ from each other. No doubt, when two separate enquires are made, there is bound to be a difference, in the average values calculated but in some cases this difference would be great while in others comparatively less. These averages in which this difference, which is technically called "fluctuation of sampling" is less, are considered better than those in which its difference is more.
(vi) It should be based on homogeneous . and uniform items: One more thing to be remembered about averages is that the items whose average is being calculated should form a homogenous group. It is absurd to talk about the average of a man's height and his weight. If the data from which an average is being calculated are not homogeneous, misleading conclusions are likely to be drawn. To find out the average production of cotton cloth per mill, if big and small mills are not separated the average would be unrepresentative. Similarly, to study wage level in cotton mill industry of India, separate averages should be calculated for the male and female workers. Thus we see that as far as possible, the data from which an average is calculated should be a homogeneous lot. Homogeneity can be achieved either by selecting only like items or by dividing the heterogeneous data into a number of homogeneous groups.
5.
Following are the possible steps that can be taken to bring down the equilibrium price:
(i) The government should provide subsidy on the production of such medicines.
(ii) The government should cut down or abolish all the taxes on such medicine.
(iii) The government should offer various facilities to industrialists to motivate them for the production of such medicine. These facilities will reduce the cost of inputs used in the production of medicines.
The effect of above steps will be that supply of such medicines will increase and as the result of, the equilibrium price of medicines will reduce as shown in the given figure,
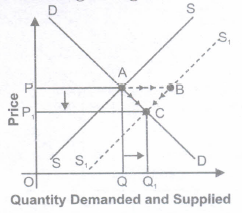
In the given figure price is on vertical axis and quantity demanded and supplied is on horizontal axis. But due to increase in supply the supply curve shifts rightward from SS to S1S1. With new supply curve S1S1 there is excess supply at initial price OP because at price OP, supply is PB and demand is PA, so there is excess supply of AB at price OP. Due to this excess supply competition among the producer will make the price fall. Due to this fall in price there is downward movement along the supply curve (Contraction in supply) from B to C and similarly, there is downward movement along the demand curve (Expansion in demand) from A to C. So, finally, equilibrium price falls from OP to OP1 and equilibrium quantity rises from OQ to OQ1
Conclusion
Due to increase in supply,
(i) Equilibrium price falls from OP to OP1
(it) Equilibrium quantity rises from OQ to OQ1
Value: Analytic
6.
Difference between correlation and causation is given below:
1. Definition: "Correlation is a statistical measure (expressed as a number) that describes the size and direction of a relationship between two or more variables. A correlation between variables, however, does not automatically mean that the change in one variable is the cause of the change in the values of the other variable". "Causation indicates that one event is the result of the occurrence of the other event; i.e. there is a causal relationship between the two events. This is also referred to as cause and effect
2. Mutual dependence: Theoretically, the difference between the two types of relationships are easy to identify - an action or occurrence can cause another (e.g. smoking causes an increase in the risk of developing lung cancer), or it can correlate with another (e.g. smoking is correlated with alcoholism, but it does not cause alcoholism). In practice, however, it remains difficult to dearly establish cause and effect, compared with establishing correlation.
3. Pure Chance: The correlation between the two variables may be due to pure chance or co-incidence. But in causation, it is not coincidental but logical.
7.
The difference between upper limit and lower limit of two successive classes is1.
Divide one by two.
We get 0.5
Add 0.5 in upper limit of all classes and deduct it from lower limit of all classes. On doing so we get new class intervals as follows:
| Age | No of Students |
| (X) | (f) |
| - 0.5 -9.5 | 3 |
| 9.5 -19.5 | 4 |
| 19.5 - 29.5 | 10 |
| 29.5 - 39.5 | 7 |
| 39.5 - 49.5 | 63 |
8.
According to King, "One of the chief aims of statistical science is to render the meaning of masses of figures clear and comprehensible at a glance." This is often best accomplished by presenting the data in a pictorial (or graphical) form.
The shape of the graph gives an exact idea of the variations of the distribution trends. Graphic presentation, therefore, serves as an easy technique for quick and effective comparison between two or more frequency distributions. When the graph of one frequency distribution is superimposed on the other, the points of contrast regarding the type of distribution and the pattern of variation become quite obvious. All these advantages necessitate a clear understanding of the various forms of graphic representation of a frequency distribution.
9.
| Mid Value | Frequency | Classes | Cumulative Frequency (less than type) |
| 10 | 3 | 5-15 | 3 |
| 20 | 5 | 15-25 | 8 |
| 30 | 8 | 25-35 | 16 |
| 40 | 6 | 35-45 | 22 |
| 50 | 5 | 45-55 | 27 |
| 60 | 3 | 55-65 | 30 |
\(Q_1=\frac{n}{4}th\ observation\frac{30}{4}=7.5th\ observation\)
Q1 class is 15-25
\(Q_1=l_1+\frac{(\frac{N}{4}-C)}{f}(i)\)
Where l1 = 15; f = 5;\(\frac{N}{4}=7.5\); C=3;i=10
\(Q_1=10+\frac{(7.5-3)}{5}(10)=24\)
\(Q_3=\frac{3(n)}{4}\ observation\frac{3(30)}{4}=22.5\ observation\)
Q3 class is 45-55
Then Quartile of a continuous series can be calculated by the below interpolation formula.
\(Q_3=l_1+\frac{(\frac{3N}{4}-C)}{f}(i)\)
Where l1 = 45, f= 5;\(\frac{3N}{4}=22.5\);C = 22, i = 10
\(Q_3=45+\frac{(22.5-20)}{5}(10)=50\)
10.
The preparation of a good table is an art. The purpose of tabulation must always be kept in mind before the preparation of a statistical table. A good statistical table must contain at least the following components.
In general, a statistical table consists of the following eight parts. They are as follows:
1. Table Number: Each table must be given a number. Table number helps in distinguishing one table from other tables. Usually tables are numbered according to the order of their appearance in a chapter. For example, the first table in the first chapter of a book should be given number 1.1and second table of the same chapter be given 1.2 Table number should be given at its top or towards the left of the table.
2. Title of the Table: Every table should have a suitable title. It should be short & clear. Title should be such that one can know the nature of the data contained in the table as well as where and when such data were collected. It is either placed just below the table number or at its right.
3. Caption: Caption refers to the headings of the columns. It consists of one or more column heads. A caption should be brief, concise and self-explanatory, Column heading is written in the middle of a column in small letters.
4. Stub: Stub refers to the headings of rows.
5. Body: This is the most important part of a table. It contains a number of cells. Cells are formed due to the intersection of rows and column. Data are entered in these cells.
6. Head Note: The head-note (or prefactory note) contains the unit of measurement of data. It is usually placed just below the title or at the right hand top corner of the table.
7. Foot Note: A footnote is given at the bottom of a table. It helps in clarifying the point which is not clear in the table. A footnote may be keyed to the title or to any column or to any row heading. It is identified by symbols such as *,+,@,£ etc.
8. Source Note: The source note shows the source of the data presented in the table. Reliability and accuracy of data can be tested to some extent from the source note. It shows the name of the author, title, volume, page, publisher's name, year and place of publication of the book or journal from which data are complied.
--- THE TITLE ----
---- Prefatory Notes ----
| ----Box Head---- | |
| ---- Row Captions ---- | ---- Column Captions ---- |
| ---- Stub Entries ---- | ---- The Body ---- |
Foot Notes
Source Note Solution
11.
Different steps in construction of a pie diagram are given below:
1. Convert all the values as a percentage of total value.
2. Convert the various observations (in per cent) in the data set into corresponding degrees in the circle by multiplying each by 3.6 (3600).
3. If you wish to convert the values directly into degrees, you can use a formula,
4. Draw a circle of appropriate size with a compass. Size of circle depends on space available and number of subitems in pie diagram. If two or more pie chart are beings drawn which are to be compared then radii of all these must be equal.
5. Draw points on the circle according to the size of each portion of the data with the help of a protractor and join each of these points to the center of the circle. It is a common practice to keep the largest components at 12 0 clock position in the circle.
6. Different components should be distinguished from each other by using either different shades or colours.
7. A proper index explaining shades or colours used for different items should be drawn.
12.
| Perfect Competition | Basis | Monopoly |
|---|---|---|
| It refers to a market situation where there are very large number of buyers and sellers dealing in a homogeneous product at a price fixed by the market. | Meaning | Monopoly refers to a market situation where there is a single seller selling a product which has no close substitutes. |
| There are very large number of sellers and no individual seller has control over activities of other firms | Number of Sellers | There is a single seller and the monopolist has full control over the supply. |
| The products sold are homogeneous. So, buyers are willing to pay the same price for all products, which leads to uniform price in the market. | Nature of Product | There are no close substitutes of the product. So, there is no competition from new and existing products |
| Any firm can freely enter or exit from this kind of market. It leads to absence of abnormal profits and abnormal losses in the long run. |
Entry and Exit | There is restriction on entry and exit. So, a firm can earn abnormal profits in the long run. |
| In perfect competition, industry is price maker, firm is price taker because of homogeneous goods. | Price Maker/Taker | Monopolist is a price-maker as firm and industry are one and the same thing. |
| Buyers .and sellers have perfect knowledge about market conditions. | Level of Knowledge | Sellers and buyers do not have perfect knowledge |
| Demand curve is perfectly elastic as price remains the same at all levels of output. | Demand curve | Demand curve slopes downwards as more output can be sold only at less price. |
| Nosellingcosts are incurred as buyers and sellers have perfect knowledge about market conditions. | Selling cost | Selling costs are incurred for informative purposes due to lack of perfect knowledge |
13.
The profit-maximizing level of output is always determined where,
(i) MR = MC
(ii) MC must be rising. In other words, where price is equal to MC.
If price is not equal to MC, profit-maximizing condition cannot hold. It can be explained with the help of the following two cases:
Case 1: Price Greater Than MC
(i) In the given figure at output level q2, the market price is greater than marginal cost.
(ii) To show that q2 is not a profit maximizing level of output, we have taken q3 output level, which is right of q2.
(iii) Suppose the firm increases its output level from q2 to q3. The increase in total revenue of the firm from this output is the market price multiplied by the change in quantity (\(\triangle\) TR= market price x \(\triangle\)Q), that is, the area of rectangle q2q3CB.
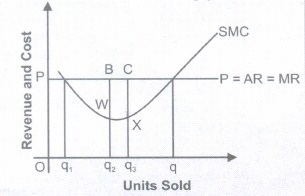
(iv) On the other hand, the increase in total cost with this increase in output is the area of the region q2q3XW.
(v) But, a comparison of the two area shows that the firm's profit is higher when output level is q2q3 rather than %. So, % is not a profit maximizing level of output.
Case 2: Price Less Than MC
(i) In the given figure at output level q2, the market price is less than marginal cost.
(ii) To show that %is not a profit maximizing level of output, we have taken q3 output level, which is left of q2.
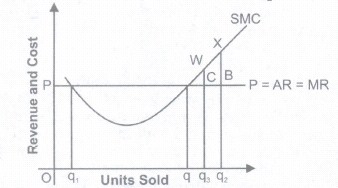
(iii) Suppose now, that the firm reduce its output level from q2 to q3. The decrease in total revenue of the firm from this output is the market price multiplied by the change in quantity (\(\triangle\)TR = market price x \(\triangle\)Q), that is, the area of rectangle q2q3CB.
(iv) On the other hand, the decrease in total cost with this decrease in output is the area of the region q2q3WX.
(v) But, a comparison of the two area shows, that by reducing the output from q2 to q3, the decrease in cost is more than the loss in revenue.
So, q2 is not a profit maximizing level of output.
14.
There are three primary types of nonrandom sampling methods:
1. Quota Sampling
Quota sampling is designed to overcome the most obvious flaw of availability sampling. Rather than taking just anyone, you set quotas to ensure that the sample you get represents certain characteristics in proportion to their prevalence in the population. Note that for this method, you have to know something about the characteristics of the population ahead of time. Say you want to make sure you have a sample proportional to the population in terms of gender - you have to know what percentage of the population is male and female, then collect sample until yours matches. Marketing studies are particularly fond of this form of research design. The primary problem with this form of sampling is that even when we know that a quota sample is representative of the particular characteristics for which quotas have been set, we have no way of knowing if sample is representative in terms of any other characteristics. If we set quotas for gender and age, we are likely to attain a sample with good representativeness on age and gender, but one that may not be very representative in terms of income and education or other factors. Moreover, because researchers can set quotas for only a small fraction of the characteristics relevant to a study quota sampling is really not much better than availability sampling. To reiterate, you must know the characteristics of the entire population to set quotas; otherwise there's not much point to setting up quotas. Finally, interviewers often introduce bias when allowed to self select respondents, which is usually the case in this form of research. In choosing males 18-25, interviewers are more likely to choose those that are better dressed, seem more approachable or less threatening. That may be understandable from a practical point of view, but it introduces bias into research findings.
2. Judgment Sampling! Purposive Sampling/Deliberate Sampling
Purposive sampling is a sampling method in which elements are chosen based on purpose of the study. Purposive sampling may involve studying the entire population of some limited group (sociology faculty at Columbia) or a subset of a population (Columbia faculty who have won Nobel Prizes). As with other non-probability sampling methods, purposive sampling does not produce a sample that is representative of a larger population, but it can be exactly what is needed in some cases - study of organization, community, or some other clearly defined and relatively limited group.
3. Convenience Sampling/Availability Sampling
Convenience sampling is a method of choosing subjects who are available or easy to find. This method is also sometimes referred to as haphazard, accidental, or convenience sampling. The primary advantage of the method is that it is very easy to carryout, relative to other methods. A researcher can merely stand out on his/her favorite street comer or in his/her favorite tavern and hand out surveys. One place this used to show up often is in university courses. Years ago, researchers often would conduct surveys of students in their large lecture courses. For example, all students taking introductory sociology courses would have been given a survey and compelled to fill it out. There are some advantages to this design - it is easy to do, particularly with a captive audience, and in some schools you can attain a large number of interviews through this method. The primary problem with Convenience sampling is that you can never be certain what population the participants in the study represent. The population is unknown, the method for selecting cases is haphazard, and the cases studied probably don't represent any population you could come up with. However, there are some situations in which this kind of design has advantages - for example, survey designers often want to have some people respond to their survey before it is given out in the "real" research setting as a way of making certain the questions make sense to respondents. For this purpose, Convenience sampling is not a bad way to get a group to take a survey, though in this case researchers care less about the specific responses given than whether the instrument is confusing or makes people feel bad.
15.
| Changes in quantity supplied | Basis | Change in supply | ||||||||||||||||||||||||
|---|---|---|---|---|---|---|---|---|---|---|---|---|---|---|---|---|---|---|---|---|---|---|---|---|---|---|
| The change in quantity supplied due to the change in price of the commodity. | Meaning | Change in supply due to the change in factors other than price | ||||||||||||||||||||||||
| Movement along the supply curve (i) Expansion in supply (ii) Contraction in supply |
Alternative Name |
Shift in supply curve |
||||||||||||||||||||||||
| (i) It states that rise in quantity supplied due to the rise in price of the commodity (ii) It states that fall in quantity supplied due to the fall in price of the commodity |
Meaning | (i) An increase in supply means that producers now supply more at a given price level (ii) A decrease in supply means that producers now supply less at a given price level |
||||||||||||||||||||||||
|
Schedule |
|
||||||||||||||||||||||||
 |
Diagrams | 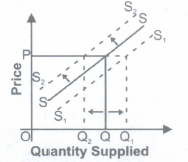 |
||||||||||||||||||||||||
16.
It is absolutely right to say that statistics is indispensible in every field of life.
1. Statistics and planning: Statistics in indispensable in planning in the modem age which is termed as "the age of planning". Almost all over the world the government is restoring to planning for economic development.
2. Statistics and economics: Statistical data and techniques of statistical analysis are immensely useful in solving economical problem. Such as wages, price, time series analysis, demand analysis.
3. Statistics and business: Statistics is an indispensible tool of production control. Business executives are relying more and more on statistical techniques for studying the wants and desires of the valued customers.
4. Statistics and industry: In industry statistics is widely used in quality control. In production engineering to find out whether the product is confirming to the specifications or not. Statistical tools, such as inspection plan, control chart etc.
5. Statistics and mathematics: Statistics and Mathematics are intimately related recent advancements in statistical technique are the outcome of wide applications of mathematics.
6. Statistics and modern science: In medical science the statistical tools for collection, presentation and analysis of observed facts relating to causes and incidence of diseases and the result of application of various drugs and medicine are of great importance.
7. Statistics, psychology and education: In education and psychology statistics has found wide application such as, determining or to determine the reliability and validity to a test, factor analysis etc.
17.
The behaviour of Marginal product in the law of variable proportion is as under:
(i) When Marginal product rises (till Point PI), Total product increases at an increasing rate (convex shape) (till point P).
(ii) When Marginal product falls and remains positive (till point B1), total product increases at a diminishing rate (concave shape) (till point A).
(iii) When Marginal Product is zero (at point B1), Total Product is at its maximum and constant (At point B).
(iv) When Marginal product becomes negative (after point B1), total product falls (after point B).
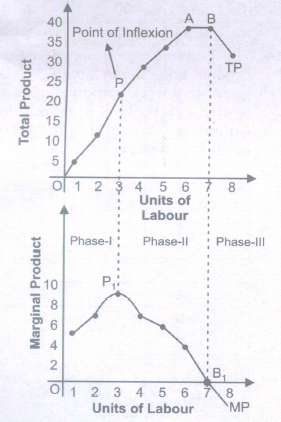
Causes or Reasons of this Behaviour is as Under:
(i) Phase I
(a) Proper utilization of the fixed factor
1. In the initial stage of production, the units of variable input (i.e., labour) is so less that fixed inputs cannot be effectively utilized.
2. Proper utilization of the fixed factor can be attained when more and more units of variable factor (labour units) are applied to the fixed factor (land), the fixed factor will be used intensively and output will increase rapidly.
(b) Specialization and division of labour
1. Initially, there was only one labour working on all the 5 acres of land ploughing, watering, etc.
2. As the number of labour units increases, each worker specialized in a particular activity leads to
specialization of the variable units and this resulted in increased output.
(ii) Phase II
(a) The non-optimal combination of variable factor with the fixed factor
1. When a given quantity of a fixed factor is combined with more and more units of variable factor, the additional units of variable factor will have smaller and smaller quantity of fixed factor to work with them.
2. As many workers share the same fixed factor, the share of each would obviously fall. Therefore, the cooperation of the fixed factor is not available to the same extent. Thus, an increase in the variable factor would add less and less to total output.
(b) Imperfect Substitutes
1. Diminishing return to factor occurs because variable factor and fixed factor are imperfect substitutes to each other.
2. Technically speaking, there is a limit to which variable factor can be applied to fixed factor and that limit depends upon the efficiency of fixed factor. So, variable factor and fixed factor are imperfect substitutes to each other.
(iii) Phase III
(a) Efficiency of Variable Factor Fall
1. In this stage the amount of variable factor becomes excessive relative to the fixed factor. This happens when too many LABOUR are engaged in cultivating on a given piece of land.
2. Instead of helping each other in production they cause overcrowding and chaos and thus hamper each other's work. In such a case, the contribution of additional labour to production is bound to be negative.
3. Thus, the marginal returns become negative and the total returns start diminishing.
(b) Efficiency of Fixed Factor Fall
1. Too much of a variable factors may also lead to the inefficiency of the fixed factor as well. • In case of capital, which is a fixed factor, too much of labour may cause lot of wear and tear of machinery, frequent breakdowns and excessive cost of maintenance. This is bound to affect total production adversely.
2. In such a situation it is advisable to reduce the units of the variable factor than to increase it with a view for getting maximum production.
18.
| Basis | Positive Economics | Normative Economics |
| Meaning | It deals with laws, principles, theories and facts of economics. | It deals with opinions, policy evaluation and idealistic part of economics. |
| Reality vs. Idealism | It deals with reality, i.e. 'what is'. | It deals with idealistic situation, i.e. 'What ought to be' |
| Value Judgments | No value judgments are associated with positive economics | Value judgments are associated with normative economics |
| Example | (a) There is inverse relation between price and quantity demanded other things being equal. (b) In India, 34% marginal farmers are living below poverty line. (c) MGNREGA was launched in 2005. |
(a) Globalization is widening the gap between countries. (b) Poverty is worse than unemployment (c) Price rise is disastrous for the economy (d) We should not give subsidies on fertilizers |
19.
| Output | MC (Given) | TVC = \(\sum\)MC | TFC | TC = TFC + TVC | AVC\(\frac{TVC}{Output}\) |
|---|---|---|---|---|---|
| 1 | 9 | 9 | 12 | 21 | 9 |
| 2 | 7 | 16 | 12 | 28 | 8 |
| 3 | 2 | 18 | 12 | 30 | 6 |
| 4 | 4 | 22 | 12 | 34 | 5.5 |
| 5 | 8 | 30 | 12 | 42 | 6 |
| 6 | 12 | 42 | 12 | 54 | 7 |
20.
Large number of sellers-
(i) The words 'large number' simply states that the number of sellers is large enough to render a single seller's share in total market supply of the product insignificant.
(ii) Insignificant share means that if only one individual firm reduces or raises its own supply, the prevailing market price remains unaffected.
(iii) The prevailing market price is the one which was set through the intersection of market demand and market supply forces, for which all the sellers and all the buyers together are responsible.
(iv) One single seller has no option but to sell what it produces at this market determined price. This position of an individual firm in the total market is referred to as price taker. This is a unique feature of a perfectly competitive market.
Large number of buyers-
(v) The words 'large number' simply states that the number of buyers is large enough, that an individual buyer's share in total market demand is insignificant, the buyers cannot influence the market price on his own by changing his demand.
(vi) This makes a single buyer also a price taker. To sum up, the feature "large number" indicates ineffectiveness of a single seller or a single buyer in influencing the prevailing market price on its own, rendering him simply a price taker.
21.
| Q | MR | TR=ΣMR | Demand Curve or Price or \(AR=\frac{TR}{Q}\) | ED |
|---|---|---|---|---|
|
1 |
10 6 2 2 |
10 16 18 20 |
10 8 6 5 |
ED > 1 |
| 5 | 2 | 22 | 4.4 | |
| 6 7 8 |
0 0 0 |
22 22 22 |
3.6 3.2 2.75 |
ED =1 |
| 9 | -5 | 17 | 1.9 | ED < 1 |
Rule: When with the fall in price of goods, total revenue rises, ED > 1, if it remains same ED = 1 and if falls then ED < 1.
22.
(a) When purchasing a unit of a commodity a consumer compares its price with the expected utility from it. Utility obtained is the benefit, and the price payable is the cost. The consumer compares benefit and the cost. He will buy the unit of a commodity only if the benefit is greater than or at least equal to the cost.
(b) equilibrium Conditions for Single Commo ·ty Consumer Equilibrium Necessary Condition Marginal utility in terms of Money = Price
\(\frac { Marginal\ utility\ of\ a\ product\ in\ utils[M{ U }_{ X }] }{ \ utility\ of\ one\ rupee[M{ U }_{ M }] } \)
In particular, the condition (A) says that the marginal utility of a Product in terms of Money be equal to its price. Sometimes, this is loosely stated as marginal utility is equal to price, i.e.,
| Consumption(Un-its) | Marginal Utility(MU)(Uti-Ls) | M.U.(Rs) | Price | Marginal Gain(MU-Price) | Total Gain |
|---|---|---|---|---|---|
| 1 | 5 | 5 | 3 | 2 | 2 |
| 2 | 4 | 4 | 3 | 1 | 3 |
| 3 | 3 | 3 | 3 | 0 | 3 |
| 4 | 2 | 2 | 3 | -1 | 2 |
(b) Suppose, the price of commodity X in the market is Rs.3 per unit. It means he has to pay Rs.3 per unit for all the units he buys. Suppose, the utility obtained from the first unit is 5 utils (=Rs. 5). The consumer will buy this unit because the utility of this unit is greater than the price and this process continues till Marginal utility = Price as shown in the above schedule at quantity 3.
(c) Consumer will not buy the fourth unit MU = Price.
If MU> PRICE
(a) Means benefit is greater than cost and whenever benefit is greater than cost, consumer keeps on consuming additional unit of a commodity till MU = Price.
(b) It is so because according to the law of diminishing marginal utility, MUfalls as more is purchased till it becomes equal to price.
If MU< PRICE
(a) Means benefit is less than cost and whenever benefit is less than cost, the consumer keeps on decreasing additional unit of a commodity till MU = Price.
(b) It is so because according to the law of diminishing marginal utility, MU rises as less units are consumed till it becomes equal to price.
Sufficient Condition
Total gain falls as more is purchased after equilibrium. It means that consumer continues to purchase so long as total gain is increasing or at least constant.
(a) It can be explained with the help of the following schedule:
because utility of this unit is 2 utils (= Rs.2) which is less than the price. It is not worth buying the fourth unit. The consumer will restrict his purchase to only 3 units
23.
(i) A rise in price of Substitute good
(a) Increase in Price of Substitute Goods An increase in price of substitute goods (Coke)leads to an increase in demand of a given commodity (Pepsi).The Demand curve of Pepsi would shift rightward It can be explained with the help of given diagram:
In the given diagram the demand curve for Pepsi when the price of Coke is 18 lies to the right of that when the price of Coke is Rs.15. Hence, an increase in the price of a substitute good shifts the demand curve for a product to the right.
(ii) Arise in price of Complimentary good
Increase in Price of Complimentary Good [Refill] leads to a decrease in demand of given commodity [Pen]. The Demand curve for Pen shifts leftwards. It can be explained with the help of given diagram:
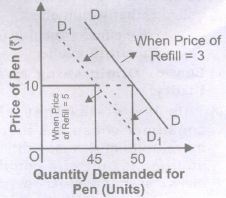
In the above diagram, the demand curve for Pen when Refill price is Rs.5 lies to the left of that when the Refill price is Rs.3
24.
The three central problems of an economyare:
(i) What to produce?
(a) What to produce refers to a problem in which decision regarding which goods and services should be produced is to be taken.
(b) Since its resources are limited, every economy has to decide what commodities are to be produced and in what quantities.
(c) The guiding principle for an economy here is to allocate resources in such a way that gives maximum aggregate utility to the society.
(ii) How to produce?
(a) How to produce refers to a problem in which decision regarding which technique of production should be used is made.
(b) Goods and services can be produced in two ways: by using labour intensive techniques, and by using capital-intensive techniques
(c) The guiding principle for an economy in such a case has to decide about the techniques of production on the basis of cost of production. Those techniques of production should be used which lead to the least possible cost per unit of commodity or service.
(iii) For whom to produce?
(a) For whom to produce refers to a problem in which decision regarding which category of people are going to consume a good, i.e., economically poor or rich.
(b) As we know, goods and services are produced for those who can purchase them or have the capacity to buy them.
(c) Capacity to buy depends upon how income is distributed among the factors of production. The higher the income, the higher will be the capacity to buy and vice versa. So, this is a problem of distribution.
(d) The guiding principle is that the economy must see here that important and urgent wants of its citizens are being satisfied for the maximum possible extent or not.
25.
(c)
Mean
26.
(d)
Median
27.
(c)
Both (a) and (b) are possible
28.
(b)
0
29.
(c)
Spearman's rank correlation
30.
(c)
Quartile deviation
31.
(c)
Linking the mid-points from a frequency histogram
32.
(c)
Classification precedes tabulation
33.
(c)
an overall decrease in price and a decrease in equilibrium quantity
34.
(b)
Pie diagram
35.
(a)
Decrease Production
36.
(b)
monopoly
37.
(d)
Statistics can mould data to make god or devil from it.
38.
(a)
Scarcity
39.
(d)
All the above
40.
(c)
Firms face downward-sloping demand curves
41.
(c)
entire relationshipbetweenthe quantity supplied and the price of good
42.
(a)
TR falls with the increase in output
43.
(d)
it is impossible to tell if marginal cost is rising or falling
44.
(a)
At least one fixed factor of production and firms neither leaving nor entering the industry.
45.
(a)
Shifts to the right.
46.
(b)
quantity demanded to a change in price
47.
(a)
It is convex to the origin
48.
(d)
A movement from a point inside the PPF to a point on the PPF.
49.
(i) When the government imposed upper limit on the price (maximum price) of a good or service which is lower than equilibrium price is called price ceiling.
(ii) Price ceiling is generally imposed on necessary items like wheat, rice, kerosene etc.
(iii) It can be explained with the help of diagram below:
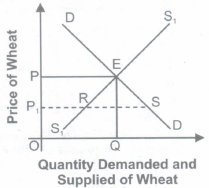
(a) In the given diagram, DD is the market demand curve and SS is the market supply curve of Wheat Suppose, equilibrium price OP is very high for many individuals and they are unable to afford at this price.
(b) As wheat is necessary product, government has to intervene and impose price ceiling of P1 which is below the equilibrium level.
(c) Since this price is below equilibrium price, there is excess demand in the market. With shortages, sellers tend to hoard the product. It could also lead to black marketing.
50.
Statistical project is an extremely powerful teaching tool that integrates numerous concepts and skills presented in the classroom. Here are some basic guidelines for developing a statistical project.
A statistical project is the process of answering a research question using statistical techniques and presenting the work in a written report. The research question may arise from any field of scientific endeavor, such as athletics, advertising, aerodynamics, or nutrition. A project differs from a statistical poster in that a written report is used to present the findings.
The process of developing a statistical project should demonstrate the scientific method and pose a focused question or questions, collect appropriate data, analyze the data thoughtfully, and draw correct conclusions.
Because students are asking questions continually about what touches their lives, they should have little trouble generating questions about themselves or their schools, families, neighborhoods, or interesting phenomena in the world. Once a question is proposed, students should examine it. First, is it a question that can be answered? Second, can students collect data to answer the question or has someone else already collected data that could be used to find the answer? Once the question is chosen, data must be collected. If published data are used, students should understand how the data were obtained and record their source. Usually, students choose to collect their own data. Time should be spent deciding how to collect this data. If a survey is used, how are the people chosen to answer the questionnaire? Thoughtful analysis of the data may take many forms and should be guided by the question and how the data were collected. Usually, it is best to begin by graphing the data. Can graphs be used to give the answer to the question or questions? Most of the time, graphics have been the sole method of data analysis for grades 4-6. As students gain experience, simple statistical methods such as a chi-squared test or a t-test may be used. Regression has been used occasionally. Sometimes, estimation is most appropriate and hypothesis testing is not needed. Other methods may be used, depending on the question and data.
Once analysis is complete, the question should be answered. The data may not be able to provide a conclusive answer. Finally, consider the strengths and weaknesses of the project. What would be changed if the project was done again?
51.
The value of non-equitable treatment to the poor section of the society is compromised here. The rise in wholesale price index hurts more the poor and lower middle class as they have meager resources to run their life. Rise in prices of essential commodities will lead to sufferings for them.
52.
| Daily Income | No of families | Mid value | d(M-A) | d'=(d/100) | d'2 | Fd' | Fd'2 |
| 0-100 | 5 | 50 | -200 | -2 | 4 | -10 | 20 |
| 100-200 | 9 | 150 | -100 | -1 | 1 | -9 | 9 |
| 200-300 | 12 | 250 | 0 | 0 | 0 | 0 | 0 |
| 300-400 | 2 | 350 | +100 | +1 | 1 | +20 | 2 |
| 400-500 | 2 | 450 | +200 | +2 | 4 | +4 | 8 |
| Total | \(\sum \)F=30 | \(\sum \)Fd=-13 | \(\sum \)Fd'2=-b 39 |
\(\bar { x } =A+\frac { \sum _{ i=1 }^{ n }{ { f }_{ i }{ d }_{ i } } }{ \sum _{ i=1 }^{ n }{ { f }_{ i } } } \)=250-13/30X100=206.66 Ans.
\(S=\sqrt { \frac { \sum { { FD }^{ 2 } } }{ \sum { F } } -\left( \frac { { \sum { FD } }^{ 2 } }{ \sum { F } } \right) } \times i=\sqrt { \frac { 39 }{ 30 } -{ \left( \frac { -13 }{ 30 } \right) }^{ 2 } } \times 100\)
\(S=\sqrt { 1.3-0.18 } =\sqrt { 1.12 } \)
S=1.058
53.
Weighted Mean is an average computed by giving different weights to some of the individual values. Basically you use a weighted mean when the data holds different "weights"/group sizes i.e. if you were looking for the mean of the number of people to visit a shop during its opening hours and you were told x went in the morning and y in the afternoon but the shop was open 3 hours in the morning and 6 in the evening just adding the two and dividing by 2 would not give you the correct average per hour. So you would need to weight the means i.e. (3x + 6y)/9 would be you actual average per hour as opposed to (x + y)/2.
54.
Positive Correlation: When X and Yare related in such a way that with increase in X, Y also increases and vice versa, it is called positive correlation. In other words, when both variables move in same direction, then variables are said to be positively related. For example, as height increases, weight also increases, so height and weight are positively related variables.
| X | Y |
| 1 | 2 |
| 2 | 4 |
| 3 | 6 |
| 4 | 8 |
| 5 | 10 |
Negative Correlation: When X and Yare related in such a way that with increase in X, Y decreases and vice versa, it is called negative correlation. In other words, when both variables move in opposite direction, then variables are said to be negatively related. For example, as income increases, demand for poor quality goods decreases, so income and poor quality goods are negatively related variables.
| X | Y |
| 1 | 10 |
| 2 | 8 |
| 3 | 6 |
| 4 | 4 |
| 5 | 2 |
55.
Following are the main objects of the tabulation or tabular presentation of statistical data:
It simplifies the complex data.
It facilitates comparison.
It helps to give better identity to the data. '
It provides a good means of arrangement.
56.
(a) Simple bar Diagram
(b) Pie Chart
(c) Pie Chart
57.
| Wages (per Hour) | Number of workers | Cumulative Frequency |
| 20 | 5 | 5 |
| 25 | 7 | 12 |
| 30 | 6 | 18 |
| 35 | 10 | 28 |
| 40 | 5 | 33 |
| 45 | 4 | 37 |
| 50 | 4 | 41 |
Median = size of \(\frac{N+1}{2}\)
size of \(\frac{41+1}{2}=Item\)
Item 19 to 28 have a value equal to 35. Therefore, median = 35.
58.
Different types of two-dimensional diagrams have been explained below: Rectangles: Since area of a rectangle is equal to the product of its length and width, while making such type of diagrams both length and width are considered. Rectangles are suitable for use in cases where two or more quantities are to be compared and each quantity is sub-divided into several components. Squares: To construct a square diagram, first the square-root of the values of various figures to be represented is taken and then these values are divided either by the lowest figure or by some other common figure to obtain proportions of the sides of the squares. The squares constructed on these proportionate lengths must have either the base or the center on a straight line. The scale is attached with the diagram to show the variable value represented by one square unit area of the squares. Circles: Circles are alternatives to squares to represent data graphically. The circles are also drawn such that their areas are in proportion to the figures represented by them. The circles are constructed in such a way that their centers lie on the same horizontal line and the distance between the circles is equal. Since the area of a circle is directly proportional to the square of its radius, the radii of the circles are obtained in proportion to the square root of the figures under representation. Thus, the lengths that were used as the sides of the square can also be used as the radii of circles.
59.
(i) Price rigidity refers to a situation in which whether there is change in demand and supply the price tends to stay fixed.
(ii) If a firm tries to reduce the price the rivals will also react by reducing their prices. Likewise,if it tries to raise the price, other firms will not do so. It will lead to loss of customers for the firm which intended to raise the price.
60.
(i) The given statement is correct.
(ii) If MC is falling at the point of equilibrium, it means that it is possible to add to profits by producing more.
(iii) So, MC should be rising at the point of producer's equilibrium.
61.
A single figure is not called statistics. Aggregate of facts is called statistics. It is for a simple reason that a single figure can neither be compared, nor presented nor analyzed. IfRam says that his weight is 56 kg, it is not statistics but if he says average weight of his class is 60kg, it is a statistical statement because it is backed by aggregate of facts.
62.
Random Sampling
There are two methods of random sampling.
1. Unrestricted Random Sampling
2. Restricted random sampling.
Unrestricted Random Sampling
1. Lottery Method
2. Use of Random Number Tables
Restricted Random Sampling
1. Stratified Sampling/Mixed Sampling
2. Cluster Sampling
3. Systematic Sampling
Non-Random Sampling
1. Quota Sampling
2. Judgment Sampling / Purposive Sampling / Deliberate Sampling
3. Convenience Sampling /Availability Sampling
Cluster sampling is a sampling technique used when "natural" but relatively homogeneous groupings are evident in a statistical population. It is often used in marketing research. In this technique, the total population is divided into these groups (or clusters) and a simple random sample of the groups is selected. Then the required information is collected from a simple random sample of the elements within each selected group. This may be done for every element in these groups or a subsample of elements may be selected within each of these groups. A common motivation for cluster sampling is to reduce the total number of interviews and costs given the desired accuracy. Assuming a fixed sample size, the technique gives more accurate results when most of the variation in the population is within the groups, not between them.
63.
No, I do not agree. Economics is a positive as well as a normative science.
(a) It is also concerned with welfare aspects, policy formulation and non-monetary issues.
(b) At micro level, it does talk about maximization aspects but when it is applied at macro level, it is concerned with socio-economic problems. In those cases, it thinks beyond money as well.
(c) Many public sector undertakings are not getting any profits but they are continuing because of welfare motive that they fulfill.
64.
| Units sold(Q) | Price(Rs)(P) | TR(Rs)=PxQ | \(AR(Rs)=\frac{TR}{Q}\) | MR(Rs)MRn=TRn-TRn-1 |
|---|---|---|---|---|
| 10 | 1 | 10 | 1 | -8 |
| 9 | 2 | 18 | 2 | -6 |
| 8 | 3 | 24 | 3 | -4 |
| 7 | 4 | 28 | 4 | -2 |
| 6 | 5 | 30 | 5 | 0 |
| 5 | 6 | 30 | 6 | 2 |
| 4 | 7 | 28 | 7 | - |
(i) MR has been calculated in the reverse order, i.e., from bottom to top (As MR is the revenue from the sale of each successive unit).
(ii) MR of the 4th unit has not been calculated as the total revenue from 3 units is not given.
65.
Yes, this statement is true.
(i) As we know, in Perfect competition, homogeneous goods are produced. So, industry cannot charge different price from different firms.
(ii) So, industry will give that price to the firm where industry is in equilibrium, i.e., where Demand = Supply. Any movement from that point would be unstable.
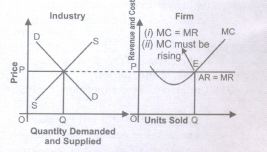
(iii) In the given diagram, price and revenue is measured on vertical axis and units of commodity on horizontal axis. Industry will give OP price or point E to the firm as at that point Demand = supply, i.e., industry is in equilibrium.
The firms will follow the same price and charges same from the consumer.
66.
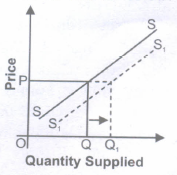
Case 1- Technological Progress: When there is technological progress in the firm, then cost of production will decrease, which leads to increase in the profit margin of the firm and thereby shifts the supply curve shifts rightward as shown below:
Case ll- Outdated Technology
Supply of those goods which are being produced with old and inferior technology causing increase in cost of production will decrease the total output and shift the supply curve to the left.
67.
The inverse relationship between price of the commodity and quantity demanded for that commodity is because of the following reasons:
(i) Income effect:
(a) Quantity demanded of a commodity changes due to change in purchasing power (real income), caused by change in price of a commodity is called Income Effect.
(b) Any change in the price of a commodity affects the purchasing power or real income of the consumers although his money income remains the same.
(c) Whenpriceofa commodity rise more has to be spent on purchase of the same quantity of that commodity. Thus, rise in price of commodity leads to fall in real income, which will thereby reduce quantity demanded is known as Income effect.
(ii) Substitution effect:
(a) It refers to substitution of one commodity in place of another commodity when it becomes relatively cheaper.
(b) A rise in price of the commodity let coke, also means that price of its substitute, let Pepsi, has fallen in relation to that of coke, even though the price of Pepsi remains unchanged. So, people will buy more of Pepsi and less of coke when price of coke rises.
(c) In other words, consumers will substitute Pepsi for coke. This is called Substitution effect.
Price effect = Income effect + Substitution effect
(iii) Law of Diminishing Marginal Utility:
(a) This law states that when a consumer consumes more and more units of a commodity, every additional unit of a commodity gives lesser and lesser satisfaction and marginal utility decreases.
(b) The consumer consumes a commodity till marginal utility (benefit)he gets equals to the price (cost)they pay, i.e., where benefit = cost.
(c) For example, a thirsty man gets the maximum satisfaction (utility)from the first glass of water. Lesser utility from the 2nd glass of water, still lesser from the 3rd glass of water and so on. Clearly, if a consumer wants to buy more units of the commodity,he would like to do so at a lower price. Since, the utility derived from additional unit is lower.
(iv) Additional consumer:
(a) When price of a commodity falls, two effects are quite possible:
1. New consumers, that is, consumers that were not able to afford a commodity previously, starts demanding it at a lower price.
2. Old consumers of the commodity starts demanding more of the same commodity by spending the same amount of money.
(b) As the result of old and new buyers push up the demand for a commodity when price falls.
68.
| Original Quantity (Q)= 25 units |
Original Price (P)=Rs 5 |
| New Quantity (QI)=?units | Rise in Price(\(\triangle\) P) =Rs 1 |
| Change in Quantity(\(\triangle\) Q)=? |
New Price (P1)=Rs 6 |
| Elasticity of Demand (ED)=1 | |
Price Elasticity of demand (ED)=\({\triangle Q\over \triangle P}\times {P\over Q}\)
\(1={ \triangle Q\over1}\times {5\over 25}i.e.\triangle Q=5 units\)
As price is increasing, the quantity demanded will decrease. It means that
New quantity = Original quantity (Q) - Change in quantity (\(\triangle\)Q) = 25 - 5 = 20 units
New Quantity = 20 units
69.
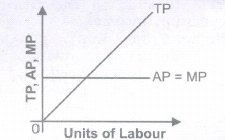
When total product curve is the straight line through the origin, total product increases at a constant rate and the average and marginal product curves would coincide and be a horizontal line; AverageProduct and Marginal product are constant regardless of the amount of input used. It can be seen with the help of following schedule and diagrams
| Units of Labour | Total Product | Average Product | Marginal Product |
|---|---|---|---|
| 0 | 0 | - | - |
| 1 | 5 | 5 | 5 |
| 2 | 10 | 5 | 5 |
| 3 | 15 | 5 | 5 |
| 4 | 20 | 5 | 5 |
| 5 | 25 | 5 | 5 |
70.
Cost is the sum total of explicit cost, implicit cost and certain minimum profit (normal profit).
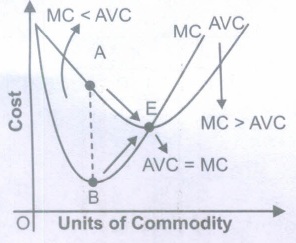
(i) As long as MC is below AVC, AVC curve falls till their intersection at point E.
(ii) When MC curve comes to fall, it falls more rapidly than AVC curve and reaches its minimum point B earlier than the AVC curve reaches its minimum point E. Therefore, MC curve is rising from B to E whereas AVC curve is still falling from A to E.
(iii) When MC curve is rising, it cuts the AVC curve at its minimum point E and after that point MC is above than AVC.
71.
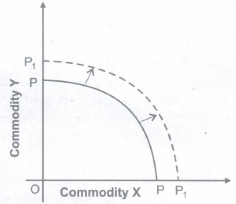
Cleanliness reduces chances of people falling ill and, thus ensure better health. This, in turn, will reduce forced absenteeism from work, raise efficiency level and thus raise country's production potential. Rise in potential shifts PP curve to the right.
72.
As, we know condition for consumer equilibrium is, Necessary Condition Marginal utility of last rupee spent on each commodity is same. Suppose there are two commodities, X and Y respectively. So, for commodity X, the condition is, Marginal Utility in terms of Money = Price of X
Or \(\frac { Marginal\ utility\ of\ s\ product\ in\ util[M{ U }_{ x }] }{ Marginal\ utility\ of\ one\ rupee[M{ U }_{ m }] } \)=Price of X
Or \(\frac { M{ U }_{ x } }{ { P }_{ x } } =M{ U }_{ M }\) ---------(1)
Similarly: for commodity Y, the condition is,
\(\frac { M{ U }_{ y } }{ { P }_{ y } } =M{ U }_{ M }\) -----------(2)
Putting equation (2) in (1), we get
\(\frac { M{ U }_{ x } }{ { P }_{ x } } =\frac { M{ U }_{ y } }{ { P }_{ y } } \)
But as given in the question that the ratio of marginal utility to price in case of X is higher than that in case of Y,
i.e.,\(\frac { M{ U }_{ x } }{ { P }_{ x } } >\frac { M{ U }_{ y } }{ { P }_{ y } } \)
It means marginal utility from the last rupee spent on commodity X is more than marginal utility from the last rupee spent on commodity Y. So, to attain the equilibrium consumer must increase .the quantity of X, which decreases the MUx and decreases the quantity of Y, which will increase the MU. Increase in quantity of y X and decrease in quantity of Y continue till \(\frac { M{ U }_{ x } }{ { P }_{ x } } =\frac { M{ U }_{ y } }{ { P }_{ y } } \)

11th Standard CBSE Syllabus & Materials
11th Standard CBSE
CBSE 11th Business Studies Forms of Business Organisation Sample Question Papers Study Material - QB365 Set A
NEW11th Standard CBSE
CBSE 11th Business Studies Business, Trade and Commerce Sample Question Papers Study Material - QB365 Set A
NEW11th Standard CBSE
CBSE 11th Physics Waves Sample Question Papers Study Material - QB365 Set A
NEW11th Standard CBSE
CBSE 11th Physics Kinetic Theory Sample Question Papers Study Material - QB365 Set A



CBSE 11th Standard CBSE Subjects
CBSE Standards










