
 100% FREE ACCESS
11th Standard CBSE Syllabus & Materials
11th Standard CBSE
CBSE 11th Economics PART-A - Presentation of Data - New Sample Question Papers Study Material - QB365 Set A
NEW11th Standard CBSE
CBSE 11th Economics PART-A - Organisation of Data - New Sample Question Papers Study Material - QB365 Set A
NEW11th Standard CBSE
CBSE 11th Economics PART-A - Collection of Data - New Sample Question Papers Study Material - QB365 Set A
NEW11th Standard CBSE
CBSE 11th Economics PART-A - Introduction to Economics and Statistics - New Sample Question Papers Study Material - QB365 Set A
NEW11th Standard CBSE
CBSE 11th Business Studies International Trade Sample Question Papers Study Material - QB365 Set A
NEW11th Standard CBSE
CBSE 11th Business Studies Evolution and Fundamentals of Business Sample Question Papers Study Material - QB365 Set A

Published on: 30/09/2019
Correlation
Download CBSE Class 11th Standard CBSE undefined question papers, sample papers, important questions, and previous year solved papers in PDF format. Get free study materials, NCERT solutions, and exam preparation resources for Class 11th Standard CBSE undefined
Questions + Answers key
Take MCQ Biology Test
1.
What is Probable error? What is its utility?
2.
What are the merits and limitations of Spearman's rank correlation?
3.
If scatter diagram is a straight line upward sloping to the right, what kind of correlation exist between X and Y?
4.
If scatter diagram is a straight line parallel to X axis or Y axis, what kind of correlation exist between X and Y?
5.
What is spurious correlation? Give some examples.
6.
Discuss importance and utility of correlation.
7.
What are assumptions taken by Karl Pearson's while developing his coefficient of correlation?
8.
Mention different methods of finding correlation
9.
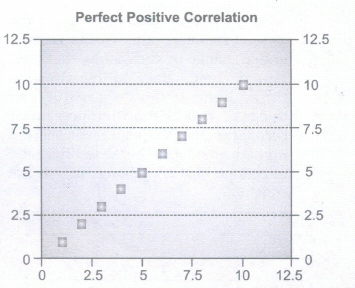
What is a scatter diagram? Draw scatter diagram for perfect positive correlation.
10.
Does zero correlation mean independence?
11.
Mention the mathematical properties of correlation.
12.
What is the difference between simple, partial and multiple correlation?
13.
What do you mean by linear and non linear correlation?
14.
What do you mean by positive and negative correlation?
15.
Differentiate between correlation and causation.
1.
It is used to help in the determination of the Karl Pearson's coefficient of correlation' r '. Due to this' r r is corrected to a great extent but note that, r ' depends on the random sampling and its conditions. it is given by
\(P.E=0.6745\left[ \frac { 1-{ r }^{ 2 } }{ \sqrt { n } } \right] \)
If the value of r is less than P. E., then there is no evidence of correlation i.e. r is not significant.
If r is more than 6 times the P. E. ' r' is practically certain .i.e. significant.
By adding or subtracting P. E. to 'r', we get the upper and Lower limits within which' r ' of the population can be expected to lie.
Symbolically e = \(\gamma\) ± P. E. \(\gamma
\) = Correlation ( coefficient) of the population.
2.
Merits of Rank Correlation
(1) Since in this method \(\sum\) d or the sum of the differences between R1, and R2is always equal to zero, it provides a check on the calculation.
(2) Since Spearman's Rank Correlation is the same thing as Karl Pearson's Coefficient of Correlation between ranks, it can be interpreted in the same way as Karl Pearson's Coefficient of correlation.
(3) Rank correlation unlike Karl Pearson's Coefficient of Correlation does not assume normality in the universe from which the sample has been taken.
(4) Rank Correlation is very easy to understand and apply.' However Pearson's Coefficient is based on a set of full information while Spearman's Coefficient is based only on the ranks. The values of obtained by these two methods would generally differ.
(5) Spearman's Rank method is the only way of studying correlation between qualitative data which cannot be measured in figures but can be arranged. in serial order.
Demerits of Rank Correlation
(1) The method cannot be used in two-way frequency tables or bi-variate frequency distribution.
(2) It can be conveniently used only when n is small say 30, otherwise calculation become tedious.
3.
Positive
4.
Zero correlation
5.
When two variables reflect correlation statistically but logically we can't expect them to be correlated, it is called spurious correlation. Two examples are as follows:
(a) Where there were more doctors, death rates were high.
(b) When there was high rainfall, more students has A grades.
(c) number of storks and birth rate in Denmark;
(d) number of priests in America and alcoholism;
(e) In the start of the 20th century it was noted that there was a strong correlation between 'Number of radios' and 'Number of people in Insane Asylums.
6.
The study of correlation is of great significance because of reasons given below:
(a) To understand relationship between two or more variables: Correlation is very helpful when we want to study relationship between two or more variables.
(b) To find dependence: Correlation also helps in finding if one variable is dependent on other or not.
(c) Provides base for Regression Analysis: When two variables are correlated then the value of one variable can be estimated given the value of another variable using regression equations. (d) Helps in decision making: It helps in taking important decisions to a businessman, government and sociologists.
7.
Following assumptions are taken by Karl Pearson's while developing his coefficient of correlation
1. The correlation coefficient is symmetrical with respect to X and Y i.e. \(^{ \gamma }XY=^{ \gamma }YX\)
2. The correlation coefficient is independent of origin and unit of measurement i.e. \(^{ \gamma }XY=^{ \gamma }UV\)
3. The correlation coefficient lies between -1 and 1. i.e. \(-1\le \gamma \le +1\)
8.
There are mainly three methods of measuring correlation:
(a) Scatter diagram Method
(b) Karl Pearson's Product Moment correlation
(c) Spearman's Rank Correlation
9.
In this method the values of the two variables are plotted on a graph paper. One is taken along the horizontal (x-axis) and the other along the vertical (y-axis). By plotting the data, we get points (dots) on the graph which are generally scattered and hence the name 'Scatter Plot'. The manner in which these points are scattered, suggest the degree and the direction of correlation. The degree of correlation is denoted by, r' and its direction is given by the signs positive and negative.
10.
No, Zero correlation does not mean absence of correlation but it means absence of linear correlation. There may be a non linear relationship between two variables but variables which have non linear relationship will depict zero correlation when put to scatter diagram and low correlation when used Pearson's or Spearman's method. Consider a shape as shown below:
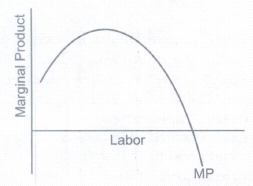
It will be taken as zero correlation but to a certain level, X and Yare positively related and thereafter their relationship becomes negative.
11.
Mathematical properties of correlation are as follows:
1. The correlation coefficient is symmetrical with respect to X and Y i.e. \(^{ \gamma }XY=^{ \gamma }YX\)
2. The correlation coefficient is independent of origin and unit of measurement i.e. \(^{ \gamma }XY=^{ \gamma }UV\)
3. The correlation coefficient lies between -1 and 1. i.e. \(-1\le \gamma \le +1\)
12.
Simple Correlation: When there are only two variables involved in a problem, it is called simple correlation. For example, study of correlation between height and weight is simple correlation.
Partial Correlation: when we study two variable keeping some other variables which have an influence constant, it is called partial correlation. For example, if we study price rise with reference to only crop failure, keeping other factors like external factors, government policies constant, it is partial correlation.
Multiple Correlation: When we study relationship between two or more variables simultaneously, it is called multiple correlation. For example, study of price rise with crop failure and weaknesses of government policies.
13.
Linear Correlation: Linear correlation said to exist when the ratio of change between X and Y is stable. In other words, when X and Y change in such a way that their ratio of change remains same throughout. It can be positive linear as will as negative linear correlation. In the given table, there is linear relation because throughout the ratio of change in X and change in Y is 1:2.
| X | Y |
| 1 | 10 |
| 2 | 8 |
| 3 | 6 |
| 4 | 4 |
| 5 | 4 |
| X | Y |
| 1 | 2 |
| 2 | 4 |
| 3 | 6 |
| 4 | 8 |
| 5 | 10 |
Non Linear Correlation: Non linear or curvi - linear correlation said to exist when the ratio of change between Xand Yis not stable. In other words, when X and Y change in such a way that their ratio of change does not remain same throughout. It can be positive non linear as will as negative non linear correlation. In the given table, there is non linear relation because t the ratio of change in X and change in Y is not constant.
| X | Y |
| 1 | 20 |
| 2 | 17 |
| 3 | 12 |
| 4 | 8 |
| 5 | 3 |
| X | Y |
| 1 | 5 |
| 2 | 14 |
| 3 | 22 |
| 4 | 28 |
| 5 | 29 |
.png)
.png)
14.
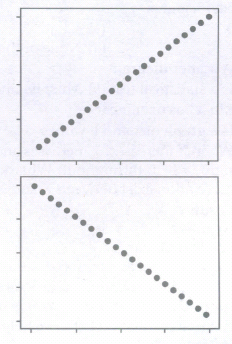
Positive Correlation: When X and Yare related in such a way that with increase in X, Y also increases and vice versa, it is called positive correlation. In other words, when both variables move in same direction, then variables are said to be positively related. For example, as height increases, weight also increases, so height and weight are positively related variables.
| X | Y |
| 1 | 2 |
| 2 | 4 |
| 3 | 6 |
| 4 | 8 |
| 5 | 10 |
Negative Correlation: When X and Yare related in such a way that with increase in X, Y decreases and vice versa, it is called negative correlation. In other words, when both variables move in opposite direction, then variables are said to be negatively related. For example, as income increases, demand for poor quality goods decreases, so income and poor quality goods are negatively related variables.
| X | Y |
| 1 | 10 |
| 2 | 8 |
| 3 | 6 |
| 4 | 4 |
| 5 | 2 |
15.
The difference between correlation and causation is that correlation is the mutual relation that exists between two or more things while causation is the fact that something causes an effect. The correlation between two variables does not imply that one is as a result of the other. Two or more variables considered to be related, in a statistical context, if their values change so that as the value of one variable increases or decreases so does the value of the other variable (although it may be in the opposite direction). For example, for the two variables "hours worked" and "income earned" there is a relationship between the two if the increase in hours worked is associated with an increase in income earned. If we consider the two variables "price" and "purchasing power", as the price of goods increases a person's ability to buy these goods decreases (assuming a constant income). But we cannot say that one is the cause of other.

11th Standard CBSE Syllabus & Materials
11th Standard CBSE
CBSE 11th Business Studies Forms of Business Organisation Sample Question Papers Study Material - QB365 Set A
NEW11th Standard CBSE
CBSE 11th Business Studies Business, Trade and Commerce Sample Question Papers Study Material - QB365 Set A
NEW11th Standard CBSE
CBSE 11th Physics Waves Sample Question Papers Study Material - QB365 Set A
NEW11th Standard CBSE
CBSE 11th Physics Kinetic Theory Sample Question Papers Study Material - QB365 Set A



CBSE 11th Standard CBSE Subjects
CBSE Standards










