
 100% FREE ACCESS
11th Standard CBSE Syllabus & Materials
11th Standard CBSE
CBSE 11th Economics PART-A - Presentation of Data - New Sample Question Papers Study Material - QB365 Set A
NEW11th Standard CBSE
CBSE 11th Economics PART-A - Organisation of Data - New Sample Question Papers Study Material - QB365 Set A
NEW11th Standard CBSE
CBSE 11th Economics PART-A - Collection of Data - New Sample Question Papers Study Material - QB365 Set A
NEW11th Standard CBSE
CBSE 11th Economics PART-A - Introduction to Economics and Statistics - New Sample Question Papers Study Material - QB365 Set A
NEW11th Standard CBSE
CBSE 11th Business Studies International Trade Sample Question Papers Study Material - QB365 Set A
NEW11th Standard CBSE
CBSE 11th Business Studies Evolution and Fundamentals of Business Sample Question Papers Study Material - QB365 Set A

Published on: 11/10/2019
Market Equilibrium with Simple Applications
Download CBSE Class 11th Standard CBSE undefined question papers, sample papers, important questions, and previous year solved papers in PDF format. Get free study materials, NCERT solutions, and exam preparation resources for Class 11th Standard CBSE undefined
Questions + Answers key
Take MCQ Biology Test
1.
With the help of a suitable diagram, explain the process of determination of equilibrium price of a commodity under perfectly competitive market.
2.
How will equilibrium price be reached when there is excess demand/excess supply? Explain with diagram.
3.
How is equilibrium price of a commodity determined? (Use diagram).
4.
How price and quantity are determined in the market when number of firms are fixed?
5.
On 19 December 2013, the following news item was printed in the Economic Times: Households in Southern India prefer to eat oranges for breakfast as banana plantations in Kerala have been destroyed and price of apples and grapes have also risen. Use a diagram and economic theory to analyse the impact of the rise in price of apples and grapes on the market of oranges.
6.
Market for a good is in equilibrium. There is increase in supply for this goods. Explain the chain of effects of this change. Use diagram.
7.
If at a given price of the commodity there is excess supply, how will the equilibrium price be reached? Explain with the help of a diagram.
8.
Using supply and demand curves, show how an increase in the price of shoes affects the price of a pair of socks and the number of pairs of socks bought and sold.
9.
How are equilibrium price and quantity affected when income of the consumers.
(i) Increase? (ii) Decrease?
10.
What will happen if the price prevailing in the market is
(i) Above the equilibrium price?
(ii) Below the equilibrium price?
1.
(i) Market equilibrium refers to that point which has come to be established under a given condition of demand and supply and has a tendency to stick to that level, i.e. where Demand = Supply.
(ii) If due to some disturbance we divert from our position the economic forces will work in such a manner that it could be driven back to its original position, i.e., where Demand = Supply. In short it is the position of rest.
(iii) It can be explained with the help of following schedule and diagram:
(a) (i) In the below schedule market equilibrium is determined at Price 3 where Market demand is equal to Market Supply.
(ii) At price 1 and 2, there is excess demand, which leads to rise in price, resulting tendency is expansion in supply.
(iii) Similarly, at price 4 and 5, there is excess supply, which leads to fall in price, resulting tendency is Contraction in supply.
| Price(Rs) | Demand(Units) | Supply(Units) | Surplus(+)or shortage(-) | Resulting Tendency |
| 1 | 5 | 1 | (-)4 | Expansion |
| 2 | 4 | 2 | (-)2 | Expansion |
| 3 | 3 | 3 | 0 | Market Equilibrium |
| 4 | 2 | 4 | (+)2 | Contraction |
| 5 | 1 | 5 | (+)4 | Contraction |
(b) (i) In the given diagram, price is measured on vertical axis, whereas quantity demanded and supply is measured on horizontal axis.
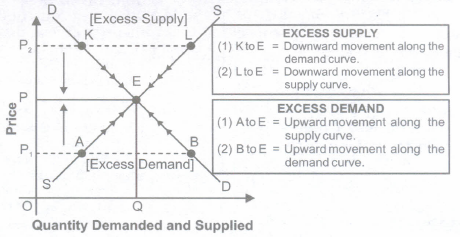
(ii) Suppose that initially the price in the market is P1. At this price, the consumer demand P1B and the producer supply P1 A, i.e. consumers want more than what the producer are willing to supply. There is excess demand equal to AB. So, price cannot stay on P1 as excess demand will create competition among the buyers and push the price up till we reach equilibrium.
Due torise in price from P1 to P, there is upward movement along the supply curve (expansion in supply) from A to E and upward movement along the demand curve (contraction in demand) from B to E.
(iii) Similarly, at price P2, the quantity demanded P2K is less than the quantity supplied P2L. There is excess supply, equal to KL, which will create competition among the sellers and lower the price. The price will keep falling as long as there is an excess supply.
Due to fall in price from P2 to P there is downward movement along the supply curve (contraction in supply) from L to E and downward movement along the demand curve (expansion in demand) from K to E.
(iv) The situation of zero excess demand and zero excess supply defines market equilibrium (E). Alternatively, it is defined by the equality between quantity demanded and quantity supplied. The price P is called equilibrium price and quantity Q is called equilibrium quantity.
2.
(i) Market equilibrium refers to that point which has come to be established under a given condition of demand and supply and has a tendency to stick to that level, i.e. where Demand = Supply.
(ii) If due to some disturbance we divert from our position the economic forces will work in such a manner that it could be driven back to its original position, i.e., where Demand = Supply. In short it is the position of rest.
(iii) It can be explained with the help of following schedule and diagram:
(a) (i) In the below schedule market equilibrium is determined at Price 3 where Market demand is equal to Market Supply.
(ii) At price 1 and 2, there is excess demand, which leads to rise in price, resulting tendency is expansion in supply.
(iii) Similarly, at price 4 and 5, there is excess supply, which leads to fall in price, resulting tendency is Contraction in supply.
| Price(Rs) | Demand(Units) | Supply(Units) | Surplus(+)or shortage(-) | Resulting Tendency |
| 1 | 5 | 1 | (-)4 | Expansion |
| 2 | 4 | 2 | (-)2 | Expansion |
| 3 | 3 | 3 | 0 | Market Equilibrium |
| 4 | 2 | 4 | (+)2 | Contraction |
| 5 | 1 | 5 | (+)4 | Contraction |
(b) (i) In the given diagram, price is measured on vertical axis, whereas quantity demanded and supply is measured on horizontal axis.
(ii) Suppose that initially the price in the market is P1. At this price, the consumer demand P1B and the producer supply P1 A, i.e. consumers want more than what the producer are willing to supply. There is excess demand equal to AB. So, price cannot stay on P1 as excess demand will create competition among the buyers and push the price up till we reach equilibrium.
Due to rise in price from P1 to P, there is upward movement along the supply curve (expansion in supply) from A to E and upward movement along the demand curve (contraction in demand) from B to E.
(iii) Similarly, at price P2, the quantity demanded P2K is less than the quantity supplied P2L. There is excess supply, equal to KL, which will create competition among the sellers and lower the price. The price will keep falling as long as there is an excess supply.
Due to fall in price from P2 to P there is downward movement along the supply curve (contraction in supply) from L to E and downward movement along the demand curve (expansion in demand) from K to E.
(iv) The situation of zero excess demand and zero excess supply defines market equilibrium (E). Alternatively, it is defined by the equality between quantity demanded and quantity supplied. The price P is called equilibrium price and quantity Q is called equilibrium quantity.
3.
(i) Market equilibrium refers to that point which has come to be established under a given condition of demand and supply and has a tendency to stick to that level, i.e. where Demand = Supply.
(ii) If due to some disturbance we divert from our position the economic forces will work in such a manner that it could be driven back to its original position, i.e., where Demand = Supply. In short it is the position of rest.
(iii) It can be explained with the help of following schedule and diagram:
(a) (i) In the below schedule market equilibrium is determined at Price 3 where Market demand is equal to Market Supply.
(ii) At price 1 and 2, there is excess demand, which leads to rise in price, resulting tendency is expansion in supply.
(iii) Similarly, at price 4 and 5, there is excess supply, which leads to fall in price, resulting tendency is Contraction in supply.
| Price(Rs) | Demand(Units) | Supply(Units) | Surplus(+)or shortage(-) | Resulting Tendency |
| 1 | 5 | 1 | (-)4 | Expansion |
| 2 | 4 | 2 | (-)2 | Expansion |
| 3 | 3 | 3 | 0 | Market Equilibrium |
| 4 | 2 | 4 | (+)2 | Contraction |
| 5 | 1 | 5 | (+)4 | Contraction |
(b) (i) In the given diagram, price is measured on vertical axis, whereas quantity demanded and supply is measured on horizontal axis.
(ii) Suppose that initially the price in the market is P1. At this price, the consumer demand P1B and the producer supply P1A, i.e. consumers want more than what the producer are willing to supply. There is excess demand equal to AB. So, price cannot stay on P1 as excess demand will create competition among the buyers and push the price up till we reach equilibrium.
Due to rise in price from P1 to P, there is upward movement along the supply curve (expansion in supply) from A to E and upward movement along the demand curve (contraction in demand) from B to E.
(iii) Similarly, at price P2, the quantity demanded P2K is less than the quantity supplied P2L. There is excess supply, equal to KL, which will create competition among the sellers and lower the price. The price will keep falling as long as there is an excess supply.
Due to fall in price from P2 to P there is downward movement along the supply curve (contraction in supply) from L to E and downward movement along the demand curve (expansion in demand) from K to E.
(iv) The situation of zero excess demand and zero excess supply defines market equilibrium (E). Alternatively, it is defined by the equality between quantity demanded and quantity supplied. The price P is called equilibrium price and quantity Q is called equilibrium quantity.
4.
(i) Market equilibrium refers to that point which has come to be established under a given condition of demand and supply and has a tendency to stick to that level, i.e. where Demand = Supply.
(ii) If due to some disturbance we divert from our position the economic forces will work in such a manner that it could be driven back to its original position, i.e., where Demand = Supply. In short it is the position of rest.
(iii) It can be explained with the help of following schedule and diagram:
(a) (i) In the below schedule market equilibrium is determined at Price 3 where Market demand is equal to Market Supply.
(ii) At price 1 and 2, there is excess demand, which leads to rise in price, resulting tendency is expansion in supply.
(iii) Similarly, at price 4 and 5, there is excess supply, which leads to fall in price, resulting tendency is Contraction in supply.
| Price(Rs) | Demand(Units) | Supply(Units) | Surplus(+)or shortage(-) | Resulting Tendency |
| 1 | 5 | 1 | (-)4 | Expansion |
| 2 | 4 | 2 | (-)2 | Expansion |
| 3 | 3 | 3 | 0 | Market Equilibrium |
| 4 | 2 | 4 | (+)2 | Contraction |
| 5 | 1 | 5 | (+)4 | Contraction |
(b) (i) In the given diagram, price is measured on vertical axis, whereas quantity demanded and supply is measured on horizontal axis.
(ii) Suppose that initially the price in the market is P1. At this price, the consumer demand P1B and the producer supply P1A, i.e. consumers want more than what the producer are willing to supply. There is excess demand equal to AB. So, price cannot stay on P1 as excess demand will create competition among the buyers and push the price up till we reach equilibrium.
Due torise in price from P1 to P, there is upward movement along the supply curve (expansion in supply) from A to E and upward movement along the demand curve (contraction in demand) from B to E.
(iii) Similarly, at price P2, the quantity demanded P2K is less than the quantity supplied P2L. There is excess supply, equal to KL, which will create competition among the sellers and lower the price. The price will keep falling as long as there is an excess supply.
Due to fall in price from P2 to P there is downward movement along the supply curve (contraction in supply) from L to E and downward movement along the demand curve (expansion in demand) from K to E.
(iv) The situation of zero excess demand and zero excess supply defines market equilibrium (E). Alternatively, it is defined by the equality between quantity demanded and quantity supplied. The price P is called equilibrium price and quantity Q is called equilibrium quantity.
5.
When the price of apples and grapes rises, consumers will substitute with these fruits with the relatively cheaper oranges. Thus, demand for oranges will increase and the demand curve shifts rightwards from DD to D1D1
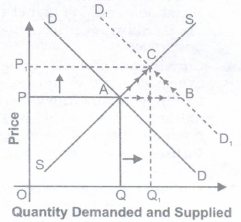
With new demand curve D1D1 there is excess demand at initial price OP because at price OP demand is PB and supply is PA; so there is excess demand of AB at price OP. Due to this excess demand, competition among the consumer will raise the price. With the rise in price there is upward movement along the demand curve (contraction in demand) from B to C and similarly, there is upward movement along the supply curve(expansion in supply) from A to C. so, finally, equilibrium price rises from OP to OP1 and equilibrium quantity also rises from OQ to OQ1
Note: Therefore,the equilibrium price of ranges increases and the equilibrium quantity also increases when the price of apples and grapes rises in Southern India.
Value: Analytic
6.
As given in the examination problem that market for a good is in equilibrium. So, we assume that initial price is OP as shown in given figure:
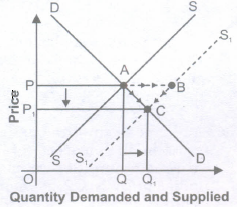
In the given figure price is on vertical axis and quantity demanded and supplied is on horizontal axis. But due to increase in supply the supply curve shifts rightward from SS to S1S1, With new supply curve S1S1 there is excess supply at initial price OP because at price OP, supply is PB and demand is PA, so there is excess supply of AB at price OP. Due to this excess supply competition among the producer will make the price fall. Due to this fall in price there is downward movement along the supply curve (Contraction in supply) from B to C and similarly, there is downward movement along the demand curve (Expansion in demand) from A to C. So, finally, equilibrium price falls from OP to OP1 and equilibrium quantity rises from OQ to OQ1
Conclusion
Due to increase in supply,
(i) Equilibrium price falls from OP to OP1
(ii) Equilibrium quantity rises from OQ to OQ1
7.
If at a given price there is excess supply as shown in the given figure.
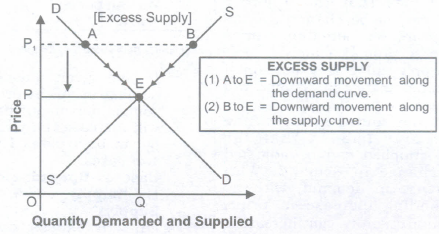
In the given figure, the excess supply of AB at price P1 will create a competition among the producers, which will reduce the price from P1 to P. It can be explained in the following cases:
(i) Downward movement along the supply curve (Contraction in supply): Due to excess supply of AB, the competition among the producers will reduce the price. As we know, positive relationship exists between price and quantity supplied. So fall in price P1 to P leads to fall in supply from B to E.
(ii) Downward movement along the demand curve (Expansion in demand): Due to excess supply of AB, the competition among the producers will reduce the price. As we know inverse. relationship exits between price and quantity demanded. So, fall in price from P1 to P, leads to rise in demand from A to E. It can be explained with the help of the following schedule
| Price(Rs) | Demand | Supply | Resulting tendency |
|---|---|---|---|
| 5 | 1 | 5 | Excess Demand |
| 4 | 2 | 4 | Excess Demand |
| 3 | 3 | 3 | Equilibrium |
In the above schedule at price 5, there is excess supply. This excess supply, leads to fall in price till we reach the equilibrium at price 3.
Note: Contraction in supply and expansion in demand have to be done simultaneously to reach the equilibrium
8.
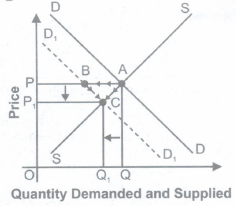
(i) As we know, shoes and pair of socks are complementary good to each other. As, price of complementary goods are inversely related with the demand of given commodity. So, rise in price of shoes (complementary good) decreases the demand for given commodity (pair of socks), and demand curve shifts leftward as shown in given figure:
 I
I
(ii) In the given diagram, price is on vertical axis and quantity demanded and supplied is on horizontal axis. Initially,the equilibrium price is OP and equilibrium quantity is OQ.
(iii) But due to rise in price of complementary good the demand curve of given commodity shifts leftward from DD to D1D1.
(iv) With new demand curve Dp there is excess supply at initial price OP because at price OP demand is PB and supply is PA; so, there is excess supply of AB at price OP.
(v) Due to this excess supply, competition among the producer will fall the price. Due to fall in price, there is downward movement along the demand curve (Expansion in demand) from B to C and similarly there is downward movement along the supply curve (Contraction in supply) from A to C. So, finally, the equilibrium price falls from OP to OP1 and equilibrium quantity also falls from OQ to OQ1.
So, due to rise in price of complementary goods,
(a) Equilibrium price falls from OP to OP1, and
(b) Equilibrium quantity also falls from OQ to OQ1
9.
(i) Increase in Income: When income increases, demand curve will shift to rightward in case of Normal good as shown below:
(a) As, we know normal goods are those whose quantity demanded varies positively with the change in income. As income of a consumer rises and goods consumed is normal goods equilibrium price and equilibrium quantity both rise. It can be shown with the help of the given figure.
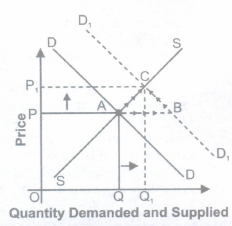
(b) In the given figure, price of normal goods is measured on vertical axis and quantity demanded and supplied are measured on horizontal axis. Initially, the equilibrium price is OP and equilibrium quantity is OQ.
(c) But as given in the examination problem when income of a consumer rises the demand of normal goods increases shifting the demand curve to the right from DD to D1D1.
(d)With new demand curve DP1, there is excess demand at initial price OP because at price OP demand is PB and supply is PA; so there is excess demand of AB at price OP.
(e) Due to this excess demand, competition among the consumer will raise the price. With the rise in price there is upward movement along the demand curve (contraction in demand) from B to C and similarly, there is upward movement along the supply curve(expansion in supply) from A to C . So, finally, equilibrium price rises from OP to OP1, and equilibrium quantity also rises from OQ to OQ1
Conclusion
Due to increase in income of a buyer for normal goods,
(a) Equilibrium price rises from OP to OP1·
(b) Equilibrium quantity also rises from OQ to OQ1
(ii) Decrease in income: When income decreases, demand curve will shift to leftward in case of Normal good as shown below:
(a) As we know that normal goods are those whose quantity demanded varies positively with the change in income. As given in the examination problem if income of a consumer falls and goods consumed is normal goods, then both equilibrium price and the equilibrium quantity fall. It can be shown with the help of the given figure.
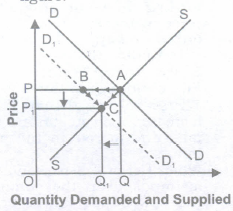
(b) In the given figure, price of normal goods is measured on vertical axis and quantity demanded and supplied are measured on horizontal axis. Initially, the equilibrium price is OP and equilibrium quantity is OQ.
(c) But as given in the examination problem when income of a consumer rises the demand of normal goods increases shifting the demand curve to the right from DD to D1D1.
(d) With new demand curve D1D1 there is excess demand at initial price OP because at price OP demand is PB and supply is PA; so there is excess demand of AB at price OP.
(e) Due to this excess supply competition among the producer will fall the price. Due to fall in price there is downward movement along the demand curve (Expansion in demand) from B to C and similarly, there is downward movement along the supply curve (Contraction in supply) from A to C. So, finally, the equilibrium price falls from OP to OP1 and equilibrium quantity also falls from OQ to OQ1
Conclusion
Due to decrease in income of a buyer for normal goods,
(a) Equilibrium price falls from OP to OP1
(b) Equilibrium quantity also falls from OQ to OQ1
10.
(i) Market equilibrium refers to that point which has come to be established under a given condition of demand and supply and has a tendency to stick to that level, i.e. where Demand = Supply.
(ii) If due to some disturbance we divert from our position the economic forces will work in such a manner that it could be driven back to its original position, i.e., where Demand = Supply. In short it is the position of rest.
(iii) It can be explained with the help of following schedule and diagram:
(a) (i) In the below schedule market equilibrium is determined at Price 3 where Market demand is equal to Market Supply.
(ii) At price 1 and 2, there is excess demand, which leads to rise in price, resulting tendency is expansion in supply.
(iii) Similarly, at price 4 and 5, there is excess supply, which leads to fall in price, resulting tendency is Contraction in supply.
| Price(Rs) | Demand(Units) | Supply(Units) | Surplus(+)or shortage(-) | Resulting Tendency |
| 1 | 5 | 1 | (-)4 | Expansion |
| 2 | 4 | 2 | (-)2 | Expansion |
| 3 | 3 | 3 | 0 | Market Equilibrium |
| 4 | 2 | 4 | (+)2 | Contraction |
| 5 | 1 | 5 | (+)4 | Contraction |
(b) (i) In the given diagram, price is measured on vertical axis, whereas quantity demanded and supply is measured on horizontal axis.
(ii) Suppose that initially the price in the market is P1. At this price, the consumer demand P1B and the producer supply P1A, i.e. consumers want more than what the producer are willing to supply. There is excess demand equal to AB. So, price cannot stay on P1 as excess demand will create competition among the buyers and push the price up till we reach equilibrium.
Due torise in price from P1 to P, there is upward movement along the supply curve (expansion in supply) from A to E and upward movement along the demand curve (contraction in demand) from B to E.
(iii) Similarly, at price P2, the quantity demanded P2K is less than the quantity supplied P2L. There is excess supply, equal to KL, which will create competition among the sellers and lower the price. The price will keep falling as long as there is an excess supply.
Due to fall in price from P2 to P there is downward movement along the supply curve (contraction in supply) from L to E and downward movement along the demand curve (expansion in demand) from K to E.
(iv) The situation of zero excess demand and zero excess supply defines market equilibrium (E). Alternatively, it is defined by the equality between quantity demanded and quantity supplied. The price P is called equilibrium price and quantity Q is called equilibrium quantity.

11th Standard CBSE Syllabus & Materials
11th Standard CBSE
CBSE 11th Business Studies Forms of Business Organisation Sample Question Papers Study Material - QB365 Set A
NEW11th Standard CBSE
CBSE 11th Business Studies Business, Trade and Commerce Sample Question Papers Study Material - QB365 Set A
NEW11th Standard CBSE
CBSE 11th Physics Waves Sample Question Papers Study Material - QB365 Set A
NEW11th Standard CBSE
CBSE 11th Physics Kinetic Theory Sample Question Papers Study Material - QB365 Set A



CBSE 11th Standard CBSE Subjects
CBSE Standards










