
 100% FREE ACCESS
11th Standard CBSE Syllabus & Materials
11th Standard CBSE
CBSE 11th Economics PART-A - Presentation of Data - New Sample Question Papers Study Material - QB365 Set A
NEW11th Standard CBSE
CBSE 11th Economics PART-A - Organisation of Data - New Sample Question Papers Study Material - QB365 Set A
NEW11th Standard CBSE
CBSE 11th Economics PART-A - Collection of Data - New Sample Question Papers Study Material - QB365 Set A
NEW11th Standard CBSE
CBSE 11th Economics PART-A - Introduction to Economics and Statistics - New Sample Question Papers Study Material - QB365 Set A
NEW11th Standard CBSE
CBSE 11th Business Studies International Trade Sample Question Papers Study Material - QB365 Set A
NEW11th Standard CBSE
CBSE 11th Business Studies Evolution and Fundamentals of Business Sample Question Papers Study Material - QB365 Set A

Published on: 28/09/2019
Organisation of Data
Download CBSE Class 11th Standard CBSE undefined question papers, sample papers, important questions, and previous year solved papers in PDF format. Get free study materials, NCERT solutions, and exam preparation resources for Class 11th Standard CBSE undefined
Questions + Answers key
Take MCQ Biology Test
1.
Differentiate between quantitative and qualitative classification
2.
How is inclusive series converted into exclusive series?
3.
What do you mean by loss of information in organized data?
4.
What is a cumulative frequency distribution? What are its two types?
5.
Distinguish between Absolute and relative frequencies
6.
Differentiate between spatial and chronological classification with example.
7.
What is classification of data? What should be its characteristics?
8.
Use the data given below that relate to monthly household expenditure (in Rs) on food of 50 households and answer the questions.
| 1904 | 1559 | 3473 | 1735 | 2760 | 2041 |
| 1612 | 1753 | 1855 | 4439 | 5090 | 1085 |
| 1823 | 2346 | 1523 | 1211 | 1360 | 1110 |
| 2152 | 1183 | 1218 | 1315 | 1105 | 2628 |
| 2712 | 4248 | 1812 | 1264 | 1183 | 1171 |
| 1007 | 1180 | 1953 | 1137 | 2048 | 2025 |
| 1583 | 1324 | 2621 | 3676 | 1397 | 1832 |
| 1962 | 2177 | 2575 | 1293 | 1365 | 1146 |
| 3222 | 1396 |
(i) Obtain the range of monthly household expenditure on food.
(ii) Divide the range into appropriate number of class intervals and obtain the frequency distribution of expenditure.
(iii) Find the number of households whose monthly expenditure on food is:
9.
Find class intervals of following series.
| Mid Values | 2 | 4 | 6 | 8 | 10 |
| Frequency | 3 | 2 | 6 | 4 | 3 |
1.
(i) Quantitative classification: In quantitative classification the data are classified according to some characteristics that can be measured numerically such as height, weight, production, income, marks secured by the students etc.
Example: Students of a college may be classified according to there weights as given in the table
| Weight (in Kg) | No of students |
| 30-40 40-50 50-60 60-70 |
20 25 40 45 |
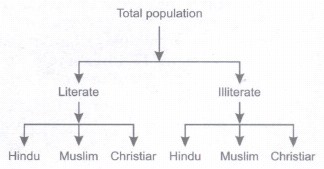
(ii) Qualitative classification: In qualitative classification the data are classified on the basis of attributes or quality such as sex, colour of hair, literacy, religion etc.
2.
Following steps are followed to convert an exclusive series into an inclusive series.
(a) Find the difference between upper limit of preceding class and lower limit of succeeding class.
(b) Divide this difference by 2.
(c) Add this number in upper limit of all classes and deduct this number from lower limit of all classes.
For example, if classes are 0 - 9, 10 - 19, 20 29 and so on. Then the difference between upper limit and lower limit of two succeeding classes is one. When we divide it by 2, we get 0.5. Therefore on deducting this number from upper limit and adding this number in lower limit, we can get new class intervals as- (-) 0.5 - 9.5,9.5 - 19.5, 19.5 and so on.
3.
When we group data in a continuous series as shown below, we get to know only the fact that 4 students have marks more than equal to or more than 0 and less than 10 but we do not know the exact figures.
| Marks | Frequency |
| 0-10 | 4 |
| 10-20 | 7 |
| 20-30 | 4 |
| 30-40 | 3 |
| 40-50 | 2 |
Suppose all 4 had 1 mark, they will be in class 0-10 and even when all 4 have 9 marks, they will be in class 0-10. It is called loss of information in organized data.
4.
Cumulative Frequency series is one in which the frequencies are continuously added corresponding to each class interval of the series. It can be prepared from discrete frequency distribution as well as continuous frequency distribution. It can be of two types:
(a) Cumulative Frequency Series of less than type: It is prepared on the basis of upper limit and show how many items lie below some value.
(b) Cumulative Frequencies of more than type: These are prepared on the basis of lower limit of the classes and shows how many items lie above a given value.
Let us take an example to understand how a simple series is converted into cumulative frequency series.
Suppose we know the marks distribution of 50 students in the form of a simple continuous frequency distribution.
| Marks | Frequency |
| 0-10 | 4 |
| 10-20 | 7 |
| 20-30 | 4 |
| 30-40 | 3 |
| 40-50 | 2 |
Cumulative frequency series of less than type
| Marks | Frequency |
| Less than 10 | 4 |
| Less than 20 | 4+7=11 |
| Less than 30 | 11+4 = 15 |
| Less than 40 | 15+3 = 18 |
| Less than 50 | 18+2 =20 |
Cumulative frequency series of more than type
| Marks | Frequency |
| More than 10 | 20 |
| More than 20 | 20-4= 16 |
| More than 30 | 16-7=9 |
| More than 40 | 9-4=5 |
| More than 50 | 5-3=2 |
5.
As frequencies shown in different types of series discussed so far were absolute frequencies. These were shown in absolute numbers. Sometimes, it is important to know the relative importance of each class. Therefore, frequencies are shown in percentage of total observations. An example is given below:
| Marks | Absolute Frequency | Relative Frequency(%) |
| 0-10 | 4 | 20 |
| 10-20 | 7 | 35 |
| 20-30 | 4 | 20 |
| 30-40 | 3 | 15 |
| 40-50 | 2 | 10 |
| Total | 20 | 100 |
6.
Spatial Classification: In spatial classification, data are classified according to geographical areas.
Example: Statewise classification of production of food grains in India:
| State | Production of food grains (in tons) |
| Orissa A.P U.P Assam |
3,00,000 2,50,000 22,00,000 1,00,00,000 |
Chronological classification:
In this type of classification the data are classified according to different time periods.
Example: Population of India for different time periods.
Profits of a business establishment over different years.
| Year | Population (in crores) |
| 1921 1931 1941 1951 |
24.8 27.3 31.8 35.6 |
7.
A classification is an ordered set of related categories used to group data according to its similarities. It consists of codes and descriptors and allows survey responses to be put into meaningful categories in order to produce useful data. To be meaningful, classification should have following characteristics.
(a) It should be unambiguous: Classification aims at removing ambiguity. It is a must that all classes should be defined in such a way that there is no room for doubt and confusion and each item must fit to at least and at most one class.
(b) The classes must not overlap: None of the item should be eligible to be a part of more than one class.
(c) It should be stable: Without stability, classified data will not be fit for comparison.
(d) Classification should be according to purpose of enquiry: For example, if I need to classify my students into two groups for bus arrangement, it will be better to use geographical classification. If the purpose is judging their academic performance the quantitative classification is more suitable. If purpose is judging their value system then qualitative classification is recommended.
(e) It should be mathematically accurate: The test of mathematical accuracy is confirmation of total items in the series with total items in the universe.
(f) It should be flexible: It should be flexible. It should be possible to adjust the series to new situations and circumstances. With change in time some figures may become obsolete and other may become more relevant.
8.
(i) Range = Largest Value - Smallest Value
= 5090-1007= 4083
(ii)
| Class Interval | Frequency | More than CF |
| 1000-2000 | 33 | 50 |
| 2000-3000 | 11 | 17 |
| 3000-4000 | 3 | 6 |
| 4000-5000 | 2 | 3 |
| 5000-6000 | 1 | 1 |
(iii) (a) 33
(b) 6
(c) 19
9.
| Mid Value | Frequency | Classes |
| 2 | 3 | 1-3 |
| 4 | 2 | 3-5 |
| 6 | 6 | 5-7 |
| 8 | 4 | 7-9 |
| 10 | 3 | 9-11 |

11th Standard CBSE Syllabus & Materials
11th Standard CBSE
CBSE 11th Business Studies Forms of Business Organisation Sample Question Papers Study Material - QB365 Set A
NEW11th Standard CBSE
CBSE 11th Business Studies Business, Trade and Commerce Sample Question Papers Study Material - QB365 Set A
NEW11th Standard CBSE
CBSE 11th Physics Waves Sample Question Papers Study Material - QB365 Set A
NEW11th Standard CBSE
CBSE 11th Physics Kinetic Theory Sample Question Papers Study Material - QB365 Set A



CBSE 11th Standard CBSE Subjects
CBSE Standards










