
 100% FREE ACCESS
11th Standard CBSE Syllabus & Materials
11th Standard CBSE
CBSE 11th Economics PART-A - Presentation of Data - New Sample Question Papers Study Material - QB365 Set A
NEW11th Standard CBSE
CBSE 11th Economics PART-A - Organisation of Data - New Sample Question Papers Study Material - QB365 Set A
NEW11th Standard CBSE
CBSE 11th Economics PART-A - Collection of Data - New Sample Question Papers Study Material - QB365 Set A
NEW11th Standard CBSE
CBSE 11th Economics PART-A - Introduction to Economics and Statistics - New Sample Question Papers Study Material - QB365 Set A
NEW11th Standard CBSE
CBSE 11th Business Studies International Trade Sample Question Papers Study Material - QB365 Set A
NEW11th Standard CBSE
CBSE 11th Business Studies Evolution and Fundamentals of Business Sample Question Papers Study Material - QB365 Set A

Published on: 04/10/2019
Producer Equilibrium
Download CBSE Class 11th Standard CBSE undefined question papers, sample papers, important questions, and previous year solved papers in PDF format. Get free study materials, NCERT solutions, and exam preparation resources for Class 11th Standard CBSE undefined
Questions + Answers key
Take MCQ Biology Test
1.
Giving reasons identify the equilibrium level of output and find profit at this output using 'Marginal Cost and Marginal Revenue' approach from the following:
| Output(Units) | 1 | 2 | 3 | 4 | 5 |
|---|---|---|---|---|---|
| Total Cost(Rs) | 7 | 13 | 20 | 28 | 37 |
| Total Revenue(Rs) | 7 | 14 | 21 | 28 | 35 |
2.
From the following schedule find out the level of output at which the producer is in equilibrium. Calculate profit. Give reasons for your answer.
| Output (Units) | 1 | 2 | 3 | 4 | 5 | 6 | 7 |
| Price (Rs) | 24 | 24 | 24 | 24 | 24 | 24 | 24 |
| Total cost(Rs) | 26 | 50 | 72 | 92 | 115 | 139 | 165 |
3.
Why is the equality between marginal cost and marginal revenue necessary for a firm to be in equilibrium? Is it sufficient to ensure equilibrium? Explain
4.
Explain producer's equilibrium with the help of MC and MRschedules. Use Diagram.
5.
The following table shows the total cost schedule of a competitive firm. It is given that the price of the goods is Rs10. Calculate the profit at each output level. Find the profit maximising level of output.
| Output Sold | 0 | 1 | 2 | 3 | 4 | 5 | 6 | 7 | 8 | 9 | 10 |
|---|---|---|---|---|---|---|---|---|---|---|---|
| TC (in Rs) | 5 | 15 | 22 | 27 | 31 | 38 | 48 | 63 | 81 | 101 | 123 |
6.
Explain why will a producer not be in equilibrium if the conditions of equilibrium are not met.
7.
Elaborate the implication of the conditions of equilibrium of a firm
8.
Explain the conditions of a producer's equilibrium in terms of marginal cost and marginal revenue. Use diagram
9.
Explain the producer's equilibrium with MR/MC approach (when Price remains constant with the rise in output).
10.
What conditions must hold if a profit-maximizing firm produces positive output in a competitive market?
1.
| Output (Q) (in units) | TC(Rs) | TR(Rs) | MR(Rs)MRn =TRn-TRn-1 | MC(Rs)MCn =TCn-TCn-1 | Profit |
| 1 | 7 | 7 | 7 | - | 0 |
| 2 | 13 | 14 | 7 | 6 | 1 |
| 3 | 20 | 21 | 7 | 7 | 1 |
| 4 | 28 | 28 | 7 | 8 | 0 |
| 5 | 37 | 35 | 7 | 9 | -2 |
The producer will be at equilibrium at 3 units of output which satisfy both the conditions of producer's equilibrium.
(i) MC= MR
(ii) MC must be rising.
2.
| Output (Q)(in units) | Price(P)(Rs) | TC(Rs) | TR(Rs)=Q x R | Profit (Rs)=TR - TC | Marginal Revenue (MR)(Rs) | Marginal Cost (MC)(Rs) |
|---|---|---|---|---|---|---|
| 1 | 24 | 26 | 24 | -2 | 24 | - |
| 2 | 24 | 50 | 48 | -2 | 24 | 24 |
| 3 | 24 | 72 | 72 | 0 | 24 | 22 |
| 4 | 24 | 92 | 96 | 4 | 24 | 20 |
| 5 | 24 | 115 | 120 | 5 | 24 | 23 |
| 6 | 24 | 139 | 144 | 5 | 24 | 24 |
| 7 | 24 | 165 | 168 | 3 | 24 | 26 |
The producer achieves equilibrium at 6 units of output. At output levels 5th and 6th unit, the difference between TR and TC, i.e., profit is maximum, which is equal to 5 in both the cases. But the producer is in equilibrium at the 6th unit only where MR = MC (= 24) and MC is rising.
3.
When there is no fixed price and price falls with the rise in output, MR curve slope downwards. Producer aims to produce that level of output. at which MC is equal to MRand MC curve cuts the MR curve from below. Let us understand this with the help of following table:
| Units of Commodity | MR(Rs) | MC(Rs) |
| 1 | 10 | 9 |
| 2 | 9 | 7 |
| 3 | 8 | 6 |
| 4 | 7 | 7 |
| 5 | 6 | 8 |
| 6 | 5 | 9 |
According to Table, both the conditions of equilibrium are satisfied at 4 units of output. MC is equal to MR and MC is rising. MC is more than MR when output is produced after 4 units of output. So, Producer's Equilibrium will be achieved at 4 units of output. Letus understand the determination of equilibrium with the help of a diagram:
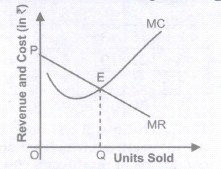
Producer's Equilibrium is determined at OQ level of output corresponding to point E as at this point, MC= MR and MC curve cuts MR curve from below.
In Figure, output is shown on the horizontal axis and revenue and costs on the vertical axis. Producer's equilibrium will be determined at OQ level of output corresponding to point E because at this, the following two conditions are met:
(i) MC = MR; and
(ii) MCcurve cuts the MR curve from below.
When MR > MC, then producer will continue to produce as long as MR becomes equal to MC. It is so because firm will find it profitable to raise the output level.
When MR< MC, then producer will cut down the production as long as MR becomes equal to MC. It is so because firm will find it unprofitable to produce an extra unit. So, it starts reducing the level of output till MR= MC.
So, the producer is at equilibrium at OQ units of output.
4.
When there is no fixed price and price falls with the rise in output, MR curve slope downwards. Producer aims to produce that level of output. at which MC is equal to MRand MC curve cuts the MR curve from below. Let us understand this with the help of following table:
| Units of Commodity | MR(Rs) | MC(Rs) |
| 1 | 10 | 9 |
| 2 | 9 | 7 |
| 3 | 8 | 6 |
| 4 | 7 | 7 |
| 5 | 6 | 8 |
| 6 | 5 | 9 |
According to Table, both the conditions of equilibrium are satisfied at 4 units of output. MC is equal to MR and MC is rising. MC is more than MR when output is produced after 4 units of output. So, Producer's Equilibrium will be achieved at 4 units of output. Letus understand the determination of equilibrium with the help of a diagram:
Producer's Equilibrium is determined at OQ level of output corresponding to point E as at this point, MC= MR and MC curve cuts MR curve from below.
In Figure, output is shown on the horizontal axis and revenue and costs on the vertical axis. Producer's equilibrium will be determined at OQ level of output corresponding to point E because at this, the following two conditions are met:
(i) MC = MR; and
(ii) MCcurve cuts the MR curve from below.
When MR > MC, then producer will continue to produce as long as MR becomes equal to MC. It is so because firm will find it profitable to raise the output level.
When MR< MC, then producer will cut down the production as long as MR becomes equal to MC. It is so because firm will find it unprofitable to produce an extra unit. So, it starts reducing the level of output till MR= MC.
So, the producer is at equilibrium at OQ units of output.
5.
| Quantity sold (Q) (in units) | TC (Rs) | Price (P)(Rs) | TR(Rs)TR=QxP | Marginal Revenue(MR)(Rs) | Marginal Cost(Mc)(Rs) |
|---|---|---|---|---|---|
| 0 | 5 | 10 | 0 | - | - |
| 1 | 15 | 10 | 10 | 10 | 10 |
| 2 | 22 | 10 | 20 | 10 | 7 |
| 3 | 27 | 10 | 30 | 10 | 5 |
| 4 | 31 | 10 | 40 | 10 | 4 |
| 5 | 38 | 10 | 50 | 10 | 7 |
| 6 | 48 | 10 | 60 | 10 | 10 |
| 7 | 63 | 10 | 70 | 10 | 15 |
| 8 | 81 | 10 | 80 | 10 | 18 |
| 9 | 101 | 10 | 90 | 10 | 20 |
| 10 | 123 | 10 | 100 | 10 | 22 |
The producer achieves equilibrium at 6 units of output because at this point MC = MR and MC is rising.
6.
The profit-maximizing level of output is always determined where,
(i) MR = MC
(ii) MC must be rising. In other words, where price is equal to MC.
If price is not equal to MC, profit-maximizing condition cannot hold. It can be explained with the help of the following two cases:
Case 1: Price Greater Than MC
(i) In the given figure at output level q2, the market price is greater than marginal cost.
(ii) To show that q2 is not a profit maximizing level of output, we have taken q3 output level, which is right of q2.
(iii) Suppose the firm increases its output level from q2 to q3. The increase in total revenue of the firm from this output is the market price multiplied by the change in quantity (\(\triangle\) TR= market price x \(\triangle\)Q), that is, the area of rectangle q2q3CB.
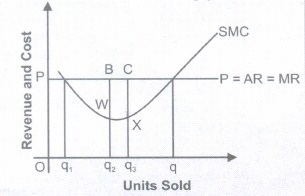
(iv) On the other hand, the increase in total cost with this increase in output is the area of the region q2q3XW.
(v) But, a comparison of the two area shows that the firm's profit is higher when output level is q2q3 rather than %. So, % is not a profit maximizing level of output.
Case 2: Price Less Than MC
(i) In the given figure at output level q2, the market price is less than marginal cost.
(ii) To show that %is not a profit maximizing level of output, we have taken q3 output level, which is left of q2.
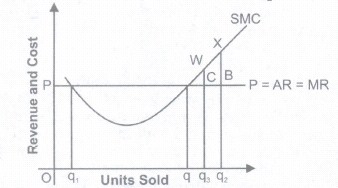
(iii) Suppose now, that the firm reduce its output level from q2 to q3. The decrease in total revenue of the firm from this output is the market price multiplied by the change in quantity (\(\triangle\)TR = market price x \(\triangle\)Q), that is, the area of rectangle q2q3CB.
(iv) On the other hand, the decrease in total cost with this decrease in output is the area of the region q2q3WX.
(v) But, a comparison of the two area shows, that by reducing the output from q2 to q3, the decrease in cost is more than the loss in revenue.
So, q2 is not a profit maximizing level of output.
7.
The conditions must hold if a profit-maximizing firm produces positive output in a competitive market when price is constant under MR/MC approach is determined where,
(i) MR = MC (ii) MC must be rising
| Output (Units) | Marginal Revenue Rs | Marginal Cost Rs |
| 1 | 8 | 10 |
| 2 | 8 | 8 |
| 3 | 8 | 7 |
| 4 | 8 | 8 |
| 5 | 8 | 9 |
According to Table, both the conditions of equilibrium are satisfied at 4 units of output. MC is equal to MR and MC is rising. MC is more than MR when output is produced after 4 units of output. So, Producer's Equilibrium will be achieved at 4 units of output. However, MR is equal to MC at 2 units of output also. But, second condition is not fulfilled here.
Let us understand the determination of equilibrium with the help of a diagram:
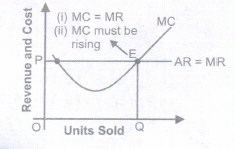
Producer's Equilibrium is determined at OQ level of output corresponding to point E as at this point, MC= MR and MC curve cuts MR curve from below.
In Figure, output is shown on the horizontal axis and revenue and costs on the vertical axis. Producer's equilibrium will be determined at OQ level of output corresponding to point E because at this, the following two conditions are met:
(i) MC = MR;
(ii) MC curve cuts the MR curve from below.
When MR > MC, then producer will continue to produce as long as MR becomes equal to MC. It is so because firm will find it profitable to raise the output level.
When MR< MC, then producer will cut down the production as long as MR becomes equal to MC. It is so because firm will find it unprofitable to produce an extra unit. So, it starts reducing the level of output till MR= MC.
8.
The conditions must hold if a profit-maximizing firm produces positive output in a competitive market when price is constant under MR/MC approach is determined where,
(i) MR = MC (ii) MC must be rising
| Output (Units) | Marginal Revenue Rs | Marginal Cost Rs |
| 1 | 8 | 10 |
| 2 | 8 | 8 |
| 3 | 8 | 7 |
| 4 | 8 | 8 |
| 5 | 8 | 9 |
According to Table, both the conditions of equilibrium are satisfied at 4 units of output. MC is equal to MR and MC is rising. MC is more than MR when output is produced after 4 units of output. So, Producer's Equilibrium will be achieved at 4 units of output. However, MR is equal to MC at 2 units of output also. But, second condition is not fulfilled here.
Let us understand the determination of equilibrium with the help of a diagram:
Producer's Equilibrium is determined at OQ level of output corresponding to point E as at this point, MC= MR and MC curve cuts MR curve from below.
In Figure, output is shown on the horizontal axis and revenue and costs on the vertical axis. Producer's equilibrium will be determined at OQ level of output corresponding to point E because at this, the following two conditions are met:
(i) MC = MR;
(ii) MC curve cuts the MR curve from below.
When MR > MC, then producer will continue to produce as long as MR becomes equal to MC. It is so because firm will find it profitable to raise the output level.
When MR< MC, then producer will cut down the production as long as MR becomes equal to MC. It is so because firm will find it unprofitable to produce an extra unit. So, it starts reducing the level of output till MR= MC.
9.
The conditions must hold if a profit-maximizing firm produces positive output in a competitive market when price is constant under MR/MC approach is determined where,
(i) MR = MC (ii) MC must be rising
| Output (Units) | Marginal Revenue Rs | Marginal Cost Rs |
|---|---|---|
| 1 | 8 | 10 |
| 2 | 8 | 8 |
| 3 | 8 | 7 |
| 4 | 8 | 8 |
| 5 | 8 | 9 |
According to Table, both the conditions of equilibrium are satisfied at 4 units of output. MC is equal to MR and MC is rising. MC is more than MR when output is produced after 4 units of output. So, Producer's Equilibrium will be achieved at 4 units of output. However, MR is equal to MC at 2 units of output also. But, second condition is not fulfilled here.
Let us understand the determination of equilibrium with the help of a diagram:
Producer's Equilibrium is determined at OQ level of output corresponding to point E as at this point, MC= MR and MC curve cuts MR curve from below.
In Figure, output is shown on the horizontal axis and revenue and costs on the vertical axis. Producer's equilibrium will be determined at OQ level of output corresponding to point E because at this, the following two conditions are met:
(i) MC = MR;
(ii) MC curve cuts the MR curve from below.
When MR > MC, then producer will continue to produce as long as MR becomes equal to MC. It is so because firm will find it profitable to raise the output level.
When MR< MC, then producer will cut down the production as long as MR becomes equal to MC. It is so because firm will find it unprofitable to produce an extra unit. So, it starts reducing the level of output till MR= MC.
10.
The conditions must hold if a profit-maximizing firm produces positive output in a competitive market when price is constant under MR/MC approach is determined where,(i) MR = MC (ii) MC must be rising
| Output (Units) | Marginal Revenue Rs | Marginal Cost Rs |
| 1 | 8 | 10 |
| 2 | 8 | 8 |
| 3 | 8 | 7 |
| 4 | 8 | 8 |
| 5 | 8 | 9 |
According to Table, both the conditions of equilibrium are satisfied at 4 units of output. MC is equal to MR and MC is rising. MC is more than MR when output is produced after 4 units of output. So, Producer's Equilibrium will be achieved at 4 units of output. However, MR is equal to MC at 2 units of output also. But, second condition is not fulfilled here.
Let us understand the determination of equilibrium with the help of a diagram:
Producer's Equilibrium is determined at OQ level of output corresponding to point E as at this point, MC= MR and MC curve cuts MR curve from below.
In Figure, output is shown on the horizontal axis and revenue and costs on the vertical axis. Producer's equilibrium will be determined at OQ level of output corresponding to point E because at this, the following two conditions are met:
(i) MC = MR;
(ii) MC curve cuts the MR curve from below.
When MR > MC, then producer will continue to produce as long as MR becomes equal to MC. It is so because firm will find it profitable to raise the output level.
When MR< MC, then producer will cut down the production as long as MR becomes equal to MC. It is so because firm will find it unprofitable to produce an extra unit. So, it starts reducing the level of output till MR= MC.

11th Standard CBSE Syllabus & Materials
11th Standard CBSE
CBSE 11th Business Studies Forms of Business Organisation Sample Question Papers Study Material - QB365 Set A
NEW11th Standard CBSE
CBSE 11th Business Studies Business, Trade and Commerce Sample Question Papers Study Material - QB365 Set A
NEW11th Standard CBSE
CBSE 11th Physics Waves Sample Question Papers Study Material - QB365 Set A
NEW11th Standard CBSE
CBSE 11th Physics Kinetic Theory Sample Question Papers Study Material - QB365 Set A



CBSE 11th Standard CBSE Subjects
CBSE Standards










