
 100% FREE ACCESS
11th Standard CBSE Syllabus & Materials
11th Standard CBSE
CBSE 11th Economics PART-A - Presentation of Data - New Sample Question Papers Study Material - QB365 Set A
NEW11th Standard CBSE
CBSE 11th Economics PART-A - Organisation of Data - New Sample Question Papers Study Material - QB365 Set A
NEW11th Standard CBSE
CBSE 11th Economics PART-A - Collection of Data - New Sample Question Papers Study Material - QB365 Set A
NEW11th Standard CBSE
CBSE 11th Economics PART-A - Introduction to Economics and Statistics - New Sample Question Papers Study Material - QB365 Set A
NEW11th Standard CBSE
CBSE 11th Business Studies International Trade Sample Question Papers Study Material - QB365 Set A
NEW11th Standard CBSE
CBSE 11th Business Studies Evolution and Fundamentals of Business Sample Question Papers Study Material - QB365 Set A

Published on: 05/03/2020
11th Standard CBSE Economics Public Exam Important Question 2019-2020
Download CBSE Class 11th Standard CBSE undefined question papers, sample papers, important questions, and previous year solved papers in PDF format. Get free study materials, NCERT solutions, and exam preparation resources for Class 11th Standard CBSE undefined
Questions + Answers key
Take MCQ Biology Test
1.
Market Jop a good is in equilibrium. Supply of the good 'increases'. Explain the chain of effects of this change.
2.
Which values are of utmost importance in making of a project?
3.
Why do we need an index number?
4.
Define Median. Discuss its merits and demerits.
5.
Give formula for:
(a) Simple mean in individual series by shortcut method
(b) Weighted mean
(v) Simple mean in continuous series by direct method
(d) Simple mean in discrete series by shortcut method
(e) Combined Mean
(f) Simple mean in continuous series by step deviation method
6.
Explain different types of correlation.
7.
What are the properties of standard deviation Use illustrations to explain any one.
8.
From the data given below, find:
(a) Range of the marks obtained by students;
(b) Divide the data into appropriate number of class interval to determine class interval using the formula 2k \(\ge\) N. and obtain the distribution of marks.
| 31 | 23 | 19 | 29 | 22 | 20 | 16 | 10 | 13 | 34 | 18 | 29 |
| 24 | 19 | 16 | 11 | 22 | 15 | 17 | 10 | 38 | 33 | 28 | 21 |
| 15 | 18 | 36 | 24 | 18 | 15 | 12 | 30 | 27 | 23 | 20 | 17 |
| 14 | 32 | 26 | 25 |
9.
What is an ogive? How is it constructed?
10.
What are the essentials of a good statistical table? Using an imaginary example, indicate different parts of a table.
11.
Discuss the merits and limitation of diagrams.
12.
Compare between perfect competition and monopolistic competition.
13.
What is secondary data? Explain different sources of secondary data.
14.
Explain the producer's equilibrium with MR/MC approach (when Price remains constant with the rise in output).
15.
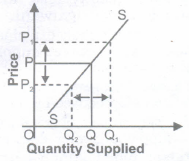
Distinguish between change in quantity supplied and change in supply. Use diagram.
16.
Explain various functions of statistics.
17.
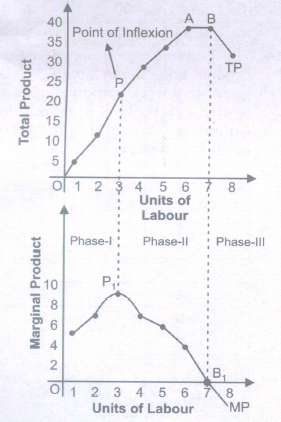
Explain the likely behaviour of Total Product and Marginal Product when for increasing production only one input is increased while all other inputs are kept constant.
18.
Any transaction which involves money is associated with Economics. Defend or refute. Justify your answer.
19.
Calculate TC and AVC of a firm at each given level of output from its cost schedule.
| Output | 1 | 2 | 3 | 4 | 5 | 6 |
|---|---|---|---|---|---|---|
| AFC | 60 | 30 | 20 | 15 | 12 | 10 |
| MC(Rs.) | 32 | 30 | 28 | 30 | 35 | 43 |
20.
Explain the features of free entry and exit of firms.
21.
From the schedule provided below calculate the total revenue, demand curve and the price elasticity of demand:
| Quantity | 1 | 2 | 3 | 4 | 5 | 6 | 7 | 8 | 9 |
| Marginal Revenue | 10 | 6 | 2 | 2 | 2 | 0 | 0 | 0 | -5 |
22.
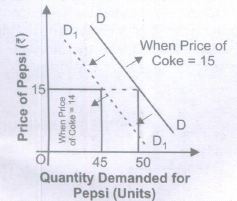
Explain with the help of diagrams, the effect of the following changes on the demand of a commodity:
(i) A fall in price of Substitute good.
(ii) A fall in price of Complementary good.
23.
Show diagrammatically the conditions for consumer's equilibrium, in Hicksian analysis of demand
24.
Discuss the central problems of an economy
25.
Which of the following is a tool for presentation of data?
Bar Diagram
Pie Chart
Time Series Graph
All of the above.
26.
The best average for constructing an index numbers is:
Harmonic mean
Arithmetic mean
Geometric mean
None of these
27.
In a distribution, the value around which the items tend to be most heavily concentrated is called:
Third quartile
Mean
Mode
Median
28.
The value exactly at the middle of a class-interval is called:
Class mark
Mid-value
Both (a) and (b)
None of these
29.
Other name of Simple Mean is
Relative average
Weighted average
Unweighted average
None of these
30.
The correlation between number of shoe a person uses and day temperature is:
Positive
Zero
Negative
None of these
31.
If all the observations of a series are multiplied by 5 then
S.D. of a series would be decreased by 5
S.D. of a series would be half of the previous S.D.
S.D. of a series would be increased by 5
S.D. of a series would be also multiplied by5.
32.
For tabulation, 'caption' is:
The lower part of the table.
The upper part of the table
The upper part of a table that describes the column and sub-column
The main part of the table
33.
Data represented through a histogram can help in finding graphically the:
Mean
Median
Mode
All of the above
34.
Suppose the technology for producing personal computers improves and, at the same time, individuals discover new uses for personal computers so that there is greater utilisation of personal computers. Which of the following statements /factors will happen to equilibrium price and equilibrium quantity?
Price will increase ; quantity cannot be determined.
Price will decrease; quantity cannot be determined.
Quantity will increase; price cannot be determined
Quantity will decrease; price cannot be determined.
35.
The most attractive method of data presentation is:
Tabular
diagrammatic
Textual
either (a) or (c)
36.
What is the relation between price and marginal cost at equilibrium, when price falls with the rise in output.
Price = Marginal Cost
Price> Marginal Cost
Price < Marginal cost
None of these
37.
Which one of the following statement is not a characteristic of monopolistic competition?
Ease of entry into the industry.
Product differentiation.
A relatively large number of sellers.
A homogenous product.
38.
Distrust of Statistics is due to:
Misuse of Statistics
Insufficient Statistical Methods
Lack of Scope of Statistics
Limitations of Statistics
39.
What is the root cause of all economic problems?
Scarcity
Excess Demand
Excess Supply
Deficient Demand
40.
Primary data is preferred over secondary data where:
Sufficient finance is not available
Much accuracy is not required
Accuracy is important
Time available is short
41.
The term 'market'refers to a______________.
place where buyer and seller bargain a product or service for a price
place where buyer does not bargain
place where seller does not bargain
None of these
42.
The quantity supplied of a piece of goods or service is the amount that
is actually bought during a given time period at a given price
producers wish that they could sell that at a higher price
producers plan to sell during a given time period at a given price.
people are willing to buy during a given time period at a given price
43.
AR can be symbolically written as:
MR/Q
Price x quantity
TR/Q
None of these.
44.
A firm's average fixed cost is Rs. 20 at 6 units of output. What will it be at 4 units of output?
Rs. 60
Rs. 30
Rs. 40
Rs. 20
45.
To economists, the main difference between short run and long run is that:
In short run all inputs are fixed, while in long run all inputs are variable.
In short run the firm varies all of its inputs to find the least cost combination of inputs.
In short run, at least one of the firm's input level is fixed.
In long run, the firm is making a constrained decision about how to use existing plant and equipment efficiently.
46.
If regardless of changes in its price, the quantity demanded of a good remains unchanged, then the demand curve for the good will be:
horizontal.
vertical.
positively sloped.
negatively sloped
47.
Identify the factor which generally keeps the price elasticity of demand for a good low
Variety of uses for that good
Its low price
Close substitutes for that good
High proportion of the consumer's income spent on it
48.
Total utility is maximum when
Marginal utility is zero
Marginal utility is at its highest point
Marginal utility is equal to average utility
Average utility is maximum
49.
Which one of the following bundles of goods cannot be produced with the resources the economy currently has?
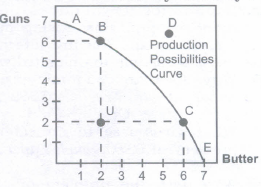
A
B
C
D
50.
Explain three factors that lead to an economic problem
51.
What do you mean by a statistical project?
52.
What factors are considered while selecting price quotations?
53.
Using following data, find median graphically.
| X | 100-120 | 120-140 | 140-160 | 160-180 | 180-200 |
| F | 10 | 20 | 30 | 15 | 5 |
54.
What is classification of data? What should be its characteristics?
55.
"Demand and supply are like two blades of a pair of scissors". Comment.
56.
What are the merits and limitations of Spearman's rank correlation?
57.
The student body of a certain school was polled to find out what their hobbies were. The number of hobbies each student had was then recorded and the data obtained was grouped into classes shown in the table below. Assuming mean to be 17, find the mean number of hobbies of the students in the school.
| Number of hobbies | Frequency |
| 0-4 | 45 |
| 5-9 | 58 |
| 10-14 | 27 |
| 15-19 | 30 |
| 20-24 | 19 |
| 25-29 | 11 |
| 30-34 | 8 |
| 35-40 | 2 |
58.
How are quartile deviation, standard deviation and mean deviation related to each other?
59.
What are the essentials of a good statistical table?
60.
A report on sugar mill reported that sugar production during the first fortnight in December 2010 was about 3, 87,000 tones as against 3, 40,000 during the same fortnight last year. The Off-take of sugar from factories during the first fortnight of December, 2001 was 2, 83,000 tonnes for internal consumption and 41,000 for exports as against 1, 54,000 tonnes for internal consumption and 24,000 tonnes for exports last year.
Tabulate the data.
61.
What is meant by price rigidity, under oligopoly.
62.
What is the relation between Price and MC at equilibrium (when price falls with the rise in output)?
63.
The measure of price elasticity of demand of a normal good carries minus sign while price elasticity of supply carries plus sign. Explain why?
64.
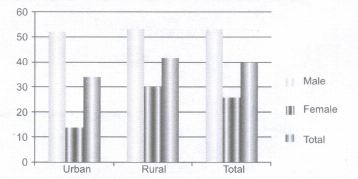
From the data given below, draw a multiple bar diagram.
| Sex | Urban | Rural | Total |
| Male | 51.8 | 53.1 | 52.7 |
| Female | 13.9 | 29.9 | 25.4 |
| Total | 33.7 | 41.7 | 39.5 |
65.
"There are three lies-lie, damn lie and statistics". Explain
66.
If you want to know average percentage of class XII students of your school, which method will you use-census or sample? Justify your choice.
67.
Problem of choice is unavoidable in the ordinary business of life. How?
68.
A consumer consumes only two goods X and Y. At a certain consumption level of these goods, he finds that the ratio of marginal utility to price in case of X is lower than that in case of Y. Explain the reaction of the consumer
69.
What is the relation between market price and average revenue of a price taking firm (i.e. perfectly competitive firm)?
70.
Whatwouldbetheshapeofthe demand curve so that the total revenue curve is
(a) A positively sloped straight line passing through the origin?
(b) A horizontal line?
71.
A producer starts a business by investing his own savings and hiring the labour. Identify implicit and explicit costs from this information. Explain.
72.
Complete the following table:
| Units of Labour | (Q) Average Product (Units) | Marginal Product (Units) |
| 1 | 8 | - |
| 2 | 10 | - |
| 3 | - | 10 |
| 4 | 9 | - |
| 5 | - | 4 |
| 6 | 7 | - |
73.
Does a rise in price of other goods have the same effect on demand for a commodity?
74.
Consider the demand curve D(P) = 10 - 3p. What is the elasticity at price 5/3?
1.
As given in the examination problem that market for a good is in equilibrium. So, we assume that initial price is OP as shown in given figure:
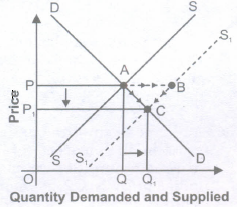
In the given figure price is on vertical axis and quantity demanded and supplied is on horizontal axis. But due to increase in supply the supply curve shifts rightward from SS to S1S1, With new supply curve S1S1 there is excess supply at initial price OP because at price OP, supply is PB and demand is PA, so there is excess supply of AB at price OP. Due to this excess supply competition among the producer will make the price fall. Due to this fall in price there is downward movement along the supply curve (Contraction in supply) from B to C and similarly, there is downward movement along the demand curve (Expansion in demand) from A to C. So, finally, equilibrium price falls from OP to OP1 and equilibrium quantity rises from OQ to OQ1
Conclusion
Due to increase in supply,
(i) Equilibrium price falls from OP to OP1
(ii) Equilibrium quantity rises from OQ to OQ1
2.
(a) Originality: Project must not be copied but an original work of investigator.
(b) Sample Selection: Sample must be randomly selected. There must not be any bias in selection of the sample else the entire motto of preparing project will defeat.
(c) Decision Making: Many decisions are required to be taken in making of a project. Therefore, decision making is another important value.
(d) Communication Skills: In order to get information from people, one needs to be tactful. It calls for good communication skills.
3.
We need an index number because:
Index numbers are indispensable tools of economics and business analysis.
Following are the main uses of index numbers.
1. Index numbers are used as economic barometers: Index number is a special type of averages which helps to measure the economic fluctuations on price level, money market, economic cycle like inflation, deflation etc.
2. They are useful in forecasting future economic activity: Index numbers are used not only in studying the past and present workings of our economy but also important in forecasting future economic activity. Index numbers measure the purchasing power of money. Index of Exports and Imports provides relevant information regarding foreign trade and accordingly government can formulate its export-import policy, business men who are engaged in foreign trade can take their decisions and one can predict changes in inflow or outflow of foreign exchange.
3. The cost of living index numbers determine whether the real wages are rising or falling or remain constant: The real wages can be obtained by dividing the money wages by the corresponding price index and multiplied by 100. Real wages helps us in determining the purchasing power of money. Index numbers are used in deflating. Index numbers are highly useful in deflating i.e. they are used to adjust the wages for cost of living changes and thus transform nominal wages into real wages, nominal income to real income, nominal sales to real sales etc. through appropriate index numbers.
4. Used in Deflating: Deflating means correcting or adjusting a value which has inflated. It makes allowances for the effect of price changes. When prices rise, the purchasing power of money declines. If the money incomes of people remain constant between two periods and prices of commodities are doubled the purchasing power of money is reduced to half. For example if there is an increase in the price of rice from Rs.10/ kg in the year 1980to Rs.20/kg in the year 1982. then a person can buy only half kilo of rice with no. so the purchasing power of a rupee is only 50paise in 1982 as compared to 1980.
Thus the purchasing power of money \(=\frac { 1 }{ Price\quad Index } \) In times of rising prices the money wages should be deflated by the price index to get the figure of real wages. The real wages alone tells whether a wage earner is in better position or in worst position.
For calculating real wage, the money wages or income is divided by the corresponding price index and multiplied by 100.
Money wages i.e. Real wages = \(\\ \frac { Money\quad wages }{ Priceindex } \times 100\)
Thus Real Wage Index \(=\frac { Realwagescurrentyear }{ Realwagesofbaseyear } \times 100\)
5. Index numbers helps in formulating suitable economic policies and planning: Many of the economic and business policies are guided by index numbers. For example while deciding the increase of DA of the employees; the employer's have to depend primarily on the cost of living index. If salaries or wages are not increased according to the cost of living it leads to strikes, lock outs etc. The index numbers provide some guide lines that one can use in making decisions.
6. They are used in studying trends and tendencies: Since index numbers are most widely used for measuring changes over a period of time, the time series so formed enable us to study the general trend of the phenomenon under study. For example for last 8 to 10 years we can say that imports are showing upward tendency. Businessmen need to know the trends in the market to take decisions about wage rates, prices of the product, prices of raw materials etc. Therefore, index numbers are very useful for them.
4.
According to Connor, "The median is that value of the variable which divides the group into two equal parts, one part comprising all parts greater, and the other values less than median."
According to Horace Secrist, "Median of a series is the value of the item actual or estimated when a series is arranged in order of magnitude which divides the
distribution into two parts."
According to Croxton and Cowden, ''the median is generally defined as the value which divides the distribution so that an equal number of items is on either side of it."
Merits:
(a) The median is useful in case of frequency distribution with open-end classes.
(b) The median is recommended if distribution has unequal classes.
(c) Extreme values do not affect the median as strongly as they affect the mean.
(d) It is the most appropriate average in dealing with qualitative data.
(e) The value of median can be determined graphically where as the value of mean cannot be determined graphically.
(f) It is easy to calculate and understand.
Demerits:
(a) For calculating median it is necessary to arrange the data, where as other averages do not need arrangement.
(b) Since it is a positional average its value is not determined by all the observations in the series.
(c) Median is not capable for further algebraic calculations.
(d) The sampling stability of the median is less as compared to mean.
5.
(a) \(\quad \overline { x } =\frac { 1 }{ n } A+\frac { \sum { d } }{ N } \)
(b) Weighted Mean =\(\sum WX/\sum W\)
(c) \(\overline { x } =\frac { \sum _{ i=1 }^{ n }{ { f }_{ i }{ m }_{ i } } }{ \sum _{ i=1 }^{ n }{ { f }_{ i } } } \)
(d) \(\overline { x } =\frac { \sum _{ i=1 }^{ n }{ { f }_{ i }{ d }_{ i } } }{ \sum _{ i=1 }^{ n }{ { f }_{ i } } } \)
(e) Combined Mean \(\overline x\)12=\(\frac { { \overline { x } }_{ 1 }{ N }_{ 1 }+{ \overline { x } }_{ 2 }{ N }_{ 2 } }{ { N }_{ 1 }+{ N }_{ 2 } } \)
(f) \(\overline { x } =A+\frac { \sum { d' } }{ N } \times i\)
6.
Through the coefficientof correlation, we can measure the degree or extent of the correlation between two variables. On the basis of the coefficient of correlation we can also determine whether the correlation is positive or negative and also its degree or extent.
Perfect correlation: If two variables changes in the same direction and in the same proportion, the correlation between the two is perfect positive. According to Karl Pearson the coefficient of correlation in this case is +1. On the other hand if the variables change in the opposite direction and in the same proportion, the correlation is perfect . negative. its coefficient of correlation is -1. In practice we rarely come across these types of correlations.
Absence of correlation: If two series of two variables exhibit no relations between them or change in variable does not lead to a change in the other variable, then we can firmly say that there is no correlation or absurd correlation between the two variables. In such a case the coefficient of correlation is O.
Limited degrees of correlation: If two variables are not perfectly correlated or is there a perfect absence of correlation, then we term the correlation as Limited correlation. It may be positive, negative or zero but lies with the limits ± l. High degree, moderate degree or low degree are the three categories of this kind of correlation. The following table reveals the effect ( or degree) of coefficient or correlation.
7.
Property 1
If a constant c is added to each value of a population function, then the new variance is the same as that of the old variance. The new standard deviation is also the same as that of the old standard deviation.
Old data items: 2, 1, 4, 5
\(\overline { x } =\frac { 2+1+4+5 }{ 4 } =\frac { 12 }{ 4 } \)=3
\({ \delta }^{ 2 }=\frac { 1+4+1+4 }{ 4 } =\frac { 10 }{ 4 } \)=2.5
\(\delta =\sqrt { 2.5 } \)
New data items: 6, 3, 12, 15
New mean\(=\overline { x } \frac { 6+3+12+15 }{ 4 } =\frac { 36 }{ 4 } \)=9
New variance =\({ \delta }^{ 2 }\)
\(=\frac { \left( 6-9 \right) ^{ 2 }+\left( 3-9 \right) ^{ 2 }+\left( 12-9 \right) ^{ 2 }+\left( 15-19 \right) ^{ 2 } }{ 4 } \)
\(=\frac { \left( -3 \right) ^{ 2 }+\left( -6 \right) ^{ 2 }+\left( 3 \right) ^{ 2 }+\left( 6 \right) ^{ 2 } }{ 4 } \)
\(=\frac { 9+36+9+36 }{ 4 } =\frac { 90 }{ 4 } \)
\(\delta =\sqrt { 225 } \)
The new mean
=\(\overline { x } \)=9=3x3=\(\overline { x } \)x3
The new variance
= 22.5 = 9 x 2.5 = 32x 2.5
= 32 x the old variance.
The new standard deviation
\(=\sqrt { 22.5 } =\sqrt { 9\times 2.5 } =\sqrt { { 3 }^{ 2 }\times 2.5 } \)
\(=|3|\sqrt { 2.5 } \)
=\(|3|\)x the old st. deviation
Property 2 Standard deviation is affected by change of origin.
If all the observations in the series are multiplied or divided by same number then S.D. also gets multiplied or divided by this constant.
Property 3
Given the standard deviation of two series, we can find combined standard deviation. Like combined mean, the combined variance or standard deviation can be calculated for different sets of data. Suppose we have two sets of data containing n1 and n2 observations with means \(\overline { X } \)1 and \(\overline { X } \)2, and variances s12 and s22 If \(\overline { X } \)c is the combined mean and sc2 the combined variance of observations, then combined variance is given by
\({ S }_{ c }^{ 2 }=\frac { { n }_{ 1 }{ S }_{ 1 }^{ 2 }+{ n }_{ 2 }{ S }_{ 2 }^{ 2 }+{ n }_{ 1 }(\overline { { X }_{ 1 } } -\overline { { X }_{ c } } )^{ 2 }+{ n }_{ 2 }(\overline { { X }_{ 2 } } -\overline { { X }_{ c } } )^{ 2 } }{ { n }_{ 1 }+{ n }_{ 2 } } \)
It can be written as
\({ S }_{ c }^{ 2 }=\frac { { n }_{ 1 }\left[ { S }_{ 1 }^{ 2 }+(\overline { { X }_{ 1 } } -\overline { { X }_{ c } } )^{ 2 } \right] +{ n }_{ 2 }\left[ { S }_{ 2 }^{ 2 }+(\overline { { X }_{ 2 } } -\overline { { X }_{ c } } )^{ 2 } \right] }{ { n }_{ 1 }+{ n }_{ 2 } } \)
Where \(X_{ c }^{ 2 }=\frac { { n }_{ 1 }\overline { { X }_{ 1 } } +{ n }_{ 2 }\overline { { X }_{ 2 } } }{ { n }_{ 1 }+{ n }_{ 2 } } \)
The combine standard deviation \({ S }_{ c }^{ 2 }\) can be calculated by taking the square root of \({ S }_{ c }^{ 2 }\) .
8.
Range is equal to Largest - Smallest Value
38 -10 = 28
Here, N = 40 observations. If we apply this rule, then we shall have
23 = 8 (<40),
24 = 16 (<40),
25 = 32 (<40).
26 = 64 (>40).
28/6 = 4.66
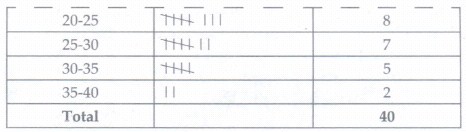
Rounded off to 5 and therefore, class interval is 5.
If we use range, then minimum classes should be five and accordingly, also we are taking six classes.

9.
A frequency distribution gives the number of observations that lie in any class interval whereas the cumulative frequency distribution gives the number of frequencies that lie below any mark or above any given mark. When derived from a frequency distribution, the cumulative frequency distribution of one kind gives the number of observations less than the lower boundaries of the successive class and the cumulative frequency distribution of the second kind gives the number of observations that exceed the lower boundaries of the class which are respectively known as the less than and greater than the cumulative frequency distribution.
If we draw frequency polygon to the above two distribution we get cumulative frequency polygon (less than & greater than). If we draw a frequency curve to the above two distribution in the same graph, we get cumulative frequency curve or Ogive.
Steps Involved:
(a) Find the cumulative frequencies of the given frequencies by "less than method' or 'more than method' as you need.
(b) Less than type cumulative frequencies will give less than type ogive and more type cumulative frequencies will give less than type ogive.
(c) Variable under study is taken on X-axis.
(d) Cumulative Frequencies are taken on Y-axis.
(e) Both the axis should be clearly labelled' and scale of measurement should be clearly shown.
(f) Various points are plotted on graph.
(g) By joining these points we get ogive or cumulative frequency curve.
10.
The preparation of a good table is an art. The purpose of tabulation must always be kept in mind before the preparation of a statistical table. A good statistical table must contain at least the following components.
In general, a statistical table consists of the following eight parts. They are as follows:
1. Table Number: Each table must be given a number. Table number helps in distinguishing one table from other tables. Usually tables are numbered according to the order of their appearance in a chapter. For example, the first table in the first chapter of a book should be given number 1.1and second table of the same chapter be given 1.2 Table number should be given at its top or towards the left of the table.
2. Title of the Table: Every table should have a suitable title. It should be short & clear. Title should be such that one can know the nature of the data contained in the table as well as where and when such data were collected. It is either placed just below the table number or at its right.
3. Caption: Caption refers to the headings of the columns. It consists of one or more column heads. A caption should be brief, concise and self-explanatory, Column heading is written in the middle of a column in small letters.
4. Stub: Stub refers to the headings of rows.
5. Body: This is the most important part of a table. It contains a number of cells. Cells are formed due to the intersection of rows and column. Data are entered in these cells.
6. Head Note: The head-note (or prefactory note) contains the unit of measurement of data. It is usually placed just below the title or at the right hand top corner of the table.
7. Foot Note: A footnote is given at the bottom of a table. It helps in clarifying the point which is not clear in the table. A footnote may be keyed to the title or to any column or to any row heading. It is identified by symbols such as *,+,@,£ etc.
8. Source Note: The source note shows the source of the data presented in the table. Reliability and accuracy of data can be tested to some extent from the source note. It shows the name of the author, title, volume, page, publisher's name, year and place of publication of the book or journal from which data are complied.
--- THE TITLE ----
---- Prefatory Notes ----
| ----Box Head---- | |
| ---- Row Captions ---- | ---- Column Captions ---- |
| ---- Stub Entries ---- | ---- The Body ---- |
Foot Notes
Source Note Solution
11.
Merits:
(a) Attractive and Impressive: Diagrams are attractive and impressive.
(b) Simple and easily understandable: Diagrams are easy and simple to understand. Knowledge of mathematics is not required to understand diagrams.
(c) Useful in Comparison: Diagrams prove very useful in comparing data from one year to another or otherwise.
(d) Helps in forecasting: It helps us to predict future values on the basis of past statistics.
(e) Save time effort and energy: By simplifying data, diagrams save time, energy and effort.
(f) Diagrams are useful in all fields: From sports to education to medical and engineering, in all fields we make use of diagrams. They are specifically useful for policy formulation and decision making.
Limitations: Diagrams are a very useful tool in presentation of data but they cannot be a substitute for classification or tabulation. It is not free from limitations.
(a) Diagrams do not present the small differences properly.
(b) These can easily be misused.
(c) Only artist can draw multi-dimensional diagrams.
(d) In statistical analysis, diagrams are of no use.
(e) Diagrams are just supplement to tabulation.
(f) Only a limited set of data can be presented in the form of diagram.
(g) Diagrammatic presentation of data is a more time-consuming process.
(h) Diagrams present preliminary conclusions,
12.
| Perfect Competition | Basis | Monopolistic Competition |
|---|---|---|
| It refers to a market situation where there are very large number of buyers and sellers dealing in a homogeneous product at a price fixed by the market. |
Meaning | It refers to a market situation in which there are large number of firms selling closely related but differentiated products. |
| The products sold are homogeneous. So, buyers are willing to pay same price for all products, which leads to uniform price in the market. | Nature of Product | Products are differentiated on the basis of brand, size, colour, shape etc. So, a firm is in a position to influence the price. |
| Demand curve is perfectly elastic as price remains the same at all levels of output. | Demand Curve | Demand curve slopes downwards as more output can be sold only at less price. |
| Firm is a price-taker as price is determined by the industry. | Price | Firm is neither a price-taker nor a price-maker but has partial control over price due to product differentiation. |
| Buyers and sellers have perfect knowledge about market conditions. | Level of Knowledge | Sellers and buyers do not have perfect knowledge due to product differentiation and selling costs incurred by the sellers. |
| No selling costs are incurred as buyers and sellers have perfect knowledge about market conditions. | Selling Cost | Heavy selling costs are incurred on sales promotion due to lack of perfect knowledge among buyers and sellers. |
13.
When investigator uses the data which is used by someone else, it is called secondary data. Sources fo secondary data are as follows:
Published Printed Sources: There are a variety of published printed sources. Their credibility depends on many factors. For example, on the writer, publishing company and time and date when published. New sources are preferred and old sources should be avoided as new technology and researches bring new facts into light.
1. Books: Books are available today on any topic that you want to research. The use of books start before even you have selected the topic. After selection of topics books provide insight on how much work has already been done on the same topic and you can prepare your literature review. Books are secondary source but most authentic one in secondary sources.
2. Journals/periodicals: Journals and periodicals are becoming more important as far as data collection is concerned. The reason is that journals provide up-to-date information which at times books cannot and secondly, journals can give information on the very specific topic on which you are researching rather talking about more general topics.
3. Magazines/Newspapers: Magazines are also effective but not very reliable. Newspaper on the other hand are more reliable and in some cases the information can only be obtained from newspapers as in the case of some political studies.
Published Electronic Sources: As internet is becoming more advance, fast and reachable to the masses; it has been seen that much information that is not available in printed form is available on internet. In the past the credibility of internet was questionable but today it is not. The reason is that in the past journals and books were seldom published on internet but today almost every journal and book is available online. Some are free and for others you have to pay the price.
4. E-journals: e-journals are more commonly available than printed journals. Latest journals are difficult to retrieve without subscription but if your university has an e-library you can view any journal, print it and those that are not available you can make an order for them.
5. General Websites: Generally websites do not contain very reliable information so their content should be checked for the reliability before quoting from them.
6. Weblogs: Weblogs are also becoming common. They are actually diaries written by different people. These diaries are as reliable to use as personal written diaries.
Unpublished Personal Records: Some unpublished data may also be useful in some cases.
Diaries: Diaries are personal records and are rarely available but if you are conducting a descriptive research then they might be very useful. The Anne Franks diary is the most famous example of this. That diary contained the most accurate records of Nazi wars.
Letters: Letters like diaries are also a rich source but should be checked for their reliability before using them.
Government Records: There are two major government agencies which provide data. These are CSO and NSSO.
Central Statistical Office (CSO) It is responsible for coordination of statistical activities in the country and for evolving and maintaining statistical standards. Its activities include compilation of National Accounts; conduct of Annual Survey of Industries and Economic Censuses, compilation of Index of Industrial Production, as well as Consumer Price Indices. It also deals with various social statistics, training, international cooperation, Industrial Classification etc. The CSO is headed by a Director-General who is assisted by 5 Additional Director-Generals looking after the National Accounts Division, Social Statistics Division. Economic Statistics Division, Training Division and the Coordination and Publication Division. CSO is located in the Sardar Patel Bhawan, Parliament Street, New Delhi. The Industrial Statistics Wing of CSO is located in Kolkata. The Computer Centre also under the CSO is located in R K Puram, New Delhi.
National Sample Survey Office (NSSO) It has four divisions
(i) Survey Design and Research Division (SDRD) - Kolkata
(ii) Field Operations Division (FOD) - New Delhi - Data Processing Division (DPD) - Kolkata
(iii) Co-ordination and Publication Division (CPD) - New Delhi The surveys on Consumer Expenditure, Employment - Unemployment, Social Consumption (Health, Education etc.), Manufacturing Enterprises, Service Sector Enterprises are carried out once in 5years. And survey of Land and Livestock Holding and Debt and Investment are carried out once in 10 years.
14.
The conditions must hold if a profit-maximizing firm produces positive output in a competitive market when price is constant under MR/MC approach is determined where,
(i) MR = MC (ii) MC must be rising
| Output (Units) | Marginal Revenue Rs | Marginal Cost Rs |
|---|---|---|
| 1 | 8 | 10 |
| 2 | 8 | 8 |
| 3 | 8 | 7 |
| 4 | 8 | 8 |
| 5 | 8 | 9 |
According to Table, both the conditions of equilibrium are satisfied at 4 units of output. MC is equal to MR and MC is rising. MC is more than MR when output is produced after 4 units of output. So, Producer's Equilibrium will be achieved at 4 units of output. However, MR is equal to MC at 2 units of output also. But, second condition is not fulfilled here.
Let us understand the determination of equilibrium with the help of a diagram:
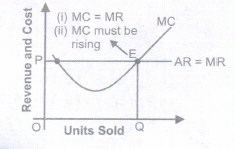
Producer's Equilibrium is determined at OQ level of output corresponding to point E as at this point, MC= MR and MC curve cuts MR curve from below.
In Figure, output is shown on the horizontal axis and revenue and costs on the vertical axis. Producer's equilibrium will be determined at OQ level of output corresponding to point E because at this, the following two conditions are met:
(i) MC = MR;
(ii) MC curve cuts the MR curve from below.
When MR > MC, then producer will continue to produce as long as MR becomes equal to MC. It is so because firm will find it profitable to raise the output level.
When MR< MC, then producer will cut down the production as long as MR becomes equal to MC. It is so because firm will find it unprofitable to produce an extra unit. So, it starts reducing the level of output till MR= MC.
15.
| Changes in quantity supplied | Basis | Change in supply | ||||||||||||||||||||||||
|---|---|---|---|---|---|---|---|---|---|---|---|---|---|---|---|---|---|---|---|---|---|---|---|---|---|---|
| The change in quantity supplied due to the change in price of the commodity. | Meaning | Change in supply due to the change in factors other than price | ||||||||||||||||||||||||
| Movement along the supply curve (i) Expansion in supply (ii) Contraction in supply |
Alternative Name |
Shift in supply curve |
||||||||||||||||||||||||
| (i) It states that rise in quantity supplied due to the rise in price of the commodity (ii) It states that fall in quantity supplied due to the fall in price of the commodity |
Meaning | (i) An increase in supply means that producers now supply more at a given price level (ii) A decrease in supply means that producers now supply less at a given price level |
||||||||||||||||||||||||
|
Schedule |
|
||||||||||||||||||||||||
 |
Diagrams | 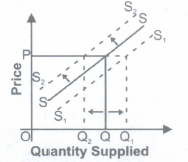 |
||||||||||||||||||||||||
16.
Statistics as a discipline is considered indispensable in almost all spheres of human knowledge. There is hardly any branch of study which does not use statistics. Scientific, social and economic studies use statistics in one form or another. These disciplines make use of observations, facts and figures, enquiries and experiments etc and thereby use statistics and statistical methods. Statistics studies almost all aspects in an enquiry. It mainly aims at simplifying the complexity of information collected in an enquiry. It presents data in a simplified form as to make them intelligible. It analyses data and facilitates derivation of conclusions. Now let us briefly discuss some of the important furictions of statistics.
1. Presents facts in simple form: Statistics presents facts and figures in a definite form. That makes the statement logical and convincing than mere description. It condenses the whole mass of figures into a single figure. This makes the problem intelligible.
2. Reduces the Complexity of data: Statistics simplifies the complexity of data. The raw data are unintelligible. We make them simple and intelligible by using different statistical measures. Some such commonly used measures are graphs, averages, dispersions, skewness, kurtosis, correlation and regression etc. These measures help in interpretation and drawing inferences. Therefore, statistics enables to enlarge the horizon of one's knowledge.
3. Facilitates comparison: Comparison between different sets of observation is an important function of statistics. Comparison is necessary to draw conclusions as Professor Boddington rightly points out." The object of statistics is to enable comparison between past and present results to ascertain the reasons for changes, which have taken place and the effect of such changes in future. So to determine the efficiency of any measure comparison is necessary. Statistical devices like averages, ratios, coefficients etc. are used for the purpose of comparison.
4. Testing hypothesis: Formulating and testing of hypothesis is an important function of statistics. This helps in developing new theories. So statistics examines the truth and helps in innovating new ideas.
5. Formulation of Policies: Statistics helps in formulating plans and policies in different fields. Statistical analysis of data forms the beginning of policy formulations. Hence, statistics is essential for planners, economists, scientists and administrators to prepare different plans and programmes.
6. Forecasting: The future is uncertain. Statistics helps in forecasting the trend and tendencies. Statistical techniques are used for predicting the future values of a variable. For example a producer forecasts his future production on the basis of the present demand conditions and his past experiences. Similarly, the planners can forecast the future population etc. considering the present population trends.
7. Derives valid inferences: Statistical methods mainly aim at deriving inferences from an enquiry. Statistical techniques are often used by scholars planners and scientists to evaluate different projects. These techniques are also used to draw inferences regarding population parameters on the basis of sample information.
17.
According to the Law of Variable Proportion when only one input is increased while all other inputs are kept constant, Marginal Product and Total Product behave in the following manner:
(i) When Marginal product rises (till Point PI), Total product increases at an increasing rate (convex shape) (till point P).
(ii) When Marginal product falls and remains positive (Till point B1), total product increases at a diminishing rate (concave shape) (till point A).
(iii) When Marginal Product is zero (at point B1), Total Product is at its maximum and constant (At point B).
(iv) When Marginal product becomes negative (after point B1), total product falls (after point B).
18.
I refute this statement. Any activity concerned with production, distribution or investment is said to be associated with Economics. Many activities which involve money but are not a part of
Economics are exemplified below:
(i) Donations;
(ii) Prizes;
(iii) Pocket Money;
(iv) Gifts;
(v) Gambling etc.
On the other hand, many activities are a part of Economics but are not involving money. It includes:
(i) Production for self consumption;
(ii) Investment in own business;
(iii) Barter system etc.
19.
| Output | AFC (Given) | TFC = AFC x Output | MC | TVC=\(\sum\)MC | AVC\(\frac{TVC}{Output}\) | TC=TFC+TVC |
|---|---|---|---|---|---|---|
| 1 | 60 | 60 | 32 | 32 | 32 | 92 |
| 2 | 30 | 60 | 30 | 62 | 31 | 122 |
| 3 | 20 | 60 | 28 | 90 | 30 | 150 |
| 4 | 15 | 60 | 30 | 120 | 30 | 180 |
| 5 | 12 | 60 | 35 | 155 | 31 | 215 |
| 6 | 10 | 60 | 43 | 198 | 33 | 258 |
20.
(i) Buyers and sellers are free to enter or leave the market at any time they like. New firms induced by large profits can enter the industry whereas losses make inefficient firms to leave the industry.
(ii) The freedom of entry and exit of firms has an important implication. This ensures that no firm can earn above normal profit in the long run. Each firm earns just the normal profit, i.e., minimum necessary to carry on business.
(iii) Suppose the existing firms are earning above normal profits, i.e. positive economic profits. Attracted by the positive profits, the new firms enter the industry. The industry's output, i.e. market supply, goes up. The prices come down. New firms continue to enter and the prices continue to fall till economic profits are reduced to zero.
(iv) Now suppose the existing firms are incurring losses. The firms start leaving. The industry's output starts falling, prices going up, and all this continues till losses are wiped out. The remaining firms in the industry then once again earn just the normal profits.
(v) Only zero economic profit in the long run is the basic outcome of a perfectly competitive market.
21.
| Q | MR | TR=ΣMR | Demand Curve or Price or \(AR=\frac{TR}{Q}\) | ED |
|---|---|---|---|---|
|
1 |
10 6 2 2 |
10 16 18 20 |
10 8 6 5 |
ED > 1 |
| 5 | 2 | 22 | 4.4 | |
| 6 7 8 |
0 0 0 |
22 22 22 |
3.6 3.2 2.75 |
ED =1 |
| 9 | -5 | 17 | 1.9 | ED < 1 |
Rule: When with the fall in price of goods, total revenue rises, ED > 1, if it remains same ED = 1 and if falls then ED < 1.
22.
(i) fall in price of Substitute good:
A decrease in price of substitute goods (Coke) leads to an decrease in demand of a given commodity (Pepsi). The Demand curve of Pepsi would shifts leftward It can be explained with the help of given diagram:
In the given diagram the demand curve for Pepsi when the price of Coke is Rs.14 lies to the left of that when the price of Coke is Rs.15. Hence, an decrease in the price of a substitute good shifts the demand curve for a product to the left.
(ii) A fall in price of Complimentary good
Decrease in Price of Complimentary Good [Refill] leads to a increase in demand of given commodity [Pen]. The Demand curve for Pen shifts rightwards. It can be explained with the help of diagram:
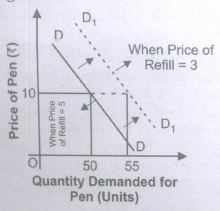
In the above diagram, the demand curve for Pen when Refill price is Rs.3 lies to the right of that when the Refill price is Rs.5.
23.
(i) To define consumer equilibrium, we use Indifference Curve map and the budget line.
Two Conditions Cor Consumer Equilibrium
(a) Necessary Condition
Marginal Rate of Substitution Market Rate of Exchange \(\left[ \frac { { P }_{ x } }{ { P }_{ y } } \right] \)
Or MRS x,y =\(\frac { { P }_{ x } }{ { P }_{ y } } \)
(Market Rate of Exchange) MRE
Or MRS x,y =MRE\(\left[ \frac { { P }_{ x } }{ { P }_{ y } } \right] \)
If MRS x,y>MRE\(\left[ \frac { { P }_{ x } }{ { P }_{ y } } \right] \)
(a) It means that to obtain one more unit of X, the consumer is willing to sacrifice more unit of Y as compared to what is required in the market.
(b) In other words, consumers willingness to pay for commodity X is higher than what market values for commodity X.
(c) This induces the consumer to buy more of X and less of Y, which result in fall in MRS till it become equal to price.
(ii) If MRS x,y< MRE\(\left[ \frac { { P }_{ x } }{ { P }_{ y } } \right] \)
(a) It means that to obtain one more unit of X, the consumer is willing to sacrifice less unit of Y as compared to what is required in the market.
(b) In other words, consumer's willingness to pay for commodity X is lower than what market values for commodity X.
(c) This induces the consumer to buy less of X and more of Y, which result in rise in MRS till it become equal to price.
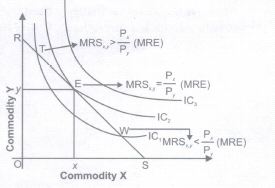
(b) Sufficient Condition MRS Diminishing (Convex) at X, Y a point of equilibrium i.e., when MRS x,y=MRE \(\left[ \frac { { P }_{ x } }{ { P }_{ y } } \right] \)
(ii) The consumer will reach equilibrium when the budget line is tangential to the higher possible Indifference Curve, i.e., where necessary and sufficient conditions satisfy. In the above diagram, the consumer will reach equilibrium at point E where budget line RS is tangential to the highest possible IC2.
(iii) The consumer cannot move to Indifference Curve, i.e., IC3 as this is beyond his money income.
(iv) Even on IC2, all the other points except E are beyond his means.
(v) Hence, at point E, the consumer is in equilibrium where his satisfaction maximizes, given his income and prices of goods X and Y. In equilibrium at E, the slope of Budget line = the slope of Indifference, Therefore, MRS xy is eq to the ratio of the prices of two goods \(\left[ \frac { { P }_{ x } }{ { P }_{ y } } \right] \)
24.
The three central problems of an economyare:
(i) What to produce?
(a) What to produce refers to a problem in which decision regarding which goods and services should be produced is to be taken.
(b) Since its resources are limited, every economy has to decide what commodities are to be produced and in what quantities.
(c) The guiding principle for an economy here is to allocate resources in such a way that gives maximum aggregate utility to the society.
(ii) How to produce?
(a) How to produce refers to a problem in which decision regarding which technique of production should be used is made.
(b) Goods and services can be produced in two ways: by using labour intensive techniques, and by using capital-intensive techniques
(c) The guiding principle for an economy in such a case has to decide about the techniques of production on the basis of cost of production. Those techniques of production should be used which lead to the least possible cost per unit of commodity or service.
(iii) For whom to produce?
(a) For whom to produce refers to a problem in which decision regarding which category of people are going to consume a good, i.e., economically poor or rich.
(b) As we know, goods and services are produced for those who can purchase them or have the capacity to buy them.
(c) Capacity to buy depends upon how income is distributed among the factors of production. The higher the income, the higher will be the capacity to buy and vice versa. So, this is a problem of distribution.
(d) The guiding principle is that the economy must see here that important and urgent wants of its citizens are being satisfied for the maximum possible extent or not.
25.
(d)
All of the above.
26.
(c)
Geometric mean
27.
(c)
Mode
28.
(d)
None of these
29.
(c)
Unweighted average
30.
(b)
Zero
31.
(d)
S.D. of a series would be also multiplied by5.
32.
(c)
The upper part of a table that describes the column and sub-column
33.
(c)
Mode
34.
(c)
Quantity will increase; price cannot be determined
35.
(b)
diagrammatic
36.
(b)
Price> Marginal Cost
37.
(d)
A homogenous product.
38.
(a)
Misuse of Statistics
39.
(a)
Scarcity
40.
(c)
Accuracy is important
41.
(a)
place where buyer and seller bargain a product or service for a price
42.
(c)
producers plan to sell during a given time period at a given price.
43.
(c)
TR/Q
44.
(b)
Rs. 30
45.
(c)
In short run, at least one of the firm's input level is fixed.
46.
(b)
vertical.
47.
(b)
Its low price
48.
(a)
Marginal utility is zero
49.
(d)
D
50.
Economic problem arises because of scarcity of resources in relation to demand for them.
(i) Wants are unlimited:
(a) This is a basic fact of human life. Human wants are unlimited.
(b) They are not only unlimited but also grow and multiply very fast.
(ii) Resources are limited:
(a) The resources to produce goods and services to satisfy human wants are available in limited quantities. Land, labour, capital and entrepreneurship are the basic scarce resources.
(b) These resources are available in limited quantities in every economy, big or small, developed or underdeveloped, rich or poor. Some economies may have more of one or two resources but not all the resources.
(c) For example, Indian economy has relatively more labour but less capital and land. The U.S. economy has relatively more land but less labour. No economy in the world is comfortable in all the resources.
(iii) Resources have alternative uses:
(a) Generally a resource has many alternative uses.
(b) A worker can be employed in a factory, in a school, in a government office, self employed and so on.
(c) Like this, nearly all resources have alternative uses. But the problem is that which resource should be put to which use.
51.
Statistical project is an extremely powerful teaching tool that integrates numerous concepts and skills presented in the classroom. Here are some basic guidelines for developing a statistical project.
A statistical project is the process of answering a research question using statistical techniques and presenting the work in a written report. The research question may arise from any field of scientific endeavor, such as athletics, advertising, aerodynamics, or nutrition. A project differs from a statistical poster in that a written report is used to present the findings.
The process of developing a statistical project should demonstrate the scientific method and pose a focused question or questions, collect appropriate data, analyze the data thoughtfully, and draw correct conclusions.
Because students are asking questions continually about what touches their lives, they should have little trouble generating questions about themselves or their schools, families, neighborhoods, or interesting phenomena in the world. Once a question is proposed, students should examine it. First, is it a question that can be answered? Second, can students collect data to answer the question or has someone else already collected data that could be used to find the answer? Once the question is chosen, data must be collected. If published data are used, students should understand how the data were obtained and record their source. Usually, students choose to collect their own data. Time should be spent deciding how to collect this data. If a survey is used, how are the people chosen to answer the questionnaire? Thoughtful analysis of the data may take many forms and should be guided by the question and how the data were collected. Usually, it is best to begin by graphing the data. Can graphs be used to give the answer to the question or questions? Most of the time, graphics have been the sole method of data analysis for grades 4-6. As students gain experience, simple statistical methods such as a chi-squared test or a t-test may be used. Regression has been used occasionally. Sometimes, estimation is most appropriate and hypothesis testing is not needed. Other methods may be used, depending on the question and data.
Once analysis is complete, the question should be answered. The data may not be able to provide a conclusive answer. Finally, consider the strengths and weaknesses of the project. What would be changed if the project was done again?
52.
(a) Source of prices should be taken from places that represent the entire population.
(b) A choice needs to be made between wholesale prices and retail prices. It will depend on .purpose of index numbers.
(c) If the prices of certain commodities are controlled by the government, then administered prices are taken for index numbers.
(d) The sources from which price quotations are taken must be reliable.
53.
65.6
54.
A classification is an ordered set of related categories used to group data according to its similarities. It consists of codes and descriptors and allows survey responses to be put into meaningful categories in order to produce useful data. To be meaningful, classification should have following characteristics.
(a) It should be unambiguous: Classification aims at removing ambiguity. It is a must that all classes should be defined in such a way that there is no room for doubt and confusion and each item must fit to at least and at most one class.
(b) The classes must not overlap: None of the item should be eligible to be a part of more than one class.
(c) It should be stable: Without stability, classified data will not be fit for comparison.
(d) Classification should be according to purpose of enquiry: For example, if I need to classify my students into two groups for bus arrangement, it will be better to use geographical classification. If the purpose is judging their academic performance the quantitative classification is more suitable. If purpose is judging their value system then qualitative classification is recommended.
(e) It should be mathematically accurate: The test of mathematical accuracy is confirmation of total items in the series with total items in the universe.
(f) It should be flexible: It should be flexible. It should be possible to adjust the series to new situations and circumstances. With change in time some figures may become obsolete and other may become more relevant.
55.
The given statement is correct. Both the blades of a pair of scissors are equally important to cut a piece of cloth. Similarly, both demand and supply are needed for determining price in the market. There is no use for demand for a product if there is no supply for the product and supply is not needed if there is no demand for the product. One of the two may play more active role in price determination in the short run. But, both are needed to determine the price in the long run.
56.
Merits of Rank Correlation
(1) Since in this method \(\sum\) d or the sum of the differences between R1, and R2is always equal to zero, it provides a check on the calculation.
(2) Since Spearman's Rank Correlation is the same thing as Karl Pearson's Coefficient of Correlation between ranks, it can be interpreted in the same way as Karl Pearson's Coefficient of correlation.
(3) Rank correlation unlike Karl Pearson's Coefficient of Correlation does not assume normality in the universe from which the sample has been taken.
(4) Rank Correlation is very easy to understand and apply.' However Pearson's Coefficient is based on a set of full information while Spearman's Coefficient is based only on the ranks. The values of obtained by these two methods would generally differ.
(5) Spearman's Rank method is the only way of studying correlation between qualitative data which cannot be measured in figures but can be arranged. in serial order.
Demerits of Rank Correlation
(1) The method cannot be used in two-way frequency tables or bi-variate frequency distribution.
(2) It can be conveniently used only when n is small say 30, otherwise calculation become tedious.
57.
We have been given the assumed mean a as 17 and we know the formula for finding mean from the assumed mean as
\(\quad \overline { x } =a+\frac { \sum { { f }_{ i }{ u }_{ i } } }{ \sum { { f }_{ i } } } \times h\)
we can find the class interval by using the class limits as follows:
h = Upper class limit - Lower class limit +1 h = 4-0+1=5
We now have one component we need and we're one step closer to finding the mean. So we can solve the rest of this problem using a table where by we find each remaining component of the formula and then substitute at the end:
| Hobbies | Frequency fi | xi | di=xi-a | ui=di/h | fiui |
| 0-4 | 45 | 2 | -15 | -3 | -135 |
| 5-9 | 58 | 7 | -10 | -2 | -116 |
| 10-14 | 27 | 12 | -5 | -1 | -27 |
| 15-19 | 30 | 17 | 0 | 0 | 0 |
| 20-24 | 19 | 22 | 5 | 1 | 19 |
| 25-29 | 11 | 27 | 10 | 2 | 22 |
| 30-34 | 8 | 32 | 15 | 3 | 24 |
| 35-40 | 2 | 37 | 20 | 4 | 8 |
| \(\sum fi\) =200 | \(\sum fiui\)=-202 |
\(\quad \overline { x } =a+\frac { \sum { { f }_{ i }{ u }_{ i } } }{ \sum { { f }_{ i } } } \times h\)
substituting \(\overline {x}=17+\frac{-202}{200}\times5\)
\(\overline {x}\) =17-5.05=11.95
58.
Relationship between different measures of dispersion
1. Mean Deviation = \(\frac{4}{5}\) S.D.
2. Quartile Deviation = \(\frac{2}{3}\) S.D.
3. Quartile Deviation = \(\frac{5}{6}\) S. D.
59.
| Component | Description |
| Title | Title is a brief and clear explanation of the contains of the table |
| Table Number | A number is assigned to a table for easy identification when many tables are included |
| Date | Date of the creation of the table should be indicated |
| Row Designations | Each row of the table is given a brief name, usually provided in the first column. Such a name is known as a "stub", and the column is known as the "stub column" |
| Column Headings | Each column is given a heading to explain the nature of the figures included in each column. Such names are known as "captions" or "headings". |
| Body of the table | Data is entered into the main body and should be created for easy identification of each data items. Numeric values are often ordered in either ascending or descending order. |
| Unit of Measurement | The unit of measurement of the values in the table body should be indicated. |
| Sources | The tables should provide the primary and secondary sources for the data below the body of the table. |
| Footnotes and References | Addition details for clarifying the contents of the table. |
60.
Table showing distribution of production in two fortnights amongst internal consumption, exports and stock. (in tones)
| Sugar Mill | December 2009 (First Fortnight) | December 2010 (First Fortnight) |
| Production Off take from factories | 154,000 | 2,83,000 |
| Exports | 24,000 | 41,000 |
| stock | 1,62,000 | 63,000 |
| Total | 3,40,000 | 3,87,000 |
61.
(i) Price rigidity refers to a situation in which whether there is change in demand and supply the price tends to stay fixed.
(ii) If a firm tries to reduce the price the rivals will also react by reducing their prices. Likewise,if it tries to raise the price, other firms will not do so. It will lead to loss of customers for the firm which intended to raise the price.
62.
(i) When more output can be sold only by reducing the prices, AR or Price > MR.
(ii) Equilibrium is achieved when MC = MR.
(iii) So, Price is more than MC at the equilibrium level.
63.
(i) Mathematically speaking, price elasticity of demand is case of Normal good is negative, since the change in quantity demanded is in opposite direction to the change in price as there is inverse relationship exists between price of Normal Good and Quantity demanded for Normal Good.
(ii) Price elasticity of supply in case of Normal good is positive, since the change in quantity supplied is in same direction to the change in price as there is positive relationship exists between price of Normal Good and Quantity supplied for Normal Good.
(iii) So, in Nutshell, 'Minus sign' attached with price elasticity of demand shows Law of Demand and 'Plus sign' attached with price elasticity of supply shows Law of Supply
64.
Worker Population Ratio in India 1999-2000
65.
By manipulating data, one can prove or disprove anything. Therefore, it is rightly said that there are three lies, lie, damn lie and statistics. If we start presenting data, we can prove that during 1950-1990, India made great achievements and we can also present facts in a way which will prove that we could not achieve anything during this period. Here are some examples to show how statistics are misused.
1. 50% girls of this college marry the lecturers of the college. (There were two girls, one of them married college lecturer.)
2. My result has been 100%. (Lady claiming so taught only one student).
3. Company's A's profits are double than company B's Profits. (in absolute terms they are but comparison is to be made in percentage and according to that company B's performance is better.) Therefore, one should have an expert knowledge to derive meaning of statistical statements and be cautious before relying on them.
66.
In this case, we shall use census method. In making of results, we cannot use sample method as each and every item of the universe is so relevant that it cannot be missed.
67.
Problems of choice is unavoidable in the ordinary business of life because of following reasons.
1. Unlimited Wants: Human wants are unlimited. The moment one want is satisfied other one creeps up. It is a never-ending phenomenon both in quantitative and qualitative terms. An important thing to note is that however, wants are unlimited but they vary in their intensity. It is because of this variation in intensity that people are able to allocate the resources to satisfy their some wants. 2. Scarce Means: Means to satisfy human wants are scarce. Had means been unlimited, there would have been no economic problem at all. Resources being limited, all wants can not be satisfied; then the problem of prioritizing the wants arises.
3. Means have alternative uses: Economic resources can be put to various uses. Like a piece of land can be used for agriculture, school, hospital or residential building. It is because of alternative uses of resources that we have to decide about best allocation of resources.
68.
As, we know condition for consumer equilibrium is,
Necessary Condition
Marginal utility of last rupee spend on each commodity is same. Suppose there are two commodities, X and Y respectively.
So, for commodity X, the condition is, Marginal Utility in terms of Money = Price of X
Or \(\frac{Marginal utility of a product in utill[MUx]}{Marginal utility of one rupee[MUm]}\)=price of X
Or \(\frac { M{ U }_{ x } }{ P_{ x } } =M{ U }_{ m }\) ------(1)
Similarly, for commodity Y, the condition is
Or \(\frac { M{ U }_{ y } }{ { P }_{ y } } M{ U }_{ m }\) -------(2)
Putting equation (2) in (1), we get
\(\frac { M{ U }_{ x } }{ { P }_{ x } } =\frac { M{ U }_{ y } }{ { P }_{ y } } \)
But as given in the question that the ratio of marginal utility to price in case of X is lower than that in case of Y, i.e.,
\(\frac { M{ U }_{ x } }{ { P }_{ x } } <\frac { M{ U }_{ y } }{ { P }_{ y } } \). It means, marginal utility Px PII from the last rupee spent on commodity X is less than the marginal utility from the last rupee spent on commodity Y. So, to attain the equilibrium the consumer must decrease the quantity of X which will increase the MUx and increase the quantity of Y, which will decrease the MU. Decrease y in quantity of X and increase in quantity till \(\frac { M{ U }_{ x } }{ { P }_{ x } } =\frac { M{ U }_{ y } }{ { P }_{ y } } \).
69.
The average revenue (AR) of a firm is defined as total revenue per unit of output sold. Let a firm's output be Q and the market price be P, then
TR equals P x Q. Hence,
AR = \(\frac { TR }{ Q } \)=\(\frac { P\times Q }{ Q } =P\)
In other words, for a price-taking firm, average revenue equals the market price.
70.
(a) When TR curve is a positively sloping straight line passing through the origin, demand curve (or price line) will be horizontal. It is shown in the shown in the reason is that demand curve is also the price line. When TR is a straight positively sloped line, price at each level of output is constant.
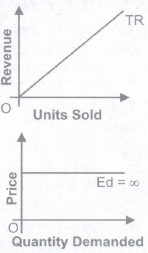
(b) When TR is a horizontal line, demand curve is a rectangular hyperbola. It is shown:
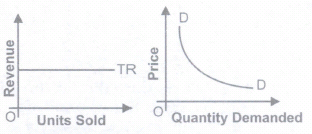
The reason is that, the price at each level of output declines.
71.
(i) For producing a commodity, a firm requires factor inputs (like services of land, labour, capital etc.) and non-factor inputs (like raw material, electricity, fuel etc.).
(ii) Actual money spent by a firm on buying and hiring of factor and nonfactor inputs is called explicit cost. As per question, a producer is hiring the labour, than the wages and salary paid to labour is a explicit cost.
(iii) Implicit cost is the imputed or estimated value of inputs supplied by the owner of the firm himself. As, per question, if a producers start a business by investing his own savings, than the imputed interest on self-supplied capital he earned is a implicit cost.
72.
| Units of Labour (QL) | Average Product (AP) (Units) | Total Product (TP) (Units) | Marginal Product (MP) (Units) |
| 1 | 8 | 8(AP X QL) | 8\(\left( \frac { \Delta TL }{ \Delta QL } \right) \) |
| 2 | 10 | 20 (AP X QL) | 12 \(\left( \frac { \Delta TL }{ \Delta QL } \right) \) |
| 3 | 10\(\left( \frac { { TP }_{ L } }{ QL } \right) \) | 30 (AP X QL) | 10 |
| 4 | 9 | 36 (AP X QL) | 6\(\left( \frac { { \Delta TP }_{ L } }{ \Delta QL } \right) \) |
| 5 | 8\(\left( \frac { { TP }_{ L } }{ QL } \right) \) | 40 \(\sum\)MP | 4 |
| 6 | 7 | 42 (AP X QL) | 2 \(\left( \frac { { \Delta TP }_{ L } }{ \Delta QL } \right) \) |
73.
No, rise in prices of other goods does not have the same effect on demand for a commodity.
(i) In case of rise in price of substitute goods, demand for the given commodity rises.
(ii) In case of rise in price of complementary goods, demand for the given commodity falls.
74.
Given Q = 10 - 3P.
When P = \({5\over3},Q=10-3\times{5\over3}=5\)
Differentiating Q with respect to P,
we get,
We know,\({\triangle Q\over \triangle P}=-3\)
\(ED={\triangle Q\over \triangle P}\times {P\over Q}=-3\times{5/3\over 5}\)
\(=-3\times{5\over3}\times{1\over5}=[-]1\)
Negative Sign of ED indicates that inverse relationship between price and quantity demanded.
PED = 1 [Unitary elastic demand].

11th Standard CBSE Syllabus & Materials
11th Standard CBSE
CBSE 11th Business Studies Forms of Business Organisation Sample Question Papers Study Material - QB365 Set A
NEW11th Standard CBSE
CBSE 11th Business Studies Business, Trade and Commerce Sample Question Papers Study Material - QB365 Set A
NEW11th Standard CBSE
CBSE 11th Physics Waves Sample Question Papers Study Material - QB365 Set A
NEW11th Standard CBSE
CBSE 11th Physics Kinetic Theory Sample Question Papers Study Material - QB365 Set A



CBSE 11th Standard CBSE Subjects
CBSE Standards










