
 100% FREE ACCESS
11th Standard CBSE Syllabus & Materials
11th Standard CBSE
CBSE 11th Economics PART-A - Presentation of Data - New Sample Question Papers Study Material - QB365 Set A
NEW11th Standard CBSE
CBSE 11th Economics PART-A - Organisation of Data - New Sample Question Papers Study Material - QB365 Set A
NEW11th Standard CBSE
CBSE 11th Economics PART-A - Collection of Data - New Sample Question Papers Study Material - QB365 Set A
NEW11th Standard CBSE
CBSE 11th Economics PART-A - Introduction to Economics and Statistics - New Sample Question Papers Study Material - QB365 Set A
NEW11th Standard CBSE
CBSE 11th Business Studies International Trade Sample Question Papers Study Material - QB365 Set A
NEW11th Standard CBSE
CBSE 11th Business Studies Evolution and Fundamentals of Business Sample Question Papers Study Material - QB365 Set A

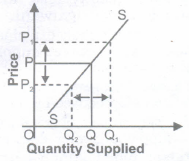
Published on: 05/03/2020
11th Standard CBSE Economics Public Exam Sample Question 2020
Download CBSE Class 11th Standard CBSE undefined question papers, sample papers, important questions, and previous year solved papers in PDF format. Get free study materials, NCERT solutions, and exam preparation resources for Class 11th Standard CBSE undefined
Questions + Answers key
Take MCQ Biology Test
1.
Suppose price of a good is higher than equilibrium price. Explain changes that will establish equilibrium supply.
2.
Which values are of utmost importance in making of a project?
3.
Why do we need an index number?
4.
What are the requisites of an ideal average?
5.
From the data given below, find Quartile deviation and coefficient of Q.D.
| Variable | 30-39 | 40-49 | 50-59 | 60-69 | 70-79 | 80-89 | 90-99 |
| Frequency | 2 | 3 | 11 | 20 | 32 | 25 | 7 |
6.
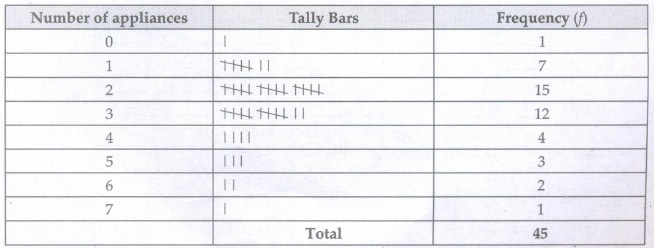
In a class of 45 students, survey was conducted to know the number of personal gadgets student is using. Following information was collected. Present this in the form of a discrete frequency distribution.
| 1 | 3 | 2 | 2 | 2 | 2 | 1 | 2 | 1 | 2 | 2 | 3 | 3 |
| 3 | 3 | 3 | 3 | 2 | 3 | 2 | 2 | 6 | 1 | 6 | 2 | 1 |
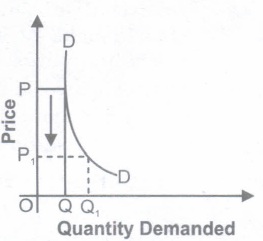
| 5 | 1 | 5 | 3 | 2 | 4 | 2 | 7 | 4 | 2 | 4 | 3 | 5 |
| 2 | 0 | 3 | 1 | 4 | 3 |
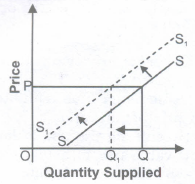
7.
Explain merits and demerits of graphic presentation.
8.
Calculate correlation coefficient between X and Y and comment on their relationship.
| X | 1 | 3 | 4 | 5 | 7 | 8 |
| Y | 2 | 6 | 8 | 10 | 14 | 16 |
9.
What are the essentials of a good statistical table? Using an imaginary example, indicate different parts of a table.
10.
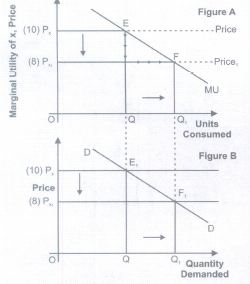
From the following table, find out the level of output at which the producer will be in equilibrium. Give reasons for your answer
| Output (units) | Marginal Revenue(Rs) | Marginal Cost(Rs) |
| 1 | 8 | 10 |
| 2 | 8 | 8 |
| 3 | 8 | 7 |
| 4 | 8 | 8 |
| 5 | 8 | 9 |
11.
What guidelines will you keep in mind while constructing a diagram?
12.
Compare between perfect competition and monopolistic competition.
13.
What is a statistical enquiry? What are the steps in collection of data?
14.
Distinguish between change in quantity supplied and change in supply. Use diagram.
15.
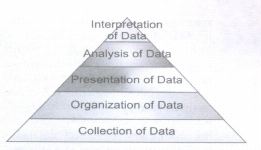
Describe various stages of statistics ad the tools used in it.
16.
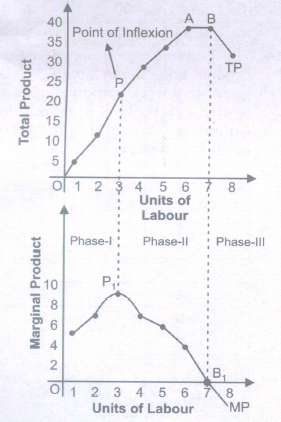
Explain the likely behaviour of Total Product and Marginal Product when for increasing production only one input is increased while all other inputs are kept constant.
17.
Any transaction which involves money is associated with Economics. Defend or refute. Justify your answer.
18.
"The rising portion of the SMC curve is the firm supply curve of competitive firm". Explain.
19.
Why does the difference between Average Total Cost and Average Variable Cost decrease with an increase in the level of output? Can these two be equal at some level of output? Explain.
20.
From the schedule provided below calculate the total revenue, demand curve and the price elasticity of demand:
| Quantity | 1 | 2 | 3 | 4 | 5 | 6 | 7 | 8 | 9 |
| Marginal Revenue | 10 | 6 | 2 | 2 | 2 | 0 | 0 | 0 | -5 |
21.
Explain the effect of the following on demand for a good:
(i) Rise in Income for Normal Goods.
(it) Rise in Income for Inferior Goods.
22.
State and explain the conditions of consumer's equilibrium in indifference curve analysis.
23.
Discuss the central problems of an economy
24.
What is the behaviour of average fixed cost as output increases?
25.
What decisions must be taken prior to data collection
26.
How would you select a base year if a normal period is not available?
27.
In the previous question, Calculate the relative measures of variation and indicate the value which in your opinion, is more reliable.
28.
Distinguish between Absolute and relative frequencies
29.
What are the general rules to construct a Time Series graph?
30.
Why is correlation preferred to covariance as a measure of association?
31.
What are the essentials of a good statistical table?
32.
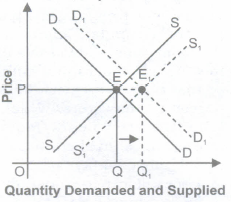
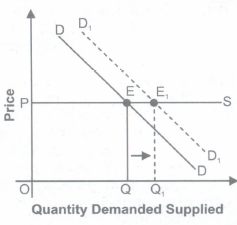
Under what condition increase in demand would not make any effect on equilibrium price?
33.
From the following data of the marks obtained by 60 students of a class,find median.
| Marks | 20 | 30 | 40 | 50 | 60 | 70 |
| No of students | 8 | 12 | 20 | 10 | 6 | 4 |
34.
Diagrams have a memorizing effect. Explain.
35.
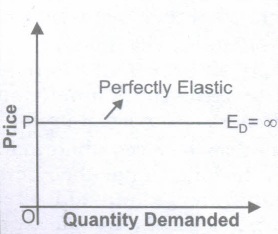
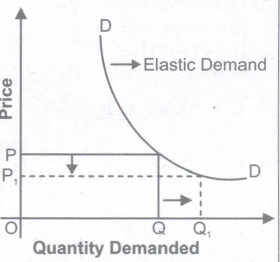
Draw a demand curve in different market situation and also compare its elasticity. of demand.
36.
"MC should be rising at the point of Producer's Equilibrium". Comment.
37.
Firm 'A' produces both jeans and shirts. How will an increase in the price of jeans affect the supply curve of the shirts?
38.
Statistical Methods are no substitute for common sense. Comment.
39.
Differentiate between economic and non economic activities.
40.
What is a statistical enquiry? Why is it conducted?
41.
Calculate TR and MR from the following data.
| units sold | 1 | 2 | 3 | 4 | 5 | 6 |
|---|---|---|---|---|---|---|
| AR(Rs) | 25 | 23 | 21 | 19 | 18 | 15 |
42.
What are the Characteristics of a perfectly competitive market?
43.
Demand for electricity has "increased". However, supply cannot be increased due to lack of resources. Explain how, in any two ways, demand for electricity can be "decreased".
44.
Complete the following table:
| Units of Labour | (Q) Average Product (Units) | Marginal Product (Units) |
| 1 | 8 | - |
| 2 | 10 | - |
| 3 | - | 10 |
| 4 | 9 | - |
| 5 | - | 4 |
| 6 | 7 | - |
45.
A consumer spends Rs 80 on a commodity when price is Rs 1 per unit. If the price increases by Rs 1, his expenditure becomes Rs 96. Comment on PED.
46.
Derive the inverse relation between price of the good and its demand from single commodity equilibrium condition "marginal utility = price".
47.
Discuss the subject matter of economics.
48.
'Limitation of study' mentions:
Sample Size
Assumptions
Methodological limitations
All of the above
49.
If the prices of all commodities in a place have increased 1.25 times in comparison to the base period, the index number of prices of that place is now
125
150
225
None of these.
50.
In a distribution, the value around which the items tend to be most heavily concentrated is called:
Third quartile
Mean
Mode
Median
51.
A series showing the sets of all distinct values individually with their frequencies is known as
Grouped frequency distribution
Simple frequency distribution
Cumulative frequency distribution
None of these
52.
Sum of square of the deviations about mean is
Zero
Minimum
Maximum
None of these
53.
The range of simple correlation coefficient is:
0 to infinity
Minus one to plus one
Minus infinity to infinity
0 to plus one
54.
Coefficient of variation is
Absolute measure(
Relative measure
Both (a) and (b)
None of these
55.
Median of a distribution can be obtained from
Histogram
Frequency polygon
Less than type ogive
None of these
56.
The headings of the rows given in the first column of a table are called:
Titles
Prefatory notes
Stubs
Captions
57.
With a given supply curve a decrease in demand causes
an overall decrease in price but an increase in equilibrium quantity
an overall increase in price but a decrease in equilibrium quantity.
an overall decrease in price and a decrease in equilibrium quantity
no change in overall price but a reduction in equilibrium quantity
58.
Square is a:
One-dimensional diagram
two-dimensional diagram
Diagram with no dimension
none of the above
59.
What is the relation between price and marginal cost at equilibrium, when price remains constant with the rise in output.
Price = Marginal Cost
Price> Marginal Cost
Price < Marginal cost
None of these
60.
Price discrimination is one of the features of________
monopolistic competition
monopoly
perfect competition
oligopoly
61.
Universe in Statistics means:
All celestial bodies
People living on the earth
People or things about which we are conducting a study or survey
All of the above
62.
What implication(s) does resource scarcity has for the satisfaction of wants?
Not all wants can be satisfied
The discovery of new natural resources is necessary to increase our ability to satisfy wants.
We will never be faced with the need to make choices
We must develop ways to decrease our individual wants.
63.
Primary data is preferred over secondary data where:
Sufficient finance is not available
Much accuracy is not required
Accuracy is important
Time available is short
64.
The term 'market'refers to a______________.
place where buyer and seller bargain a product or service for a price
place where buyer does not bargain
place where seller does not bargain
None of these
65.
The supply of a good refers to:
Actual production of the good
Total existing stock of the good
Stock available for sale
Amount of the good offered for sale at a particular price per unit of time.
66.
Marginal Revenue is equal to:
The change in price divided by the change in output.
The change in quantity divided by the change in price.
The change in P x Q due to a one unit change in output.
Price, but only if the firm is a price searcher.
67.
If marginal cost equals to average total cost,
average total cost is falling
average total cost is rising
average total cost is maximized
average total cost is minimized
68.
Marginal product, mathematically, is the slope of the
Total product curve
Average product curve
Marginal product curve
Implicit product curve
69.
Contraction of demand is the result of:
decrease in the number of consumers.
increase in the price of goods concerned
increase in the prices of other goods
decrease in the income of purchasers
70.
In case of a straight line demand curve meeting the two axes, the price elasticity of demand at the midpoint of the line would be:
0
1
1.5
2
71.
Production Possibilities Curve is also known as
Demand curve
Supply curve
Indifference curve
Transformation curve
72.
When economists speak of the utility of a certain good, they are referring to________________.
The demand for the good
The usefulness of the good in consumption
The satisfaction gained from consuming the good
The rate at which consumers are willing to exchange one unit of good for another one
1.
If at a given price there is excess supply as shown in the given figure.
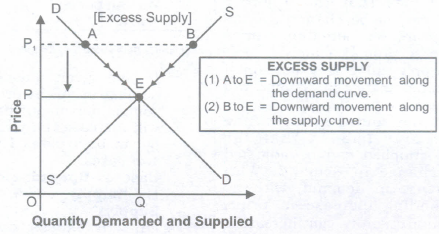
In the given figure, the excess supply of AB at price P1 will create a competition among the producers, which will reduce the price from P1 to P. It can be explained in the following cases:
(i) Downward movement along the supply curve (Contraction in supply): Due to excess supply of AB, the competition among the producers will reduce the price. As we know, positive relationship exists between price and quantity supplied. So fall in price P1 to P leads to fall in supply from B to E.
(ii) Downward movement along the demand curve (Expansion in demand): Due to excess supply of AB, the competition among the producers will reduce the price. As we know inverse. relationship exits between price and quantity demanded. So, fall in price from P1 to P, leads to rise in demand from A to E. It can be explained with the help of the following schedule
| Price(Rs) | Demand | Supply | Resulting tendency |
|---|---|---|---|
| 5 | 1 | 5 | Excess Demand |
| 4 | 2 | 4 | Excess Demand |
| 3 | 3 | 3 | Equilibrium |
In the above schedule at price 5, there is excess supply. This excess supply, leads to fall in price till we reach the equilibrium at price 3.
Note: Contraction in supply and expansion in demand have to be done simultaneously to reach the equilibrium.
2.
(a) Originality: Project must not be copied but an original work of investigator.
(b) Sample Selection: Sample must be randomly selected. There must not be any bias in selection of the sample else the entire motto of preparing project will defeat.
(c) Decision Making: Many decisions are required to be taken in making of a project. Therefore, decision making is another important value.
(d) Communication Skills: In order to get information from people, one needs to be tactful. It calls for good communication skills.
3.
We need an index number because:
Index numbers are indispensable tools of economics and business analysis.
Following are the main uses of index numbers.
1. Index numbers are used as economic barometers: Index number is a special type of averages which helps to measure the economic fluctuations on price level, money market, economic cycle like inflation, deflation etc.
2. They are useful in forecasting future economic activity: Index numbers are used not only in studying the past and present workings of our economy but also important in forecasting future economic activity. Index numbers measure the purchasing power of money. Index of Exports and Imports provides relevant information regarding foreign trade and accordingly government can formulate its export-import policy, business men who are engaged in foreign trade can take their decisions and one can predict changes in inflow or outflow of foreign exchange.
3. The cost of living index numbers determine whether the real wages are rising or falling or remain constant: The real wages can be obtained by dividing the money wages by the corresponding price index and multiplied by 100. Real wages helps us in determining the purchasing power of money. Index numbers are used in deflating. Index numbers are highly useful in deflating i.e. they are used to adjust the wages for cost of living changes and thus transform nominal wages into real wages, nominal income to real income, nominal sales to real sales etc. through appropriate index numbers.
4. Used in Deflating: Deflating means correcting or adjusting a value which has inflated. It makes allowances for the effect of price changes. When prices rise, the purchasing power of money declines. If the money incomes of people remain constant between two periods and prices of commodities are doubled the purchasing power of money is reduced to half. For example if there is an increase in the price of rice from Rs.10/ kg in the year 1980to Rs.20/kg in the year 1982. then a person can buy only half kilo of rice with no. so the purchasing power of a rupee is only 50paise in 1982 as compared to 1980.
Thus the purchasing power of money \(=\frac { 1 }{ Price\quad Index } \) In times of rising prices the money wages should be deflated by the price index to get the figure of real wages. The real wages alone tells whether a wage earner is in better position or in worst position.
For calculating real wage, the money wages or income is divided by the corresponding price index and multiplied by 100.
Money wages i.e. Real wages = \(\\ \frac { Money\quad wages }{ Priceindex } \times 100\)
Thus Real Wage Index \(=\frac { Realwagescurrentyear }{ Realwagesofbaseyear } \times 100\)
5. Index numbers helps in formulating suitable economic policies and planning: Many of the economic and business policies are guided by index numbers. For example while deciding the increase of DA of the employees; the employer's have to depend primarily on the cost of living index. If salaries or wages are not increased according to the cost of living it leads to strikes, lock outs etc. The index numbers provide some guide lines that one can use in making decisions.
6. They are used in studying trends and tendencies: Since index numbers are most widely used for measuring changes over a period of time, the time series so formed enable us to study the general trend of the phenomenon under study. For example for last 8 to 10 years we can say that imports are showing upward tendency. Businessmen need to know the trends in the market to take decisions about wage rates, prices of the product, prices of raw materials etc. Therefore, index numbers are very useful for them.
4.
(i) It should be rigidly defined. If an average is left to the estimation of an observer and if it is not a definite and fixed value it cannot be representative of a series. The bias of the investigator in such cases would considerably affect the value of the average. If the average is rigidly defined; this instability in its value would be no more, and it would always be a definite figure,
(ii) It should be based on all the observations of the series. If some of the items of the series are not taken into account in its Calculation the average cannot be said to be a representative one. As we shall see later on there are some averages which do not take into account all the values of a group and to this extent they are not satisfactory averages.
(iii) It should be capable of further algebraic treatment. If an average does not possess this quality, its use is bound to be very limited. It will not be possible to calculate, say, the combined average of two or more series from their individual averages; further it will not be possible to study the average relationship of various parts of a variable if it is expressed as the sum of two or more variables. Many other similar studies would not be possible if the average is not capable of further algebraic treatment.
(iv) It should be easy to calculate and simple to follow. If the calculation of the average involves tedious mathematical processes it will not be readily understood and its use will be confined only to a limited number of persons. It can never be a popular average. As such, one of the qualities of a good average is that it should not be too abstract or mathematical and there should be no difficulty in its calculation. Further, the properties of the average should be such that they can be easily understood by persons of ordinary intelligence.
(v) It should not be affected by fluctuations of sampling. If two independent sample studies are made in any particular field, the averages thus obtained, should not materially differ from each other. No doubt, when two separate enquires are made, there is bound to be a difference, in the average values calculated but in some cases this difference would be great while in others comparatively less. These averages in which this difference, which is technically called "fluctuation of sampling" is less, are considered better than those in which its difference is more.
(vi) It should be based on homogeneous . and uniform items: One more thing to be remembered about averages is that the items whose average is being calculated should form a homogenous group. It is absurd to talk about the average of a man's height and his weight. If the data from which an average is being calculated are not homogeneous, misleading conclusions are likely to be drawn. To find out the average production of cotton cloth per mill, if big and small mills are not separated the average would be unrepresentative. Similarly, to study wage level in cotton mill industry of India, separate averages should be calculated for the male and female workers. Thus we see that as far as possible, the data from which an average is calculated should be a homogeneous lot. Homogeneity can be achieved either by selecting only like items or by dividing the heterogeneous data into a number of homogeneous groups.
5.
| Class | Frequency | Cumulative Frequency |
| 29.5-39.5 | 2 | 2 |
| 39.5-49.5 | 3 | 5 |
| 49.5-59.5 | 11 | 16 |
| 59.5-69.5 | 20 | 36 |
| 69.5-79.5 | 32 | 68 |
| 79.5-89.5 | 25 | 93 |
| 89.5-99.5 | 7 | 100 |
Q1=\(\frac{n}{4}\)th observation \(\frac{100}{4}\)= 25th observation
Q 1 class is 59.5-69.5
Q1=l1+\(\frac { \left( N/4-C \right) }{ f } \)
(i) Where l1=59.5; f=20; \(\frac{N}{2}\)=25; C=16; i=10
Q1=59.9+\(\frac { \left( 25-16 \right) }{ 20 } \)(10)=64
Q3 =\(\frac { 3(n) }{ 4 } \) th observation \(\frac { 3(100) }{ 4 } \)=75 th observation
Q3 class is79.5-89.5
Then Quartile of a continuous series can be calculated by the below interpolation formula.
Q3=l1+\(\frac { \left( 3N/4-C \right) }{ f } \)(i)
Where l1=79.5; f=25; \(\frac{3N}{4}\)=75; c=68; i=10
Q3=79.5+\(\frac { \left( 75-68 \right) }{ 25 } \)(10)=82.3
Quartile Deviation (Q.D) =\(\frac { { Q }_{ 3 }-{ Q }_{ 1 } }{ 2 } =\frac { 270.83-150 }{ 2 } =\frac { 120.83 }{ 2 } \)=9.15
Coefficient of Quartile Deviation =\(\frac { { Q }_{ 3 }-{ Q }_{ 1 } }{ { Q }_{ 3 }+{ Q }_{ 1 } } =\frac { 270.83-150 }{ 270.83+150 } =\frac { 120.3 }{ 420.83.3 } \)=0.125
6.
Frequency array of domestic appliances used by 45 families
7.
Merits:
(a) Attractive and Impressive: Graphs are attractive and impressive.
(b) Simple and easily understandable: Graphs are easy and simple to understand. Knowledge of mathematics is not required to understand graphs.
(c) Useful in Comparison: Graphs prove very useful in comparing data from one year to another or otherwise.
(d) Helps to understand trend: Graphs help us to understand trend in a variable.
(e) Helps to measure statistical averages: Graphs are used to measure some statistical tools like median, mode, quartiles and correlation etc.
(f) Helps to understand shape of the distribution: We can use graphical presentation to understand if a curve is normal or skewed; if it is upward sloping or downward sloping etc.
(g) Helps in forecasting: It helps us to predict future values on the basis of past statistics.
(h) Graphs are useful in all fields: From sports to education to medical and engineering, in all fields we make use of graphs. They are specifically useful for policy formulation and decision making.
Disadvantages of Graphic Presentation
(a) Time Consuming: Graph making is a time consuming task.
(b) Layman Can't Understand: A layman cannot understand and interpret the data represented graphically.
(c) Not suitable for all types of data: Graphs are not suitable for all types of data.
8.
| X | X2 | Y | Y2 | XY |
| 1 | 1 | 2 | 4 | 2 |
| 3 | 9 | 6 | 16 | 18 |
| 4 | 16 | 8 | 64 | 32 |
| 5 | 25 | 10 | 100 | 50 |
| 7 | 49 | 14 | 196 | 98 |
| 8 | 64 | 16 | 256 | 144 |
| Total \(\sum\)X = 23 | \(\sum\)X2=164 | \(\sum\)Y=56 | \(\sum\)Y2=636 | \(\sum\)XY = 344 |
9.
The preparation of a good table is an art. The purpose of tabulation must always be kept in mind before the preparation of a statistical table. A good statistical table must contain at least the following components.
In general, a statistical table consists of the following eight parts. They are as follows:
1. Table Number: Each table must be given a number. Table number helps in distinguishing one table from other tables. Usually tables are numbered according to the order of their appearance in a chapter. For example, the first table in the first chapter of a book should be given number 1.1and second table of the same chapter be given 1.2 Table number should be given at its top or towards the left of the table.
2. Title of the Table: Every table should have a suitable title. It should be short & clear. Title should be such that one can know the nature of the data contained in the table as well as where and when such data were collected. It is either placed just below the table number or at its right.
3. Caption: Caption refers to the headings of the columns. It consists of one or more column heads. A caption should be brief, concise and self-explanatory, Column heading is written in the middle of a column in small letters.
4. Stub: Stub refers to the headings of rows.
5. Body: This is the most important part of a table. It contains a number of cells. Cells are formed due to the intersection of rows and column. Data are entered in these cells.
6. Head Note: The head-note (or prefactory note) contains the unit of measurement of data. It is usually placed just below the title or at the right hand top corner of the table.
7. Foot Note: A footnote is given at the bottom of a table. It helps in clarifying the point which is not clear in the table. A footnote may be keyed to the title or to any column or to any row heading. It is identified by symbols such as *,+,@,£ etc.
8. Source Note: The source note shows the source of the data presented in the table. Reliability and accuracy of data can be tested to some extent from the source note. It shows the name of the author, title, volume, page, publisher's name, year and place of publication of the book or journal from which data are complied.
--- THE TITLE ----
---- Prefatory Notes ----
| ----Box Head---- | |
| ---- Row Captions ---- | ---- Column Captions ---- |
| ---- Stub Entries ---- | ---- The Body ---- |
Foot Notes
Source Note Solution
10.
A producer will be in equilibrium where the following two conditions are satisfied:
(i) MR is equal to MC.
(ii) MC becomes greater than MR after this level of output.
Accordingly, the producer will be in equilibrium at 4 units of output because at this level both the conditions of producer's equilibrium are satisfied. However, MR is equal to MC at 2 units of output also. But, the second condition is not fulfilled here.
11.
The following general guidelines are taken into consideration while preparing diagrams:
1. Title: Each diagram should have a suitable title. It may be given either at the top of the diagram or below it. The title must convey the main theme which the diagram intends to portray.
2. Size: The size and portion of each component of a diagram should be such that all the relevant characteristics of- the data are properly displayed and can be easily understood.
3. Proportion of length and breadth: An appropriate proportion between the length and breadth of the diagram should be maintained. As such there are no fixed rules about the ratio of length to width.
4. Proper scale: There are again no fixed rules for selection of scale. The diagram should neither be too small nor too large. The scale for the diagram should be decided after taking into consideration the magnitude of data and the size of the paper on which it is to be drawn. The scale showing the values as far as possible should be in even numbers or in multiples of 5, 10, 20, and so on. The scale should specify the size of the unit and the nature of data it represents, for example, 'millions of tonnes', in ~ thousand, and the like. The scale adopted should be indicated on both vertical and horizontal axes if different scales are used. Otherwise, it can be indicated at some suitable place on the graph paper.
5. Footnotes and source note: To clarify or elucidate any points which need further explanation but cannot be shown in the graph, footnotes are given at the bottom of the diagrams.
6. Index: A brief index explaining the different types of lines, shades, designs, or colours used in the construction of the diagram should be given to understand its contents.
7. Simplicity: Diagrams should be prepared in such a way that they can be understood easily. To keep it simple, too much information should not be loaded in a single diagram as it may create confusion. Thus if the data are large, then it is advisable to prepare more than one diagram, each depicting some identified characteristic of the same data.
12.
| Perfect Competition | Basis | Monopolistic Competition |
|---|---|---|
| It refers to a market situation where there are very large number of buyers and sellers dealing in a homogeneous product at a price fixed by the market. |
Meaning | It refers to a market situation in which there are large number of firms selling closely related but differentiated products. |
| The products sold are homogeneous. So, buyers are willing to pay same price for all products, which leads to uniform price in the market. | Nature of Product | Products are differentiated on the basis of brand, size, colour, shape etc. So, a firm is in a position to influence the price. |
| Demand curve is perfectly elastic as price remains the same at all levels of output. | Demand Curve | Demand curve slopes downwards as more output can be sold only at less price. |
| Firm is a price-taker as price is determined by the industry. | Price | Firm is neither a price-taker nor a price-maker but has partial control over price due to product differentiation. |
| Buyers and sellers have perfect knowledge about market conditions. | Level of Knowledge | Sellers and buyers do not have perfect knowledge due to product differentiation and selling costs incurred by the sellers. |
| No selling costs are incurred as buyers and sellers have perfect knowledge about market conditions. | Selling Cost | Heavy selling costs are incurred on sales promotion due to lack of perfect knowledge among buyers and sellers. |
13.
Statistical enquiry refers to an investigation on a topic by any agency or an individual which involves quantitative facts. In other words, statistical enquiry implies search of truth by using statistical tools. All statistical enquiries involve collection of data, their organization, presentation, analysis and interpretation. Collection of data is the foundation of all other exercises involved in undertaking a statistical enquiry. Organization, presentation and analysis all will become futile if there is any defect in data collected. Therefore it is of utmost importance in a statistical enquiry. An investigator whether it be an individual or an agency has to plan all stages of data collection much in advance. He has to move step by step. Given below are some of the major steps in collection of data.
(a) Develop a complete plan for survey: It is important to draw a complete plan for a statistical survey before we start collecting data actually. The statistician has to plan three things.
(i) What data to be obtained;
(ii) From whom data are to be obtained
(iii) By what methods the data are to be obtained-primary or secondary He also has to decide the expenditure to be incurred and time availability. The expenditure and the time period will determine most of the subsequent steps he has to take.
(b) Decide whether to adopt census method or sample method: For conducting survey on any issue, the investigator has two options: sample and census. Which method will depend on budget, availability of time and accuracy requirement?
(c) Preparing Questionnaire: Designing the questionnaire is influenced by many considerations like number of questions to be included, language of questions, types of questions, ordering of the questions etc. we shall discuss it in detail later in this chapter under the heading "construction of a questionnaire".
(d) Mode of Distribution of Questionnaire: There are different ways in which questionnaire can be sent. It can be personal or by post or by email. In personal it can be filled either by respondent or enumerator. These methods have also been discussed in detail later in the chapter.
(e) Check the filled in forms for completeness and consistency: It is the last stage in collection of data. This stage comes when duly filled forms are returned by the respondents. Each questionnaire must be examined and edited if necessary.
14.
| Changes in quantity supplied | Basis | Change in supply | ||||||||||||||||||||||||
|---|---|---|---|---|---|---|---|---|---|---|---|---|---|---|---|---|---|---|---|---|---|---|---|---|---|---|
| The change in quantity supplied due to the change in price of the commodity. | Meaning | Change in supply due to the change in factors other than price | ||||||||||||||||||||||||
| Movement along the supply curve (i) Expansion in supply (ii) Contraction in supply |
Alternative Name |
Shift in supply curve |
||||||||||||||||||||||||
| (i) It states that rise in quantity supplied due to the rise in price of the commodity (ii) It states that fall in quantity supplied due to the fall in price of the commodity |
Meaning | (i) An increase in supply means that producers now supply more at a given price level (ii) A decrease in supply means that producers now supply less at a given price level |
||||||||||||||||||||||||
|
Schedule |
|
||||||||||||||||||||||||
 |
Diagrams | 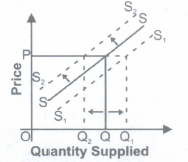 |
||||||||||||||||||||||||
15.
It can be presented in the form of a hierarchy.
16.
According to the Law of Variable Proportion when only one input is increased while all other inputs are kept constant, Marginal Product and Total Product behave in the following manner:
(i) When Marginal product rises (till Point PI), Total product increases at an increasing rate (convex shape) (till point P).
(ii) When Marginal product falls and remains positive (Till point B1), total product increases at a diminishing rate (concave shape) (till point A).
(iii) When Marginal Product is zero (at point B1), Total Product is at its maximum and constant (At point B).
(iv) When Marginal product becomes negative (after point B1), total product falls (after point B).
17.
I refute this statement. Any activity concerned with production, distribution or investment is said to be associated with Economics. Many activities which involve money but are not a part of
Economics are exemplified below:
(i) Donations;
(ii) Prizes;
(iii) Pocket Money;
(iv) Gifts;
(v) Gambling etc.
On the other hand, many activities are a part of Economics but are not involving money. It includes:
(i) Production for self consumption;
(ii) Investment in own business;
(iii) Barter system etc.
18.
(i) The supply curve of the firm tells us the quantity of the product that a firm is willing and able to produce and sell at each possible price.
(ii) The firm will produce and supply an output at the point at which Price is equal to Marginal cost. The derivation of the supply curve is explained with the help of the given figure.
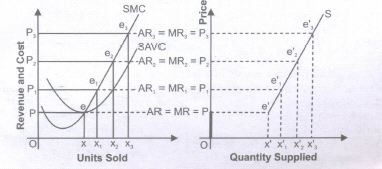
(iii) The SMC of the firm is given. Let us initially assume that the market price is OP1. The firm will produce and supply an output of OX1 because at el' price = MC. (OX1 is the equilibrium output supplied, as MC = MR and MC cuts MR from below).
(iv) Suppose the market price rises to OP2, then the firm will produce and sell OX2 level, because at e2 level price = MC = MR.
(v) Similarly, as market price increases to OP3, quantity supplied increases to OX3 However, the firm will not supply any quantity if the price falls below OP.
(vi) At OP price, the firm will produce and sell OX output. For any price below OPthe firm will not produce and sell anything. The supply will be zero units. Having the above information, the supply schedule can be determined as,
| Price of Product | Units Supplied |
|---|---|
| OP | OX |
| OP1 | OX1 |
| OP2 | OX2 |
| OP3 | OX3 |
(vii) If the market price falls below the minimum of the SAVC, the supply curve jumps to the small segment (OP) on the vertical axis at which there is zero supply. Therefore, two discontinuous [(OP) + (e'S)] pieces define the short run supply curve for the perfectly competitive firm.
19.
As, we know the difference between Average Total Cost and Average Variable Cost is average fixed cost (AFC = ATC- AVC) and AFC always decreases with the increase in output. It can be explained with the help of the following diagram and schedule.
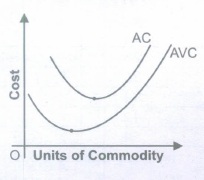
It can be seen from the above diagram that there is a huge gap between AC and AVC with the starting of production. The gap between them decreases with the increase in production.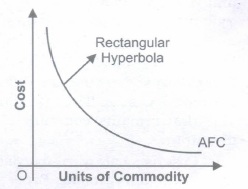
It is so because the gap between AC and AVC is AFC and AFC always decreases with the increase in production. The point to be remembered is that AVC can never touch AC curve because AFC cannot be Zero.
| Units of commodity | TFC | AFC |
|---|---|---|
| 0 | 60 | - |
| 1 | 60 | 60 |
| 2 | 60 | 30 |
| 3 | 60 | 20 |
| 4 | 60 | 15 |
| 5 | 60 | 12 |
20.
| Q | MR | TR=ΣMR | Demand Curve or Price or \(AR=\frac{TR}{Q}\) | ED |
|---|---|---|---|---|
|
1 |
10 6 2 2 |
10 16 18 20 |
10 8 6 5 |
ED > 1 |
| 5 | 2 | 22 | 4.4 | |
| 6 7 8 |
0 0 0 |
22 22 22 |
3.6 3.2 2.75 |
ED =1 |
| 9 | -5 | 17 | 1.9 | ED < 1 |
Rule: When with the fall in price of goods, total revenue rises, ED > 1, if it remains same ED = 1 and if falls then ED < 1.
21.
(i) Rise in Income for Normal Goods:
1. In the above schedule, note that as the income of a consumer rise from Rs.5000 to Rs.6000, the quantity demanded of normal goods increases for any given price of normal goods; namely, given income is Rs.5000 and at price of normal goods is Rs.150, the quantity demanded of normal goods is Rs.20. Whereas given income is Rs.6000, at the same price of normal goods (i.e. 150), the quantity demanded of normal goods is 25.
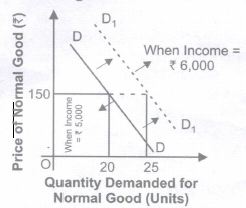
2. In the above diagram, the demand curve for normal goods, when income is Rs.6000 lies to the right of that when income is Rs.5000. Hence, an increase in the income of a consumer shifts the demand curve for normal goods to the right.
(ii) Rise in Income for Inferior Goods:
3. In the above schedule, note that, as the income of a consumer rises from Rs.5000 to Rs.6000, the quantity demanded of inferior goods decreases for any given price of inferior goods. For example, the given income is Rs.5000 and at the price of inferior goods Rs.150, the quantity demanded of inferior goods is 20. Whereas the given income is Rs.6000, at same price of inferior goods (i.e. 150), the quantity demanded for inferior goods is 18.
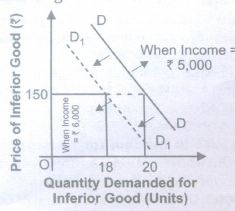
4. In the given diagram the demand curve for inferior goods when income is Rs.6000 lies to the left of that when income is Rs.5000. Hence, an increase in the income of a consumer shifts the demand curve for inferior goods to the left.
22.
(i) To define consumer equilibrium, we use Indifference Curve map and the budget line.
Two Conditions Cor Consumer Equilibrium
(a) Necessary Condition
Marginal Rate of Substitution Market Rate of Exchange \(\left[ \frac { { P }_{ x } }{ { P }_{ y } } \right] \)
Or MRS x,y =\(\frac { { P }_{ x } }{ { P }_{ y } } \)
(Market Rate of Exchange) MRE
Or MRS x,y =MRE\(\left[ \frac { { P }_{ x } }{ { P }_{ y } } \right] \)
If MRS x,y>MRE\(\left[ \frac { { P }_{ x } }{ { P }_{ y } } \right] \)
(a) It means that to obtain one more unit of X, the consumer is willing to sacrifice more unit of Y as compared to what is required in the market.
(b) In other words, consumers willingness to pay for commodity X is higher than what market values for commodity X.
(c) This induces the consumer to buy more of X and less of Y, which result in fall in MRS till it become equal to price.
(ii) If MRS x,y< MRE\(\left[ \frac { { P }_{ x } }{ { P }_{ y } } \right] \)
(a) It means that to obtain one more unit of X, the consumer is willing to sacrifice less unit of Y as compared to what is required in the market.
(b) In other words, consumer's willingness to pay for commodity X is lower than what market values for commodity X.
(c) This induces the consumer to buy less of X and more of Y, which result in rise in MRS till it become equal to price.
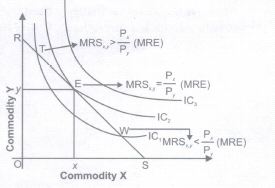
(b) Sufficient Condition MRS Diminishing (Convex) at X, Y a point of equilibrium i.e., when MRS x,y=MRE \(\left[ \frac { { P }_{ x } }{ { P }_{ y } } \right] \)
(ii) The consumer will reach equilibrium when the budget line is tangential to the higher possible Indifference Curve, i.e., where necessary and sufficient conditions satisfy. In the above diagram, the consumer will reach equilibrium at point E where budget line RS is tangential to the highest possible IC2.
(iii) The consumer cannot move to Indifference Curve, i.e., IC3 as this is beyond his money income.
(iv) Even on IC2, all the other points except E are beyond his means.
(v) Hence, at point E, the consumer is in equilibrium where his satisfaction maximizes, given his income and prices of goods X and Y. In equilibrium at E, the slope of Budget line = the slope of Indifference, Therefore, MRS xy is eq to the ratio of the prices of two goods \(\left[ \frac { { P }_{ x } }{ { P }_{ y } } \right] \)
23.
The three central problems of an economyare:
(i) What to produce?
(a) What to produce refers to a problem in which decision regarding which goods and services should be produced is to be taken.
(b) Since its resources are limited, every economy has to decide what commodities are to be produced and in what quantities.
(c) The guiding principle for an economy here is to allocate resources in such a way that gives maximum aggregate utility to the society.
(ii) How to produce?
(a) How to produce refers to a problem in which decision regarding which technique of production should be used is made.
(b) Goods and services can be produced in two ways: by using labour intensive techniques, and by using capital-intensive techniques
(c) The guiding principle for an economy in such a case has to decide about the techniques of production on the basis of cost of production. Those techniques of production should be used which lead to the least possible cost per unit of commodity or service.
(iii) For whom to produce?
(a) For whom to produce refers to a problem in which decision regarding which category of people are going to consume a good, i.e., economically poor or rich.
(b) As we know, goods and services are produced for those who can purchase them or have the capacity to buy them.
(c) Capacity to buy depends upon how income is distributed among the factors of production. The higher the income, the higher will be the capacity to buy and vice versa. So, this is a problem of distribution.
(d) The guiding principle is that the economy must see here that important and urgent wants of its citizens are being satisfied for the maximum possible extent or not.
24.
The shape of AFC is downward sloping Rectangular hyperbola. AFC falls as output increases because AFC=\(\frac{TFC}{Output}\) and TFC remains constant. So, as output increases, TFC remains constant, but AFC falls.
25.
Following steps need to be taken before data collection:
(a) Develop a complete plan for survey: It is important to draw a complete plan for a statistical survey before we start collecting data actually. We need to define the objective of the project should be clearly specified. On the basis of this objective, you will decide sources and methods of data collection and sample size. We also need to define our population precisely. If we are conducting a project on child labour, which area we are covering and how many households are being taken as a sample. At school level sample size should be between 30 to 50. You will have to plan three things.
(i) What data to be obtained (objective)
(ii) From whom data are to be obtained (Population)
(iii) By what methods the data are to be obtained-primary or secondary
(b) You also have to decide the expenditure to be incurred and time availability:
The expenditure and the time period will determine most of the subsequent steps to be taken.
(i) Decide whether to adopt census method or sample method: For conducting survey on any issue, the investigator has two options: sample and census. Which method will depend on budget, availability of time and accuracy requirement?
ii) Preparing Questionnaire: Designing the questionnaire is influenced by many considerations like number of questions to be included, language of questions, types of questions, ordering of the questions etc. It has been explained in detail in chapter-S developing a Questionnaire.
(iii) Mode of Distribution of Questionnaire: There are different ways in which questionnaire can be sent. It can be personal or by post or by e mail. In personal it can be filled either by respondent or enumerator. These methods have also been discussed in detail in the chapter-S.
(iv) Check the filled in forms for completeness and consistency: It is the last stage in collection of data. This stage comes when duly filled forms are returned by the respondents. Each questionnaire must be examined and edited if necessary.
26.
Sometimes it is difficult to distinguish a year which can be taken as a normal year and hence the average of a few years may be regarded as the value corresponding to the base year.
27.
Coefficient of Variation of Wheat \(={S.D\over Mean}\times 100\)
\(={5.43\over15.5}\times100=29.75\%\)
Coefficient of Variation of Rice\(={S.D\over Mean}\times 100\)
\(={7.16\over19.5}\times100=36.72\%\)
In my opinion, it is more reliable to grow wheat as its c.v. is less i.e. consistency is more.
28.
As frequencies shown in different types of series discussed so far were absolute frequencies. These were shown in absolute numbers. Sometimes, it is important to know the relative importance of each class. Therefore, frequencies are shown in percentage of total observations. An example is given below:
| Marks | Absolute Frequency | Relative Frequency(%) |
| 0-10 | 4 | 20 |
| 10-20 | 7 | 35 |
| 20-30 | 4 | 20 |
| 30-40 | 3 | 15 |
| 40-50 | 2 | 10 |
| Total | 20 | 100 |
29.
General rules to construct a Time Series graph
(a) Since time can never be in negative values, II and III quadrant are not used in making of time series graphs.
(b) Time period (week, Month, Year) is taken on X- Axis. And Variable under study is taken on Y-Axis.
(c) We start Yaxis with Zero and decide the scales for both the axis.
(d) Different values are plotted on the graph.
(e) By joining these points, we get a time series graph.
Time series graph can be of three types:
(a) One Variable Graph
(b) Two or more than two variable Graph
(c) When False Base Line is used
(d) Graphs of Different Units
30.
The sign of covariance between X and Y determines the sign of the correlation coefficient. The standard deviations are always positive. When covariance is zero, correlation is also zero. Correlation is preferred to covariance as a measure of association because:
(a) It tells about positive, negative, or zero correlation i.e. no linear correlation.
(b) As well as, r is independent of change of origin and change of scale of measurements.
31.
| Component | Description |
| Title | Title is a brief and clear explanation of the contains of the table |
| Table Number | A number is assigned to a table for easy identification when many tables are included |
| Date | Date of the creation of the table should be indicated |
| Row Designations | Each row of the table is given a brief name, usually provided in the first column. Such a name is known as a "stub", and the column is known as the "stub column" |
| Column Headings | Each column is given a heading to explain the nature of the figures included in each column. Such names are known as "captions" or "headings". |
| Body of the table | Data is entered into the main body and should be created for easy identification of each data items. Numeric values are often ordered in either ascending or descending order. |
| Unit of Measurement | The unit of measurement of the values in the table body should be indicated. |
| Sources | The tables should provide the primary and secondary sources for the data below the body of the table. |
| Footnotes and References | Addition details for clarifying the contents of the table. |
32.
Case l: When supply also increase at the same rate as the demand increases
In the given diagram price is measured on vertical axis and quantity demanded and supplied is measured on horizontal axis. Initially, the equilibrium price is OP and equilibrium quantity is OQ. But when "demand and supply both increase at the same rate" then,
(i) Equilibrium price remains constant at OP; and
(ii) Equilibrium quantity rises from OQ to OQ1
Case II: When supply becomes perfectly elastic
In the given diagram price is measured on vertical axis and quantity demanded and supplied is measured on horizontal axis. Initially, the equilibrium price is OP and equilibrium quantity is OQ. But when "supply becomes perfectly elastic and demand increases then,
(i) Equilibrium price remains constant at OP; and
(ii) Equilibrium quantity rises from OQ to OQ1
33.
| Marks | Number of Students | Cumulative Frequency |
| 20 | 8 | 8 |
| 30 | 12 | 20 |
| 40 | 20 | 40 |
| 50 | 10 | 50 |
| 60 | 6 | 56 |
| 70 | 4 | 60 |
Median = size of \(\frac{N+1}{2}\)
Size of \(\frac{60+1}{2}=30.5\)th observation.
34.
It has been rightly said that a diagram is worth 100 words. It is easier to forget words but it is difficult to forget a diagram once seen. Diagrams have a memorizing effect on human mind. It gives a bird's eye view of the statistical details.
35.
| (i) Perfect Competition: As we know in perfect competition homogeneous goods are produced. So, price remains constant and we are having perfectly elastic demand |
(ii) Monopolistic -Competition As we know, in monopolistic competition close substitutes are produced. So, demand fluctuates more proportionately than the price of the commodity. So, we are having more than unit elastic demand. |
(iii) Monopoly: As we know in monopoly no close substitute are produced. That is why demand fluctuates less proportionately than the price of the commodity. So, we are having less than unitary elastic demand. |
 |
 |
 |
| PED = \(\infty \) Perfectly elastic demand |
PED> 1 More than unitary elastic demand |
PED < 1 Less than elastic demand |
36.
(i) The given statement is correct.
(ii) If MC is falling at the point of equilibrium, it means that it is possible to add to profits by producing more.
(iii) So, MC should be rising at the point of producer's equilibrium.
37.
An increase in the price of jeans will make the production of jeans more attractive. As the result of, firm 'A' will shift its resources from shirts to jeans. It will shift the supply curve of shirts towards left as shown in given figure.
38.
Sometimes, statistics give such results which do not sound sensible as per common sense. In fact, there is no substitute of common sense not statistics as well. For example, suppose a person conducted a survey and found that the places where there were larger numbers of hospitals, death rates were higher. So, he concluded that hospitals are responsible for increasing death rates. Another Example can be situation when you collect data on birth rate and rainfall. You find that the years when there was higher rainfall, birth rate was high and you conclude that rainfall is one of the cause of high birth rate. Therefore, we say that statistics are not substituted for common sense.
39.
| Basis | Economic Activities | Non Economic Activities |
| Meaning | Activities which are undertaken to earn money are called economic activities. | Activities which are undertaken because of love, care, religious factors, emotional reasons hygienic reasons etc are non-economic activities. In other words, all activities other than economic activities are non-economic activities |
| National income | These activities are included in National Income. | These activities are not included in national income. |
| Example | A teacher teaching in a school; A doctor treating a patient; A farmer working in his farm; A lady performing on stage as a paid artist etc. | A student preparing for IAS and being taught by his father; a father dropping his child to school; a person brushing his teeth; a person offering prayers in the morning etc. |
40.
Statistical enquiry refers to an investigation on a topic by any agency or an individual which involves quantitative facts. In other words, statistical enquiry implies search of truth by using statistical tools. All statistical enquiries involve collection of data, their organization, presentation, analysis and interpretation. It is conducted for a predetermined purpose which may of different in different situations. For example, government may conduct a statistical enquiry for formulation of a policy while a businessman may conduct a statistical enquiry to know the response of its customers to a new product.
41.
| Units sold (Q) | AR(Rs) | TR(Rs)=PxQ | MR(Rs)=TRn-TRn-1=MRn |
|---|---|---|---|
| 1 | 25 | 25 | 25 |
| 2 | 23 | 46 | 21 |
| 3 | 21 | 63 | 17 |
| 4 | 19 | 76 | 13 |
| 5 | 18 | 90 | 14 |
| 6 | 15 | 90 | 0 |
42.
(i) Large number of buyers and sellers
(ii) Homogeneous product
(iii) Free entry and exit of firms
(iv) Perfect knowledge about the market
(v) Perfect mobility of factors of production
(vi) Absence of transportation and selling cost
43.
Electricity is a public utility service therefore its increased demand should not be reduced. However, supply cannot be immediately increased due to lack of resources. Therefore, in the given situation, ways should be found to meet the increased demand of the electricity from available supply of the electricity.
Demand for electrical appliances:
1. Use of energy saving electrical appliances.
2. Use of alternative sources of energy like solar energy, wind energy etc.
Value: Environmental Conservation.
44.
| Units of Labour (QL) | Average Product (AP) (Units) | Total Product (TP) (Units) | Marginal Product (MP) (Units) |
| 1 | 8 | 8(AP X QL) | 8\(\left( \frac { \Delta TL }{ \Delta QL } \right) \) |
| 2 | 10 | 20 (AP X QL) | 12 \(\left( \frac { \Delta TL }{ \Delta QL } \right) \) |
| 3 | 10\(\left( \frac { { TP }_{ L } }{ QL } \right) \) | 30 (AP X QL) | 10 |
| 4 | 9 | 36 (AP X QL) | 6\(\left( \frac { { \Delta TP }_{ L } }{ \Delta QL } \right) \) |
| 5 | 8\(\left( \frac { { TP }_{ L } }{ QL } \right) \) | 40 \(\sum\)MP | 4 |
| 6 | 7 | 42 (AP X QL) | 2 \(\left( \frac { { \Delta TP }_{ L } }{ \Delta QL } \right) \) |
45.
| Initial Price (P) = 1 | Initial Expenditure = 80 | Initial DD (Q)\({80\over1}\)=80 |
| New Price (P1) = 2 | New Expenditure = 96 | NewDD (Q1)=\({96\over2}\) =48 |
| \(\triangle P=1\) | \(\triangle Q=-32\) |
\(PED={\triangle Q\over \triangle P}\times{P\over Q}={[-]32\over1}\times {1\over 80}=[-]{4\over10}=[-]0.4\)
Negative Sign of ED indicates the inverse relationship between price and quantity demanded.
PED = 0.4 [Less than unitary elastic demand or inelastic demand]
46.
As we know a consumer purchases a good up to the point where margnial utility of the good becomes equal to the price of that good. MU = Price
(i) It can be explained with the help of the following figures. It can be seen from the given figures that Figure B is derived from Figure A.
(ii) In figure A, initially, consumer equilibrium is attained at point E, where let MU (10) = Price (10). Corresponding to point E, we derive point E, in figure B.
(iii) Due to fall in price (suppose from 10 to 8), MU > Price at the given quantity. So, we can say that benefit is greater than cost and the consumer increases the quantity till MU = Price condition is attained at F. Corresponding to point F, we derive the point F1, in figure B. So, by joining point E. and F1 together, we derive the demand curve.
47.
(i) The subject matter of economics includes microeconomics and macroeconomics.
(ii) Microeconomics, studies the behaviour of individual economic units of an economy like households, firms, individual consumers and producers etc. It does not study the economy as a whole.
(iii) Macroeconomics is the part of economic theory that studies the economy as a whole, such as national income, aggregate employment, general price level, aggregate consumption, aggregate investment, etc.
48.
(d)
All of the above
49.
(a)
125
50.
(c)
Mode
51.
(a)
Grouped frequency distribution
52.
(d)
None of these
53.
(b)
Minus one to plus one
54.
(c)
Both (a) and (b)
55.
(c)
Less than type ogive
56.
(c)
Stubs
57.
(c)
an overall decrease in price and a decrease in equilibrium quantity
58.
(b)
two-dimensional diagram
59.
(a)
Price = Marginal Cost
60.
(b)
monopoly
61.
(c)
People or things about which we are conducting a study or survey
62.
(a)
Not all wants can be satisfied
63.
(c)
Accuracy is important
64.
(a)
place where buyer and seller bargain a product or service for a price
65.
(d)
Amount of the good offered for sale at a particular price per unit of time.
66.
(c)
The change in P x Q due to a one unit change in output.
67.
(d)
average total cost is minimized
68.
(a)
Total product curve
69.
(b)
increase in the price of goods concerned
70.
(b)
1
71.
(d)
Transformation curve
72.
(c)
The satisfaction gained from consuming the good

11th Standard CBSE Syllabus & Materials
11th Standard CBSE
CBSE 11th Business Studies Forms of Business Organisation Sample Question Papers Study Material - QB365 Set A
NEW11th Standard CBSE
CBSE 11th Business Studies Business, Trade and Commerce Sample Question Papers Study Material - QB365 Set A
NEW11th Standard CBSE
CBSE 11th Physics Waves Sample Question Papers Study Material - QB365 Set A
NEW11th Standard CBSE
CBSE 11th Physics Kinetic Theory Sample Question Papers Study Material - QB365 Set A



CBSE 11th Standard CBSE Subjects
CBSE Standards










