
 100% FREE ACCESS
11th Standard CBSE Syllabus & Materials
11th Standard CBSE
CBSE 11th Economics PART-A - Presentation of Data - New Sample Question Papers Study Material - QB365 Set A
NEW11th Standard CBSE
CBSE 11th Economics PART-A - Organisation of Data - New Sample Question Papers Study Material - QB365 Set A
NEW11th Standard CBSE
CBSE 11th Economics PART-A - Collection of Data - New Sample Question Papers Study Material - QB365 Set A
NEW11th Standard CBSE
CBSE 11th Economics PART-A - Introduction to Economics and Statistics - New Sample Question Papers Study Material - QB365 Set A
NEW11th Standard CBSE
CBSE 11th Business Studies International Trade Sample Question Papers Study Material - QB365 Set A
NEW11th Standard CBSE
CBSE 11th Business Studies Evolution and Fundamentals of Business Sample Question Papers Study Material - QB365 Set A

Published on: 03/08/2019
Supply
Download CBSE Class 11th Standard CBSE undefined question papers, sample papers, important questions, and previous year solved papers in PDF format. Get free study materials, NCERT solutions, and exam preparation resources for Class 11th Standard CBSE undefined
Questions + Answers key
Take MCQ Biology Test
1.
As a result of fall in price of the commodity by 10%, the quantity supplied also falls 15%. Comment on PES.
2.
The price elasticity of supply of commodity X and Y are equal. The price of X falls from Rs.10 to Rs.8 per unit and its quantity supplied falls by 16 per cent. The price of Y rises by 10 per cent. Calculate the percentage increase in its supply.
3.
PES of a commodity is 5. A producer sells 500 units of a good at a price of Rs. 5 per unit. How much wil be willing to sell at the price of Rs.6 per unit?
4.
How does an increase in price of an input affect the supply curve of a firm?
5.
What causes a downward movement along a supply curve?
6.
What causes a movement along the supply curve of a good?
7.
State the law of supply.
8.
What is the shape of a supply curve?
9.
What effect does an decrease in input price has on the supply of the commodity?
10.
If the quantity supplied is exactly equal to the relative change in price then the elasticity of supply is
less than one
greater than one
one
none of them
11.
Elasticity of supply is measured by dividing the percentage change in quantity supplied of a good by ____________
percentage change in income
percentage change in quantity demanded of good
percentage change in price
percentage change in taste and preference
12.
The quantity supplied of a piece of goods or service is the amount that
is actually bought during a given time period at a given price
producers wish that they could sell that at a higher price
producers plan to sell during a given time period at a given price.
people are willing to buy during a given time period at a given price
13.
An increase in the supply of a good is caused by:
Improvements in its technology
Fall in the prices of other goods
Fall in the prices of factors of production.
All of them.
14.
A vertical supply curve parallel to Y-axis implies that the elasticity of supply is:
Zero
Infinity
Equal to one
Greater than zero but less than infinity.
15.
If there is an improvement in technology of producing a good,supply decreases
16.
When government imposes more unit tax, supply of the concerned good increases?
17.
When price of factor input falls, supply curve shifts rightward.
18.
Ceteris paribus, if price rises, quantity supply of goods will fall
19.
If there is increase in quantity supplied, supply curve shifts rightwards?
20.
Distinguish between change in quantity supplied and change in supply. Use diagram.
1.
\(ES={{Percentage\ change\ in\ quantity\ supplied}\over{Percentage\ change\ in\ price}}\)
\(={{15\%}\over{10\%}}=1.5\)
PES = 1.5 [More than unitary Elastic or elastic Supply]
2.
PES of X is equal to the PES of Y.
| Commodity X | |
|---|---|
| Initial Price (P)=Rs.10 | Percentage fall in quantity supplied =16% |
| New Price (P1)= Rs.8 | \(\triangle \)P = 2 |
Percentage change in price = \(\frac { \triangle P }{ P } \times 100=\frac { 2 }{ 10 } \times 100=20\%\)
\(PES=\frac { Percentage\ change\ in\ quantity\ supplied }{ Percentage\ change\ in\ price } =\frac { 16\% }{ 20\% } =0.8\)
As, PES of X = PES of Y [given]. [So, PES of Y = 0.8]
Commodity Y; PES = 0.8
| Percentage change in Price =10% | Percentage change in quantity supplied = ? |
\(PES=\frac { percentage\ in\ quantity\ supplied }{ Percentage\ change\ in\ price } \)
\(0.8=\frac { quantity\ change\ in\ quantity\ supplied }{ 20\% } \)
As, price is increasing by 10% then quantity supplied also increases by 8% as per law of supply.
[So, Percentage change in quantity supplied of commodity Y = 8%]
3.
| ES=5 | |
| Initial price(P)=Rs.5 | Initial Quantity(Q)=500 |
| New Price(P1)=Rs.6 | New Quantity(Q1)=? |
| \(\triangle \)P=1 | \(\triangle \)Q=? |
PES=\(\frac { \triangle Q }{ \triangle P } \times \frac { P }{ Q } \)
\(5=\frac { \triangle Q }{ 1 } \times \frac { 5 }{ 500 } \)
\(\triangle Q=\frac { 2500 }{ 5 } =500\)
As price increases, quantity supplied must also increses as per law of supply
New Quantity=Initial Quantity+\(\triangle \)Q=500+500=1000
4.
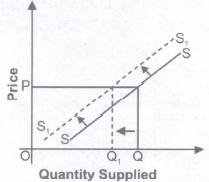
(i) This also influences the supply since price of inputs (rent, wages, interest, profit) constitutes the cost of production of a commodity.
(ii) An increase in the price of an input may lead to rise in cost of production, which will thereby decrease the production of a commodity shifting the supply curve to the left as shown.
5.
()
Fall in price and fall in quantity supplied, i.e., contraction in supply.
6.
()
Change (increase or decrease) in price causes a movement along the supply curve.
7.
()
It states that price of the commodity and quantity supplied are positively related to each other when other factors remain constant (ceteris paribus).
8.
()
Supply curve is a positively shaped upward sloping curve.
9.
()
Supply will increase
10.
(c)
one
11.
(c)
percentage change in price
12.
(c)
producers plan to sell during a given time period at a given price.
13.
(d)
All of them.
14.
(a)
Zero
15.
(b)
16.
(b)
17.
(a)
18.
(b)
19.
(b)
20.
| Changes in quantity supplied | Basis | Change in supply | ||||||||||||||||||||||||
|---|---|---|---|---|---|---|---|---|---|---|---|---|---|---|---|---|---|---|---|---|---|---|---|---|---|---|
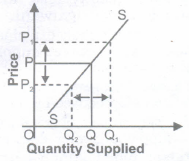
| The change in quantity supplied due to the change in price of the commodity. | Meaning | Change in supply due to the change in factors other than price | ||||||||||||||||||||||||
| Movement along the supply curve (i) Expansion in supply (ii) Contraction in supply |
Alternative Name |
Shift in supply curve |
||||||||||||||||||||||||
| (i) It states that rise in quantity supplied due to the rise in price of the commodity (ii) It states that fall in quantity supplied due to the fall in price of the commodity |
Meaning | (i) An increase in supply means that producers now supply more at a given price level (ii) A decrease in supply means that producers now supply less at a given price level |
||||||||||||||||||||||||
|
Schedule |
|
||||||||||||||||||||||||
 |
Diagrams | 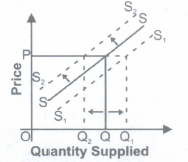 |
||||||||||||||||||||||||

11th Standard CBSE Syllabus & Materials
11th Standard CBSE
CBSE 11th Business Studies Forms of Business Organisation Sample Question Papers Study Material - QB365 Set A
NEW11th Standard CBSE
CBSE 11th Business Studies Business, Trade and Commerce Sample Question Papers Study Material - QB365 Set A
NEW11th Standard CBSE
CBSE 11th Physics Waves Sample Question Papers Study Material - QB365 Set A
NEW11th Standard CBSE
CBSE 11th Physics Kinetic Theory Sample Question Papers Study Material - QB365 Set A



CBSE 11th Standard CBSE Subjects
CBSE Standards










