
 100% FREE ACCESS
11th Standard CBSE Syllabus & Materials
11th Standard CBSE
CBSE 11th Economics PART-A - Presentation of Data - New Sample Question Papers Study Material - QB365 Set A
NEW11th Standard CBSE
CBSE 11th Economics PART-A - Organisation of Data - New Sample Question Papers Study Material - QB365 Set A
NEW11th Standard CBSE
CBSE 11th Economics PART-A - Collection of Data - New Sample Question Papers Study Material - QB365 Set A
NEW11th Standard CBSE
CBSE 11th Economics PART-A - Introduction to Economics and Statistics - New Sample Question Papers Study Material - QB365 Set A
NEW11th Standard CBSE
CBSE 11th Business Studies International Trade Sample Question Papers Study Material - QB365 Set A
NEW11th Standard CBSE
CBSE 11th Business Studies Evolution and Fundamentals of Business Sample Question Papers Study Material - QB365 Set A

Published on: 05/09/2019
Supply
Download CBSE Class 11th Standard CBSE undefined question papers, sample papers, important questions, and previous year solved papers in PDF format. Get free study materials, NCERT solutions, and exam preparation resources for Class 11th Standard CBSE undefined
Questions + Answers key
Take MCQ Biology Test
1.
A firm earns a revenue of Rs.50 when the market price of a good is Rs.10. The market price increases to Rs.15 and the firm now earns a revenue of Rs.150. What is the price elasticity of the firm's supply curve?
2.
The market price of a good changes from Rs.5 to Rs.20. As a result, the quantity supplied by a firm increases by 15 units. The price elasticity of the firm's supply curve is 0.5. Find the initial and final output levels of the firm.
3.
At the market price of Rs.10, a firm supplies 4 units of output. The market price increases to Rs.30. The price elasticity of the firm's supply is 1.25. What quantity will the firm supply at the new price?
4.
What is the supply curve of a firm in the Long run?
5.
What is the supply curve of a firm in the short run?
6.
What does the price elasticity of supply mean? How do we measure it?
7.
How does an increase in the number of firms in a market affect the market supply curve?
8.
How does an increase in price of an input affect the supply curve of a firm?
9.
How does the imposition of a unit tax affect the supply curve of a firm?
10.
How does technological progress affect the supply curve of a firm?
11.
There are three identical firms in a market. The following table shows the supply schedule of firm 1. Compute the market supply schedule.
| Price (Rs) | SS1(Units) |
|---|---|
| 0 | 0 |
| 1 | 0 |
| 2 | 2 |
| 3 | 4 |
| 4 | 6 |
| 5 | 8 |
| 6 | 10 |
| 7 | 12 |
| 8 | 14 |
12.
Consider a market with two firms. In the following table, columns labelled as SS1 and SS2 give the supply schedules of firm 1 and firm 2 respectively. Compute the market supply schedule.
| Price (Rs) | SS1(Kg) | SS2 (Kg) |
|---|---|---|
| 0 | 0 | 0 |
| 1 | 0 | 0 |
| 2 | 0 | 0 |
| 3 | 1 | 0 |
| 4 | 2 | 0.5 |
| 5 | 3 | 1 |
| 6 | 4 | 1.5 |
| 7 | 5 | 2 |
| 8 | 6 | 2.5 |
13.
Consider a market with two firms. The following table shows the supply schedules of two firms: the SS1 column gives supply schedule of firm 1 and SS2 column gives supply schedule of firm 2. Compute the market supply schedule.
| Price (Rs) | SS1(in Units) | SS2 (in Units) |
|---|---|---|
| 0 | 0 | 0 |
| 1 | 0 | 0 |
| 2 | 0 | 0 |
| 3 | 1 | 1 |
| 4 | 2 | 2 |
| 5 | 3 | 3 |
| 6 | 4 | 4 |
1.
| Price(Rs) | Total Receipts(Rs) | Quantity in units (Total Receipts+price) |
|---|---|---|
| 10 | 50 | 5 |
| 15 | 150 | 10 |
| Original Quantity (Q)= 5 units | OriginalPrice(P)=Rs.10 |
| NewQuantity (Q1)=10 units | NewPrice (P1)=Rs.15 |
| Change in Quantity (\(\triangle Q\))=5 units | Change in Price(\(\triangle P\))=Rs.5 |
| Elasticity of supply (ES)=? | |
Price Elasticity
of Supply (ES)=\(\frac { \triangle Q }{ \triangle P } \times \frac { P }{ Q } =\frac { 5 }{ 5 } \times \frac { 10 }{ 5 } =2\)
ES=2 (supply is highly elastic as ES>1)
ES is always positive due to direct relationship between price and quantity supplied.
2.
| Initial Output (Q)=? | OriginalPrice(P)=Rs.5 |
| Final Output (Q1) =? | NewPrice (P1)=Rs.20 |
| Change in Quantity(\(\triangle \)Q)=15 | Change in Price(\(\triangle \)P)=Rs.15 |
| Elasticity of supply(ES)=0.5 | |
Price Elasticity of supply(ES) =\(\frac { \triangle Q }{ \triangle P } \times \frac { P }{ Q } \)
0.5=\(\frac { 15 }{ 15 } \times \frac { 5 }{ Q } \) ,i.e.,Q = 10
As price increases, then quantity supplied also increases. It means,
Final Output = Initial Output (Q) + Change in Quantity (\(\triangle Q\)) = 10 + 15 = 25 units
3.
| Original Quantity(Q)=4 units | Original Price(P)=Rs.10 |
| New Quantity(Q1)=? | Rise in price(\(\triangle \)P)=Rs.20 |
| Change in Quantity(\(\triangle \)Q)=? | New Price (P1)=Rs.30 |
| Elasticity of supply (ES)=1.25 | |
Price Elasticity of Supply (ES)=\(\frac { \triangle Q }{ \triangle P } \times \frac { P }{ Q } \)
\(1.25={{\triangle Q}\over{20}}\times{10\over4}\)
As price increases, then quantity supplied also increases. It means, New Quantity = Original Quantity (Q)+ Change in Quantity
(\(\triangle \)Q) = 4 + 10
= 14 units
New Quantity = 14 units.
4.
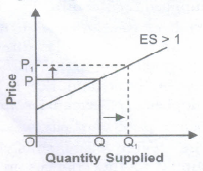
(i) In the long period, supply is more elastic as all the factors can be changed and supply can be easily adjusted as per changes in price.
(ii) The supply curve during long period is elastic, i.e. percentage change in quantity supplied is greater than percentage change in price as shown below:
5.
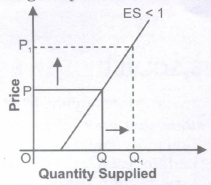
(i) In the short period, supply is relatively less elastic as firm can change the supply by changing the variable factors only, as fixed factors remain fixed during short period.
(ii) The supply curve during short period is inelastic, i.e., percentage change in quantity supplied is less than percentage change in price as shown below:
6.
(i) The degree of responsiveness of quantity supplied to the changes in price of the commodity is known as price elasticity of supply.
(ii) Percentage Method: To measure price elasticity of supply, we use percentage method. According to this method, elasticity is measured as the ratio of percentage change in the quantity supplied to percentage change in the price. Price elasticity of supply (ES)
\(=\frac { Percentage\ change\ in\ quantity\ supplied }{ Percentage\ change\ in\ price } \)
Where,
Percentage change in quantity supplied
\(=\frac { change\ in\ quantity\ supplied(\triangle Q) }{ Initial\ Quantity\ Supplied(Q) } \)X100
Change in Quantity \((\triangle Q)\)
=New Quantity(Q1)-Initial Quantity(Q)
Percentage change in price
\(=\frac { change\ in\ Price(\triangle P) }{ Initial\ Price(P) } \times 100\)
Change in price \((\triangle P)\)=New price (P1)-Initial Price (P)
Proportionate Method:
The percentage method can also be converted into the proportionate method. Putting the values of 1, 2, 3 and 4 in the formula of percentage method, we get,
\(ES=\frac { \frac { \triangle Q }{ Q } \times 100 }{ \frac { \triangle P }{ P } \times 100 } =\frac { \frac { \triangle Q }{ Q } }{ \frac { \triangle P }{ P } } \)
Elasticity of Supply (Proportionate Method)=\(\frac { \triangle Q }{ \triangle P } \times \frac { P }{ Q } \)
Where, Q = Initial Quantity Supplied
\(\triangle \)Q = Change in Quantity Supplied
P = Initial Price
\(\triangle \)P = Change in Price
7.
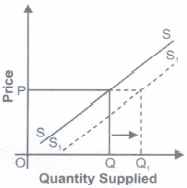
(i) When the number of firms in the industry increases, market supply also increases due to large number of producers producing that commodity.
(ii) So, due to increase in market supply, the supply curve shifts rightward as shown.
8.
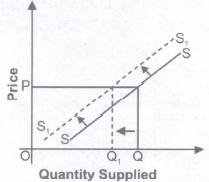
(i) This also influences the supply since price of inputs (rent, wages, interest, profit) constitutes the cost of production of a commodity.
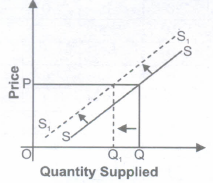
(ii) An increase in the price of an input may lead to rise in cost of production, which will thereby decrease the production of a commodity shifting the supply curve to the left as shown.
9.
(i) A unit tax is a tax that the government imposes per unit sale of output.
(ii) For example, suppose that the unit tax imposed by the government is Rs.3. Then, if the firm produces and sells 20 units of the goods, the total tax that the firm must pay to the government is
20 x 3 = 60.
(iii) So, if the unit tax increases, the firm's cost of production increases which will shift the supply curve leftward.
10.
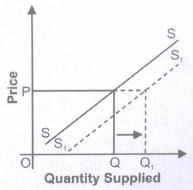
When there is technological progress in the firm, then cost of production will decrease, which leads to increase in the profit margin of the firm and thereby shifts the supply curve rightward as shown.
11.
| Price (Rs) | SS1(in Units) | SS2 (in Units) | SS3 (Units) | Market Supply (SS1 + SS2 + SS3) |
|---|---|---|---|---|
| 0 | 0 | 0 | 0 | 0 |
| 1 | 0 | 0 | 0 | 0 |
| 2 | 2 | 2 | 2 | 6 |
| 3 | 4 | 4 | 4 | 12 |
| 4 | 6 | 6 | 6 | 18 |
| 5 | 8 | 8 | 8 | 24 |
| 6 | 10 | 10 | 10 | 30 |
| 7 | 12 | 12 | 12 | 36 |
| 8 | 14 | 14 | 14 | 42 |
Note: As the three firms are identical, supply of the second firm (SS2) and the third firm (SS3) will be equal to the supply of first firm (SS1).
12.
| Price (Rs) | SS1(Kg) | SS2 (Kg) | Market supply (SS1+SS2) |
|---|---|---|---|
| 0 | 0 | 0 | 0 |
| 1 | 0 | 0 | 0 |
| 2 | 0 | 0 | 0 |
| 3 | 1 | 0 | 1 |
| 4 | 2 | 0.5 | 2.5 |
| 5 | 3 | 1 | 4 |
| 6 | 4 | 1.5 | 5.5 |
| 7 | 5 | 2 | 7 |
| 8 | 6 | 2.5 | 8.5 |
13.
| Price (Rs) | SS1(in Units) | SS2 (in Units) | Market Supply (SS1 +SS2) |
|---|---|---|---|
| 0 | 0 | 0 | 0 |
| 1 | 0 | 0 | 0 |
| 2 | 0 | 0 | 0 |
| 3 | 1 | 1 | 2 |
| 4 | 2 | 2 | 4 |
| 5 | 3 | 3 | 6 |
| 6 | 4 | 4 | 8 |

11th Standard CBSE Syllabus & Materials
11th Standard CBSE
CBSE 11th Business Studies Forms of Business Organisation Sample Question Papers Study Material - QB365 Set A
NEW11th Standard CBSE
CBSE 11th Business Studies Business, Trade and Commerce Sample Question Papers Study Material - QB365 Set A
NEW11th Standard CBSE
CBSE 11th Physics Waves Sample Question Papers Study Material - QB365 Set A
NEW11th Standard CBSE
CBSE 11th Physics Kinetic Theory Sample Question Papers Study Material - QB365 Set A



CBSE 11th Standard CBSE Subjects
CBSE Standards










