
 100% FREE ACCESS
11th Standard CBSE Syllabus & Materials
11th Standard CBSE
CBSE 11th Economics PART-A - Presentation of Data - New Sample Question Papers Study Material - QB365 Set A
NEW11th Standard CBSE
CBSE 11th Economics PART-A - Organisation of Data - New Sample Question Papers Study Material - QB365 Set A
NEW11th Standard CBSE
CBSE 11th Economics PART-A - Collection of Data - New Sample Question Papers Study Material - QB365 Set A
NEW11th Standard CBSE
CBSE 11th Economics PART-A - Introduction to Economics and Statistics - New Sample Question Papers Study Material - QB365 Set A
NEW11th Standard CBSE
CBSE 11th Business Studies International Trade Sample Question Papers Study Material - QB365 Set A
NEW11th Standard CBSE
CBSE 11th Business Studies Evolution and Fundamentals of Business Sample Question Papers Study Material - QB365 Set A

Published on: 05/03/2020
11th Standard Economics Board Exam Sample Question 2020
Download CBSE Class 11th Standard CBSE undefined question papers, sample papers, important questions, and previous year solved papers in PDF format. Get free study materials, NCERT solutions, and exam preparation resources for Class 11th Standard CBSE undefined
Questions + Answers key
Take MCQ Biology Test
1.
With the help of a suitable diagram, explain the process of determination of equilibrium price of a commodity under perfectly competitive market.
2.
Which values are of utmost importance in making of a project?
3.
Explain the concept and uses of index numbers.
4.
From the data given below, find Mean Deviation and coefficient of MD. from median.
| Marks obtained | No. of students |
| Less than 10 | 3 |
| Less than 20 | 5 |
| Less than 30 | 10 |
| Less than 40 | 18 |
| Less than 50 | 25 |
| Less than 60 | 30 |
| Marks obtained (class interval) |
No of students | cumulative Frequency | Mid Value | |M-Median| | (F|M-Median|) |
| 0-10 | 3=3-0 | 3 | 5 | 31.25 | 93.75 |
| 10-20 | 2=5-3 | 5 | 15 | 21.25 | 42.50 |
| 20-30 | 5=10-5 | 10 | 25 | 11.25 | 56.25 |
| 30-40 | 8=18-10 | 18 | 35 | 1.25 | 10.00 |
| 40-50 | 7=25-18 | 25 | 45 | 8.25 | 57.75 |
| 50-60 | 5=30-25 | 30 | 55 | 18.75 | 93.75 |
| Total | \(\sum\)F=30 | \(\sum\)(F|M-Median|)=354 |
5.
Arithmetic mean is most commonly used measure of central tendency. Why?
6.
Given below are height and weight of 20 students of a class. You are required to make a continuous bivariate frequency distribution from it.
| Weight: | 170 | 163 | 139 | 122 | 134 | 140 | 132 | 120 | 148 | 129 | 152 | 135 |
| 136 | 137 | 148 | 124 | 117 | 128 | 143 | 129 | |||||
| Height: | 70 | 67 | 63 | 68 | 67 | 69 | 66 | 68 | 67 | 67 | 70 | 65 |
| 65 | 64 | 69 | 63 | 65 | 70 | 71 | 62 |
7.
Draw a scatter diagram for:
(I) Perfect positive correlation
(ii) Perfect negative correlation
(iii) Zero correlation
(iv) Low positive correlation
(v) low negative correlation
(vi) High positive correlation
8.
What are the functions of a graph?
9.
What are different types of tables?
Explain with examples.
10.
What guidelines will you keep in mind while constructing a diagram?
11.
Find the median in the set of numbers given below:
62, 68, 53, 57, 20, 30, 32, 45, 72, 77, 81
12.
Compare between monopoly and monopolistic competition.
13.
Explain why will a producer not be in equilibrium if the conditions of equilibrium are not met.
14.
What is secondary data? Explain different sources of secondary data.
15.
Distinguish between change in quantity supplied and change in supply. Use diagram.
16.
Describe the features of statistics in plural sense.
17.
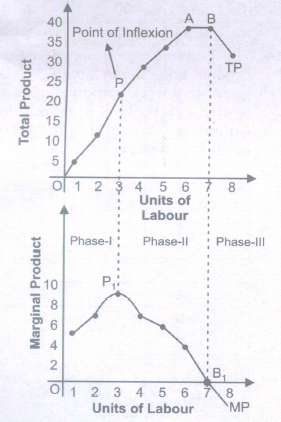
What are the different phases in the Law of Variable Proportions in terms of marginal product? Give reason behind each phase. Use diagram.
18.
Differentiate between Economics as a positive and as a normative Science.
19.
'Supply curve is the rising portion of marginal cost curve over and above the minimum of Average Variable cost curve'. Do you agree? Support your answer with valid reason.
20.
The total fixed cost of a firm is Rs.12. Given below is its marginal cost schedule. Calculate total cost and average variable cost for each given level of output.
| Output | 1 | 2 | 3 | 4 | 5 | 6 |
|---|---|---|---|---|---|---|
| Marginal Cost(Rs.) | 9 | 7 | 2 | 4 | 8 | 12 |
21.
From the schedule provided below calculate the total revenue, demand curve and the price elasticity of demand:
| Quantity | 1 | 2 | 3 | 4 | 5 | 6 | 7 | 8 | 9 |
| Marginal Revenue | 10 | 6 | 2 | 2 | 2 | 0 | 0 | 0 | -5 |
22.
There is given the price of a good, how does a consumer decide as to how much quantity of that goods to buy?
23.
Explain the effect of the following on demand for a good:
(i) Rise in Income for Normal Goods.
(it) Rise in Income for Inferior Goods.
24.
Discuss the central problems of an economy
25.
What is a first step of a project?
Identification of problem
Statement of the problem
Objectives
Analysis of data
26.
If with the rise of 10% in prices the wages are increased by 20%, the real wage increase by _________%.
20
10
30
2
27.
Which of the following is not as measure of central tendency?
Mode
Mean
Median
Range
28.
The number of observations falling within a class is called:
Density
Frequency
Both (a) and (b)
None of these
29.
The Arithmetic Mean of 1,3,5,6,M,10 is 6.the value of M is:
10
11
12
5
30.
The lowest strength of association is reflected by which of the following correlation coefficients?
0.95
-0.60
- 0.35
0.29
31.
If all the observations of a series are multiplied by 5 then
S.D. of a series would be decreased by 5
S.D. of a series would be half of the previous S.D.
S.D. of a series would be increased by 5
S.D. of a series would be also multiplied by5.
32.
To find the number of observations less than any given value, we use:
Grouped frequency distribution
Single frequency distribution
Cumulative frequency distribution
None of these
33.
____________________tables are also called reference tables.
General Purpose Table
Special Purpose Table
Original table
Derivative table
34.
Assume that consumers' incomes and the number of sellers in the market for goods A both decrease. Based upon this information, we can conclude, with certainty, that the equilibrium
price will increase
price will decrease.
quantity will increase
quantity will decrease.
35.
Bar diagram is a:
One-dimensional diagram
two-dimensional diagram
Diagram with no dimension
none of the above
36.
What is the relation between price and marginal cost at equilibrium, when price remains constant with the rise in output.
Price = Marginal Cost
Price> Marginal Cost
Price < Marginal cost
None of these
37.
Average revenue and price are always equal under:
perfect competition only
Monopolistic competition only
monopoly only
all market forms
38.
Which of the following is not a stage in statistical study?
Organization of Data
Presentation of Data
Publication of Dat
Interpretation of data
39.
The law of scarcity:
does not apply to rich, developed countries
implies that consumer's wants will never be completely satisfied
applies only to the less developed countries
implies that consumer's wants will be satisfied in a socialistic system
40.
Which method of collection of data covers the widest area?
Direct personal investigation
Mailed questionnaire method
Telephone interview method
All of these
41.
For a price-taking firm
marginal revenue is less than price
marginal revenue is equal to price
marginal revenue is greater than price
the relationship between marginal revenue and price is indeterminate
42.
The quantity supplied of a piece of goods or service is the amount that
is actually bought during a given time period at a given price
producers wish that they could sell that at a higher price
producers plan to sell during a given time period at a given price.
people are willing to buy during a given time period at a given price
43.
Total revenue =
Price x quantity
Price x income
Income x quantity
None of these.
44.
Total cost in the short run is classified into fixed costs and variable costs. Which one of the following is a variable cost?
Cost of raw materials.
Cost of equipment.
Interest payment on past borrowings.
Payment of rent on building.
45.
The short run, as economists use the phrase, is characterized by:
At least one fixed factor of production and firms neither leaving nor entering the industry.
A period where the law of diminishing returns does not hold.
No variable inputs-that is all the factors of production are fixed.
All inputs being variable.
46.
In case of Giffen goods, the demand curve will be:
horizontal.
downward-sloping to the right.
vertical.
upward-sloping to the right.
47.
In case of a straight line demand curve meeting the two axes, the price elasticity of demand at the midpoint of the line would be:
0
1
1.5
2
48.
Scarcity is a situation in which
wants exceed the resources available to satisfy them
something is being wasted
people are poor
none of them
49.
The consumer is in equilibrium at a point where the budget line___________.
Is above an indifference curve
Is below an indifference curve
Is tangent to an indifference curve
Cuts an indifference curve
50.
What decisions must be taken prior to data collection
51.
Explain simple average of relatives for the construction of index numbers. Explain its merits and demerits
52.
Find Lower and upper quartile from the data given below:
21, 54, 65, 23, 32, 43, 45, 67, 75
53.
Use the data given below that relate to monthly household expenditure (in Rs) on food of 50 households and answer the questions.
| 1904 | 1559 | 3473 | 1735 | 2760 | 2041 |
| 1612 | 1753 | 1855 | 4439 | 5090 | 1085 |
| 1823 | 2346 | 1523 | 1211 | 1360 | 1110 |
| 2152 | 1183 | 1218 | 1315 | 1105 | 2628 |
| 2712 | 4248 | 1812 | 1264 | 1183 | 1171 |
| 1007 | 1180 | 1953 | 1137 | 2048 | 2025 |
| 1583 | 1324 | 2621 | 3676 | 1397 | 1832 |
| 1962 | 2177 | 2575 | 1293 | 1365 | 1146 |
| 3222 | 1396 |
(i) Obtain the range of monthly household expenditure on food.
(ii) Divide the range into appropriate number of class intervals and obtain the frequency distribution of expenditure.
(iii) Find the number of households whose monthly expenditure on food is:
54.
Mention the various cases in which equilibrium price remains same.
55.
Differentiate between correlation and causation.
56.
What are time series graph? What are its other names?
57.
What are the main objectives of tabulation?
58.
Explain the 'free entry and exit of firms' feature of monopolistic competion.
59.
Find out the maximum profit position of a producer by comparing his MC and MR on the basis of the following data:
| Output (in units) | MR(Rs) | MC(Rs) |
|---|---|---|
| 1 | 10 | 4 |
| 2 | 9 | 5 |
| 3 | 8 | 6 |
| 4 | 7 | 7 |
| 5 | 5 | 9 |
| 6 | 2 | 12 |
60.
Draw a simple bar diagram.
61.
Statistics are not a substitute to common sense. Explain this statement with examples.
62.
How do scarcity and choice go together?
63.
The demand for goods X and Y have equal price elasticity. The demand of good X rises from 100 units to 250 units due to a 20 percent fall in its price. Calculate the percentage rise in demand of Y if its price falls by 8 percent.
64.
A perfectly competitive firm faces market price equal to Rs.15.
(i) Derive its total revenue schedule for the range of output from a to 10 units.
(ii) Suppose the market price increases to 17. Will the new TR curve be flatter or steeper?
65.
What change in total revenue will result in (i) a decrease in marginal revenue, and (ii) an increase in marginal revenue?
66.
Which of the following errors is more serious and why?
(a) Sampling errors
(b) Non Sampling errors
67.
A firm fixed average cost of producing 2 units of a good is Rs. 9 and its total cost schedule is given below. Calculate average variable cost and marginal cost for each of given level of output.
| Output (Units) | 1 | 2 | 3 |
|---|---|---|---|
| Total cost(Rs.) | 23 | 27 | 30 |
68.
Under what conditions, a producer would like to supply less at a given price?
69.
Explain the relationship between Total Product and Average Product.
70.
A lot of people died and many factories were destroyed in an earthquake. How will it affect the PPC of the economy?
71.
Explain with diagram, the relationship between TU and MU.
72.
Consider a market where there are just two consumers and suppose their demands for the good are given as follows:
| P | d1 | d2 |
|---|---|---|
| 1 | 9 | 24 |
| 2 | 8 | 20 |
| 3 | 7 | 18 |
| 4 | 6 | 16 |
| 5 | 5 | 14 |
| 6 | 4 | 12 |
Calculate the market demand for the good.
1.
(i) Market equilibrium refers to that point which has come to be established under a given condition of demand and supply and has a tendency to stick to that level, i.e. where Demand = Supply.
(ii) If due to some disturbance we divert from our position the economic forces will work in such a manner that it could be driven back to its original position, i.e., where Demand = Supply. In short it is the position of rest.
(iii) It can be explained with the help of following schedule and diagram:
(a) (i) In the below schedule market equilibrium is determined at Price 3 where Market demand is equal to Market Supply.
(ii) At price 1 and 2, there is excess demand, which leads to rise in price, resulting tendency is expansion in supply.
(iii) Similarly, at price 4 and 5, there is excess supply, which leads to fall in price, resulting tendency is Contraction in supply.
| Price(Rs) | Demand(Units) | Supply(Units) | Surplus(+)or shortage(-) | Resulting Tendency |
| 1 | 5 | 1 | (-)4 | Expansion |
| 2 | 4 | 2 | (-)2 | Expansion |
| 3 | 3 | 3 | 0 | Market Equilibrium |
| 4 | 2 | 4 | (+)2 | Contraction |
| 5 | 1 | 5 | (+)4 | Contraction |
(b) (i) In the given diagram, price is measured on vertical axis, whereas quantity demanded and supply is measured on horizontal axis.
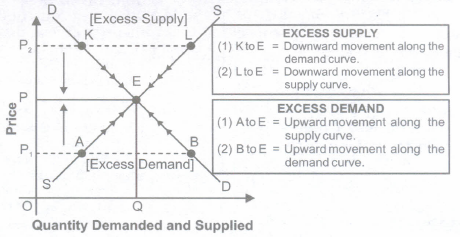
(ii) Suppose that initially the price in the market is P1. At this price, the consumer demand P1B and the producer supply P1 A, i.e. consumers want more than what the producer are willing to supply. There is excess demand equal to AB. So, price cannot stay on P1 as excess demand will create competition among the buyers and push the price up till we reach equilibrium.
Due torise in price from P1 to P, there is upward movement along the supply curve (expansion in supply) from A to E and upward movement along the demand curve (contraction in demand) from B to E.
(iii) Similarly, at price P2, the quantity demanded P2K is less than the quantity supplied P2L. There is excess supply, equal to KL, which will create competition among the sellers and lower the price. The price will keep falling as long as there is an excess supply.
Due to fall in price from P2 to P there is downward movement along the supply curve (contraction in supply) from L to E and downward movement along the demand curve (expansion in demand) from K to E.
(iv) The situation of zero excess demand and zero excess supply defines market equilibrium (E). Alternatively, it is defined by the equality between quantity demanded and quantity supplied. The price P is called equilibrium price and quantity Q is called equilibrium quantity.
2.
(a) Originality: Project must not be copied but an original work of investigator.
(b) Sample Selection: Sample must be randomly selected. There must not be any bias in selection of the sample else the entire motto of preparing project will defeat.
(c) Decision Making: Many decisions are required to be taken in making of a project. Therefore, decision making is another important value.
(d) Communication Skills: In order to get information from people, one needs to be tactful. It calls for good communication skills.
3.
'Index numbers are devices for measuring differences in the magnitude of a group of related variables.- Croxton & Cowden Index numbers are indispensable tools of economics and business analysis. Following are the main uses of index numbers.
1. Index numbers helps in formulating suitable economic policies and planning: Many of the economic and business policies are guided by index numbers. For example while deciding the increase of DA of the employees; the employer's have to depend primarily on the cost of living index. If salaries or wages are not increased according to the cost of living it leads to strikes, lock outs etc. The index numbers provide some guide lines that one can use in making decisions.
2. They are used in studying trends and tendencies: Since index numbers are most widely used for measuring changes over a period of time, the time series so formed enable us to study the general trend of the phenomenon under study. For example for last 8 to 10 years we can say that imports are showing upward tendency.
3. Useful to Business Community: Businessmen need to know the trends in the market to take decisions about wage rates, prices of the product, prices of raw materials etc. Therefore, index numbers are very useful for them.
4. Information Regarding Foreign Trade: Index of Exports and Imports provides relevant information regarding foreign trade and accordingly government can formulate its export-import policy, business men who are engaged in foreign trade can take their decisions and one can predict changes in inflow or outflow of foreign exchange.
5. They are useful in forecasting future economic activity: Index numbers are used not only in studying the past and present workings of our economy but also important in forecasting future economic activity. Index numbers measure the purchasing power of money.
6. The cost of living index numbers determine whether the real wages are rising or falling or remain constant: The real wages can be obtained by dividing the money wages by the corresponding price index and multiplied by 100. Real wages helps us in determining the purchasing power of money. Index numbers are used in deflating. Index numbers are highly useful in deflating i.e. they are used to adjust the wages for cost of living changes and thus transform nominal wages into real wages, nominal income to real income, nominal sales to real sales etc. through appropriate index numbers.
7. Used in Deflating: Deflating means correcting or adjusting a value which has inflated. It makes allowances for the effect of price changes. When prices rise, the purchasing power of money declines. If the money incomes of people remain constant between two periods and prices of commodities are doubled the purchasing power of money is reduced to half. For example if there is an increase in the price of rice from Rs.10/ kg in the year 1980to Rs.20/kg in the year 1982. then a person can buy only half kilo of rice with Rs.10. so the purchasing power of a rupee is only 50 paise in 1982 as compared to 1980.
Thus the purchasing power of money|
\(\frac{1}{price index}\)
In times of rising prices the money wages should be deflated by the price index to get the figure of real wages. The real wages alone tells whether a wage earner is in better position or in worst position.
For calculating real wage, the money wages or income is divided by the corresponding price index and multiplied by 100.
i.e \(\frac{Money wages}{price index}\times100\)
Thus Real wage index
=\(\frac{real wage of current year}{Real wage of base year}\times100\)
4.
Median = size of \(\frac { N }{ 2 } \)Item
Median = size of \(\frac { 30 }{ 2 } \)=15 item 15thitem lies in 30-40
We can find median by using the formula equal to
Median = l1+\(\frac { \left( N/2-C \right) }{ f } \)(i)
Where l1=30; f=8; \(\frac{N}{2}\)=15; C=10; i=10
l1=30+\(\frac { \left( 15-10 \right) }{ 8 } \)(10)=36.25
M.D. From Mean =\(\frac { \sum { F } |X-Median| }{ \sum { F } } \)
Coefficient of M.D. from Mean =\(\frac { M.D.fromMean }{ Mean } \)=\(\frac { 11.8 }{ 36.25 } \)=0.325
5.
Arithmetic mean is most commonly used measure of central tendency because:
(a) It is very simple to understand and easy to calculate.
(b) The calculation of A.M is based on all the observations in the series.
(c) The A.M is responsible for further algebraic treatment.
(d) It is strictly defined.
(e) It provides a good means of comparison.
(f) It has more sampling stability
6.
| Height (Inches) | Weight (in lbs) | ||||||
| 115-125 | 125-135 | 135-145 | 145-155 | 155-165 | 165-175 | Total (f) | |
| 62-64 | 11(2) | 1(1) | - | - | - | - | 3 |
| 64-66 | 1(1) | - | 111(3) | - | - | - | 4 |
| 66-68 | 1(1) | 1(1) | 11(2) | 1(1) | - | - | 5 |
| 68-70 | - | 11(2) | - | 11(2) | - | - | 4 |
| 70-72 | - | 1(1) | 1(1) | - | 1(1) | 1(1) | 4 |
| Total (f) | 4 | 5 | 6 | 3 | 1 | 1 | 20 |
7.
.png)
.png)
.png)
8.
According to King, "One of the chief aims of statistical science is to render the meaning of masses of figures clear and comprehensible at a glance." This is often best accomplished by presenting the data in a pictorial (or graphical) form.
The shape of the graph gives an exact idea of the variations of the distribution trends. Graphic presentation, therefore, serves as an easy technique for quick and effective comparison between two or more frequency distributions. When the graph of one frequency distribution is superimposed on the other, the points of contrast regarding the type of distribution and the pattern of variation become quite obvious. All these advantages necessitate a clear understanding of the various forms of graphic representation of a frequency distribution.
9.
1. On the basis of construction:
Simple table: It is a table which reflects only one variable at a time. It is very simple to draw. It is also called one-way table. Its example is given below:
Number of Employees in an organization according to age Group
| Age (in Year) | No. of Employees |
| Below 25 | 50 |
| 25-35 | 67 |
| 35-45 | 43 |
| 45-55 | 15 |
| 55 and above | 5 |
| Total | 180 |
(a) Complex tables: It is a table which represents two or more variables in one table. It may be two way or three way or more than type of variables.
(i) Two-way table: It represents two variables. An example of two way table is given below:
Tables showing grades of boys and girls of class
| Grade | ||||
| A | B | C | Total | |
| Boys | 13 | 25 | 11 | 49 |
| Girls | 7 | 20 | 6 | 33 |
| Total | 20 | 45 | 17 | 82 |
(ii) Three-Way Table gives information regarding three mutually dependent and inter-related' questions. For example, from one-way table, we get information about age, and from two-way table, we get information about the number of male and female available in various grades. A three way table is showing.
1. Population in various division.
2. Their sex-wise distribution
3. Their position of literacy.
| Division | Three-Way Table | ||||||||
| Population (Millions) | |||||||||
| Male | Female | Total | |||||||
| Literate | Illiterate | Total | Literate | Illiterate | Total | Literate | Illiterate | Total | |
| Delhi | |||||||||
| Mumbai | |||||||||
| Chennai | |||||||||
| Kolkata | |||||||||
(iii) Higher Order Tables: Manifold (or Higher Order) Table: Such tables provide information about a large number of interrelated characteristics in the data set.
| State | Neonatal Mortality | Post-neonatal Mortality | Child Mortality (12-47 months) |
||||||
| Male | Female | F/M ratio | Male | Female | F/M ratio | Male | Female | F/M ratio | |
| Northern region | |||||||||
| Delhi | 36.2 | 30.3 | 0.83 | 24.1 | 34.1 | 1.41 | 13.6 | 21.2 | 1.56 |
| Haryana | 47.1 | 37.6 | 0.80 | 28.8 | 45.9 | 1.59 | 18.4 | 34.2 | 2.34 |
| Himachal Pradesh | 41.6 | 34.4 | 0.83 | 25.6 | 28.5 | 1.11 | 17.6 | 25.3 | 1.44 |
| Punjab | 32.9 | 27.0 | 0.82 | 22.8 | 22.1 | 0.97 | 12.7 | 23.0 | 1.81 |
| North-central region | |||||||||
| Bihar | 64.0 | 50.0 | 0.78 | 37.3 | 42.4 | 1.13 | 34.5 | 53.5 | 1.55 |
| Madhya Pradesh | 63.1 | 49.5 | 0.78 | 36.5 | 43.4 | 1.19 | 46.7 | 56.8 | 1.22 |
| Rajasthan | 42.3 | 42.0 | 0.97 | 31.3 | 37.5 | 1.20 | 26.5 | 42.2 | 1.59 |
| Uttar Pradesh | 71.1 | 68.3 | 0.96 | 41.5 | 51.6 | 1.24 | 38.5 | 65.5 | 1.70 |
| Eastern region | |||||||||
| Assam | 63.0 | 47.9 | 0.76 | 37.9 | 36.4 | 0.96 | 52.9 | 59.6 | 1.13 |
| Orissa | 70.4 | 57.6 | 0.82 | 56.5 | 54.1 | 0.96 | 16.1 | 23.4 | 1.45 |
| West Bengal | 56.5 | 53.7 | 0.95 | 28.2 | 23.6 | 0.84 | 21.7 | 35.4 | 1.63 |
| Western region | |||||||||
| Goa | 27.7 | 18.1 | 0.65 | 9.7 | 10.8 | 1.11 | 7.5 | 8.3 | 1.11 |
| Gujarat | 47.8 | 44.6 | 0.93 | 24.2 | 30.2 | 1.25 | 27.1 | 38.6 | 1.42 |
| Maharashtra | 46.2 | 28.8 | 0.62 | 16.5 | 20.0 | 1.21 | 19.1 | 23.6 | 1.24 |
| Southern region | |||||||||
| Andhra Pradesh | 54.4 | 40.9 | 0.75 | 23.2 | 28.0 | 1.21 | 21.5 | 27.6 | 1.28 |
| Karnataka | 54.4 | 45.4 | 0.83 | 24.3 | 25.8 | 1.06 | 25.6 | 33.4 | 1.30 |
| Kerala | 23.4 | 20.7 | 0.88 | 10.5 | 7.1 | 0.68 | 10.8 | 9.4 | 0.94 |
| Tamil Nadu | 53.5 | 38.9 | 0.73 | 26.0 | 22.7 | 0.87 | 29.0 | 23.2 | 0.80 |
| India | 57.0 | 48.1 | 0.84 | 31.7 | 35.8 | 1.13 | 29.4 | 42.0 | 1.43 |
(b) Sex-specific estimates are not provided for the Jammy region of Jammy and Kashmir (northern region) or for the northeastern states (eastern region).
Source. National Family Health Survey (1992-1993).
2. On the basis of Purpose
(a) General purpose table: It contains more information and serves many purposes simultaneously.
(b) Special purpose (or summary) tables: These tables are meant to serve a specific purpose.
3. On the basis of Originality:
(a) Original Tables: Tables which are directly derived from the data collected are called original tables.
(b) Derivative tables: Tables which are indirectly derived from original tables are called derivative tables.
10.
The following general guidelines are taken into consideration while preparing diagrams:
1. Title: Each diagram should have a suitable title. It may be given either at the top of the diagram or below it. The title must convey the main theme which the diagram intends to portray.
2. Size: The size and portion of each component of a diagram should be such that all the relevant characteristics of- the data are properly displayed and can be easily understood.
3. Proportion of length and breadth: An appropriate proportion between the length and breadth of the diagram should be maintained. As such there are no fixed rules about the ratio of length to width.
4. Proper scale: There are again no fixed rules for selection of scale. The diagram should neither be too small nor too large. The scale for the diagram should be decided after taking into consideration the magnitude of data and the size of the paper on which it is to be drawn. The scale showing the values as far as possible should be in even numbers or in multiples of 5, 10, 20, and so on. The scale should specify the size of the unit and the nature of data it represents, for example, 'millions of tonnes', in ~ thousand, and the like. The scale adopted should be indicated on both vertical and horizontal axes if different scales are used. Otherwise, it can be indicated at some suitable place on the graph paper.
5. Footnotes and source note: To clarify or elucidate any points which need further explanation but cannot be shown in the graph, footnotes are given at the bottom of the diagrams.
6. Index: A brief index explaining the different types of lines, shades, designs, or colours used in the construction of the diagram should be given to understand its contents.
7. Simplicity: Diagrams should be prepared in such a way that they can be understood easily. To keep it simple, too much information should not be loaded in a single diagram as it may create confusion. Thus if the data are large, then it is advisable to prepare more than one diagram, each depicting some identified characteristic of the same data.
11.
From the definition of median, we should be able to tell that the first step is to rearrange the given set of numbers in order of increasing magnitude, i.e. from the lowest to the highest
| Serial Number | Value |
| 1 | 20 |
| 2 | 30 |
| 3 | 32 |
| 4 | 45 |
| 5 | 53 |
| 6 | 57 |
| 7 | 62 |
| 8 | 68 |
| 9 | 72 |
| 10 | 77 |
| 11 | 81 |
\(Median=\frac{n+1}{2}th\ observation \frac{11+1}{2}\) observation=57.
12.
| Monopoly | Basis | Monopolistic Competition |
|---|---|---|
| Monopoly refers to a market situation where there is a single seller selling a product which has no close substitutes. | Meaning | Monopolistic Competition refers to a market situation in which there are large number of firms selling closely related but differentiated products. |
| There is a single seller and the monopolist has full control over the supply. | Number of sellers | There are large number of sellers. So, a firm does not have much impact on activities of other firms. |
| There are no close substitutes of the product. So, there is no competition from new and existing products. | Nature of product | Products are differentiated on the basis of brand, size, colour, shape etc. So, a firm is in a position to influence the price |
| There is restriction on entry and exit. So, a firm can earn abnormal profits in the long run. | Entry or Exit | Although there is freedom of entry and exit but it is possible only for a competitive firm to enter or leave the industry. |
| Monopolist is a price-maker as firm and industry are one and the same thing. | Price | Firm is neither a price-taker nor a price maker but has partial control over price due to product differentiation |
| Downward sloping demand curve is less elastic due to absence of close substitutes. | A demand Curve | Downward sloping demand curve is more elastic due to presence of close substitutes. |
| Low selling costs are incurred. | Selling cost | Heavy selling costs are incurred on sales promotion. |
13.
The profit-maximizing level of output is always determined where,
(i) MR = MC
(ii) MC must be rising. In other words, where price is equal to MC.
If price is not equal to MC, profit-maximizing condition cannot hold. It can be explained with the help of the following two cases:
Case 1: Price Greater Than MC
(i) In the given figure at output level q2, the market price is greater than marginal cost.
(ii) To show that q2 is not a profit maximizing level of output, we have taken q3 output level, which is right of q2.
(iii) Suppose the firm increases its output level from q2 to q3. The increase in total revenue of the firm from this output is the market price multiplied by the change in quantity (\(\triangle\) TR= market price x \(\triangle\)Q), that is, the area of rectangle q2q3CB.
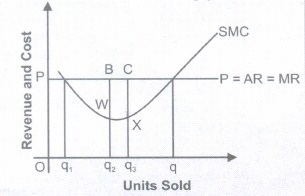
(iv) On the other hand, the increase in total cost with this increase in output is the area of the region q2q3XW.
(v) But, a comparison of the two area shows that the firm's profit is higher when output level is q2q3 rather than %. So, % is not a profit maximizing level of output.
Case 2: Price Less Than MC
(i) In the given figure at output level q2, the market price is less than marginal cost.
(ii) To show that %is not a profit maximizing level of output, we have taken q3 output level, which is left of q2.
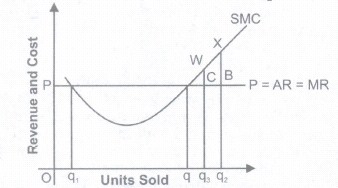
(iii) Suppose now, that the firm reduce its output level from q2 to q3. The decrease in total revenue of the firm from this output is the market price multiplied by the change in quantity (\(\triangle\)TR = market price x \(\triangle\)Q), that is, the area of rectangle q2q3CB.
(iv) On the other hand, the decrease in total cost with this decrease in output is the area of the region q2q3WX.
(v) But, a comparison of the two area shows, that by reducing the output from q2 to q3, the decrease in cost is more than the loss in revenue.
So, q2 is not a profit maximizing level of output.
14.
When investigator uses the data which is used by someone else, it is called secondary data. Sources fo secondary data are as follows:
Published Printed Sources: There are a variety of published printed sources. Their credibility depends on many factors. For example, on the writer, publishing company and time and date when published. New sources are preferred and old sources should be avoided as new technology and researches bring new facts into light.
1. Books: Books are available today on any topic that you want to research. The use of books start before even you have selected the topic. After selection of topics books provide insight on how much work has already been done on the same topic and you can prepare your literature review. Books are secondary source but most authentic one in secondary sources.
2. Journals/periodicals: Journals and periodicals are becoming more important as far as data collection is concerned. The reason is that journals provide up-to-date information which at times books cannot and secondly, journals can give information on the very specific topic on which you are researching rather talking about more general topics.
3. Magazines/Newspapers: Magazines are also effective but not very reliable. Newspaper on the other hand are more reliable and in some cases the information can only be obtained from newspapers as in the case of some political studies.
Published Electronic Sources: As internet is becoming more advance, fast and reachable to the masses; it has been seen that much information that is not available in printed form is available on internet. In the past the credibility of internet was questionable but today it is not. The reason is that in the past journals and books were seldom published on internet but today almost every journal and book is available online. Some are free and for others you have to pay the price.
4. E-journals: e-journals are more commonly available than printed journals. Latest journals are difficult to retrieve without subscription but if your university has an e-library you can view any journal, print it and those that are not available you can make an order for them.
5. General Websites: Generally websites do not contain very reliable information so their content should be checked for the reliability before quoting from them.
6. Weblogs: Weblogs are also becoming common. They are actually diaries written by different people. These diaries are as reliable to use as personal written diaries.
Unpublished Personal Records: Some unpublished data may also be useful in some cases.
Diaries: Diaries are personal records and are rarely available but if you are conducting a descriptive research then they might be very useful. The Anne Franks diary is the most famous example of this. That diary contained the most accurate records of Nazi wars.
Letters: Letters like diaries are also a rich source but should be checked for their reliability before using them.
Government Records: There are two major government agencies which provide data. These are CSO and NSSO.
Central Statistical Office (CSO) It is responsible for coordination of statistical activities in the country and for evolving and maintaining statistical standards. Its activities include compilation of National Accounts; conduct of Annual Survey of Industries and Economic Censuses, compilation of Index of Industrial Production, as well as Consumer Price Indices. It also deals with various social statistics, training, international cooperation, Industrial Classification etc. The CSO is headed by a Director-General who is assisted by 5 Additional Director-Generals looking after the National Accounts Division, Social Statistics Division. Economic Statistics Division, Training Division and the Coordination and Publication Division. CSO is located in the Sardar Patel Bhawan, Parliament Street, New Delhi. The Industrial Statistics Wing of CSO is located in Kolkata. The Computer Centre also under the CSO is located in R K Puram, New Delhi.
National Sample Survey Office (NSSO) It has four divisions
(i) Survey Design and Research Division (SDRD) - Kolkata
(ii) Field Operations Division (FOD) - New Delhi - Data Processing Division (DPD) - Kolkata
(iii) Co-ordination and Publication Division (CPD) - New Delhi The surveys on Consumer Expenditure, Employment - Unemployment, Social Consumption (Health, Education etc.), Manufacturing Enterprises, Service Sector Enterprises are carried out once in 5years. And survey of Land and Livestock Holding and Debt and Investment are carried out once in 10 years.
15.
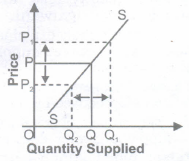
| Changes in quantity supplied | Basis | Change in supply | ||||||||||||||||||||||||
|---|---|---|---|---|---|---|---|---|---|---|---|---|---|---|---|---|---|---|---|---|---|---|---|---|---|---|
| The change in quantity supplied due to the change in price of the commodity. | Meaning | Change in supply due to the change in factors other than price | ||||||||||||||||||||||||
| Movement along the supply curve (i) Expansion in supply (ii) Contraction in supply |
Alternative Name |
Shift in supply curve |
||||||||||||||||||||||||
| (i) It states that rise in quantity supplied due to the rise in price of the commodity (ii) It states that fall in quantity supplied due to the fall in price of the commodity |
Meaning | (i) An increase in supply means that producers now supply more at a given price level (ii) A decrease in supply means that producers now supply less at a given price level |
||||||||||||||||||||||||
|
Schedule |
|
||||||||||||||||||||||||
 |
Diagrams | 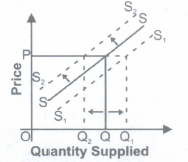 |
||||||||||||||||||||||||
16.
According to Horace Secrist, "By Statistics we mean aggregate of facts affected to a marked extent by multiplicity of causes numerically expressed, enumerated or estimated according to a reasonable standard of accuracy, collected in a systematic manner for a pre-determined purpose and placed in relation to each other."
(a) Statistics is aggregate of facts: A single figure is not called statistics. Aggregate of facts is called statistics. 1t is for a simple reason that a single figure can neither be compared, nor presented nor analyzed. If Ram says that his height is 6 feet, it is not statistics but if he says average height of his class is 6 feet, it is a statistical statement because it is backed by aggregate of facts.
(b) Statistics are affected to a marked extent by multiplicity of causes: There are many factors which work behind statistical forces operating together. For example, statistics of employment in an economy are affected by demand and supply of labour force, working conditions, production methods used etc. In the above example, if average height of a class is 6 feet, there are many factors responsible for it- geographical, genetic, gender etc.
(c) Statistics are numerically expressed: All Statistics are numerically expressed. If a fact is not numerically expressed, it cannot be called statistics. Statements like good, bad, very large, very small, inadequate etc. cannot be called statistics. For example, following statements are not statistics. My height has increased; India's population has increased; Crime rate is increasing in India etc. Following are statistical statements. My height which had increased by 2 inches last year has increased by 5 inches this year. India's population is increasing @ 2% p.a. which is more than last year which was 1.2%p.a. Crime rate in India has increased by 200% during 1999-2010.
(d) Statistics are enumerated or estimated according to a reasonable standard of accuracy: Statistical data must be reasonably accurate because they serve as the basis of decision making and conclusions drawn. If data are actually collected they need to be accurate if they are estimated (when actual data are not available) they must be accurate to a reasonable standard.
(e) Statistics are collected in a systematic manner: Only systematically collected statistics are reliable. Those statistics which are not systematically collected are inaccurate and unreliable. Such statistics, if used, will lead to misleading conclusfons.
(f) Statistics are collected for a predetermined purpose: Statistics are collected for a pre-determined purpose. Purpose cannot be determined after collection of data. Which sources should be used for collecting data, which method to use, what should be the sample size all depends on purpose of statistics. If it is not collected for a predetermined purpose, it will be purposeless i.e. useless.
(g) Statistics should be placed in relation to each other: Since statistics are collected for comparison, we need to place various items in relation to each other. Data must be uniform and homogeneous to be able to put in relation to each other. For example, if we are comparing price indices, base year should be same. If it is not so, they are not comparable. Therefore, we can say that all numerical facts are not statistics but all statistics are numerical facts.
17.
The behaviour of Marginal product in the law of variable proportion is as under:
(i) When Marginal product rises (till Point PI), Total product increases at an increasing rate (convex shape) (till point P).
(ii) When Marginal product falls and remains positive (till point B1), total product increases at a diminishing rate (concave shape) (till point A).
(iii) When Marginal Product is zero (at point B1), Total Product is at its maximum and constant (At point B).
(iv) When Marginal product becomes negative (after point B1), total product falls (after point B).
Causes or Reasons of this Behaviour is as Under:
(i) Phase I
(a) Proper utilization of the fixed factor
1. In the initial stage of production, the units of variable input (i.e., labour) is so less that fixed inputs cannot be effectively utilized.
2. Proper utilization of the fixed factor can be attained when more and more units of variable factor (labour units) are applied to the fixed factor (land), the fixed factor will be used intensively and output will increase rapidly.
(b) Specialization and division of labour
1. Initially, there was only one labour working on all the 5 acres of land ploughing, watering, etc.
2. As the number of labour units increases, each worker specialized in a particular activity leads to
specialization of the variable units and this resulted in increased output.
(ii) Phase II
(a) The non-optimal combination of variable factor with the fixed factor
1. When a given quantity of a fixed factor is combined with more and more units of variable factor, the additional units of variable factor will have smaller and smaller quantity of fixed factor to work with them.
2. As many workers share the same fixed factor, the share of each would obviously fall. Therefore, the cooperation of the fixed factor is not available to the same extent. Thus, an increase in the variable factor would add less and less to total output.
(b) Imperfect Substitutes
1. Diminishing return to factor occurs because variable factor and fixed factor are imperfect substitutes to each other.
2. Technically speaking, there is a limit to which variable factor can be applied to fixed factor and that limit depends upon the efficiency of fixed factor. So, variable factor and fixed factor are imperfect substitutes to each other.
(iii) Phase III
(a) Efficiency of Variable Factor Fall
1. In this stage the amount of variable factor becomes excessive relative to the fixed factor. This happens when too many LABOUR are engaged in cultivating on a given piece of land.
2. Instead of helping each other in production they cause overcrowding and chaos and thus hamper each other's work. In such a case, the contribution of additional labour to production is bound to be negative.
3. Thus, the marginal returns become negative and the total returns start diminishing.
(b) Efficiency of Fixed Factor Fall
1. Too much of a variable factors may also lead to the inefficiency of the fixed factor as well. • In case of capital, which is a fixed factor, too much of labour may cause lot of wear and tear of machinery, frequent breakdowns and excessive cost of maintenance. This is bound to affect total production adversely.
2. In such a situation it is advisable to reduce the units of the variable factor than to increase it with a view for getting maximum production.
18.
| Basis | Positive Economics | Normative Economics |
| Meaning | It deals with laws, principles, theories and facts of economics. | It deals with opinions, policy evaluation and idealistic part of economics. |
| Reality vs. Idealism | It deals with reality, i.e. 'what is'. | It deals with idealistic situation, i.e. 'What ought to be' |
| Value Judgments | No value judgments are associated with positive economics | Value judgments are associated with normative economics |
| Example | (a) There is inverse relation between price and quantity demanded other things being equal. (b) In India, 34% marginal farmers are living below poverty line. (c) MGNREGA was launched in 2005. |
(a) Globalization is widening the gap between countries. (b) Poverty is worse than unemployment (c) Price rise is disastrous for the economy (d) We should not give subsidies on fertilizers |
19.
(i) The supply curve of the firm tells us the quantity of the product that a firm is willing and able to produce and sell at each possible price.
(ii) The firm will produce and supply an output at the point at which Price is equal to Marginal cost. The derivation of the supply curve is explained with the help of the given figure.
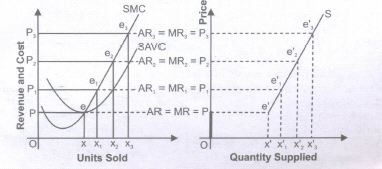
(iii) The SMC of the firm is given. Let us initially assume that the market price is OP1. The firm will produce and supply an output of OX1 because at el' price = MC. (OX1 is the equilibrium output supplied, as MC = MR and MC cuts MR from below).
(iv) Suppose the market price rises to OP2, then the firm will produce and sell OX2 level, because at e2 level price = MC = MR.
(v) Similarly, as market price increases to OP3, quantity supplied increases to OX3 However, the firm will not supply any quantity if the price falls below OP.
(vi) At OP price, the firm will produce and sell OX output. For any price below OPthe firm will not produce and sell anything. The supply will be zero units. Having the above information, the supply schedule can be determined as,
| Price of Product | Units Supplied |
|---|---|
| OP | OX |
| OP1 | OX1 |
| OP2 | OX2 |
| OP3 | OX3 |
(vii) If the market price falls below the minimum of the SAVC, the supply curve jumps to the small segment (OP) on the vertical axis at which there is zero supply. Therefore, two discontinuous [(OP) + (e'S)] pieces define the short run supply curve for the perfectly competitive firm.
20.
| Output | MC (Given) | TVC = \(\sum\)MC | TFC | TC = TFC + TVC | AVC\(\frac{TVC}{Output}\) |
|---|---|---|---|---|---|
| 1 | 9 | 9 | 12 | 21 | 9 |
| 2 | 7 | 16 | 12 | 28 | 8 |
| 3 | 2 | 18 | 12 | 30 | 6 |
| 4 | 4 | 22 | 12 | 34 | 5.5 |
| 5 | 8 | 30 | 12 | 42 | 6 |
| 6 | 12 | 42 | 12 | 54 | 7 |
21.
| Q | MR | TR=ΣMR | Demand Curve or Price or \(AR=\frac{TR}{Q}\) | ED |
|---|---|---|---|---|
|
1 |
10 6 2 2 |
10 16 18 20 |
10 8 6 5 |
ED > 1 |
| 5 | 2 | 22 | 4.4 | |
| 6 7 8 |
0 0 0 |
22 22 22 |
3.6 3.2 2.75 |
ED =1 |
| 9 | -5 | 17 | 1.9 | ED < 1 |
Rule: When with the fall in price of goods, total revenue rises, ED > 1, if it remains same ED = 1 and if falls then ED < 1.
22.
(a) When purchasing a unit of a commodity a consumer compares its price with the expected utility from it. Utility obtained is the benefit, and the price payable is the cost. The consumer compares benefit and the cost. He will buy the unit of a commodity only if the benefit is greater than or at least equal to the cost.
(b) equilibrium Conditions for Single Commo ·ty Consumer Equilibrium Necessary Condition Marginal utility in terms of Money = Price
\(\frac { Marginal\ utility\ of\ a\ product\ in\ utils[M{ U }_{ X }] }{ \ utility\ of\ one\ rupee[M{ U }_{ M }] } \)
In particular, the condition (A) says that the marginal utility of a Product in terms of Money be equal to its price. Sometimes, this is loosely stated as marginal utility is equal to price, i.e.,
| Consumption(Un-its) | Marginal Utility(MU)(Uti-Ls) | M.U.(Rs) | Price | Marginal Gain(MU-Price) | Total Gain |
|---|---|---|---|---|---|
| 1 | 5 | 5 | 3 | 2 | 2 |
| 2 | 4 | 4 | 3 | 1 | 3 |
| 3 | 3 | 3 | 3 | 0 | 3 |
| 4 | 2 | 2 | 3 | -1 | 2 |
(b) Suppose, the price of commodity X in the market is Rs.3 per unit. It means he has to pay Rs.3 per unit for all the units he buys. Suppose, the utility obtained from the first unit is 5 utils (=Rs. 5). The consumer will buy this unit because the utility of this unit is greater than the price and this process continues till Marginal utility = Price as shown in the above schedule at quantity 3.
(c) Consumer will not buy the fourth unit MU = Price.
If MU> PRICE
(a) Means benefit is greater than cost and whenever benefit is greater than cost, consumer keeps on consuming additional unit of a commodity till MU = Price.
(b) It is so because according to the law of diminishing marginal utility, MUfalls as more is purchased till it becomes equal to price.
If MU< PRICE
(a) Means benefit is less than cost and whenever benefit is less than cost, the consumer keeps on decreasing additional unit of a commodity till MU = Price.
(b) It is so because according to the law of diminishing marginal utility, MU rises as less units are consumed till it becomes equal to price.
Sufficient Condition
Total gain falls as more is purchased after equilibrium. It means that consumer continues to purchase so long as total gain is increasing or at least constant.
(a) It can be explained with the help of the following schedule:
because utility of this unit is 2 utils (= Rs.2) which is less than the price. It is not worth buying the fourth unit. The consumer will restrict his purchase to only 3 units
23.
(i) Rise in Income for Normal Goods:
1. In the above schedule, note that as the income of a consumer rise from Rs.5000 to Rs.6000, the quantity demanded of normal goods increases for any given price of normal goods; namely, given income is Rs.5000 and at price of normal goods is Rs.150, the quantity demanded of normal goods is Rs.20. Whereas given income is Rs.6000, at the same price of normal goods (i.e. 150), the quantity demanded of normal goods is 25.
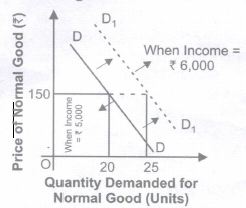
2. In the above diagram, the demand curve for normal goods, when income is Rs.6000 lies to the right of that when income is Rs.5000. Hence, an increase in the income of a consumer shifts the demand curve for normal goods to the right.
(ii) Rise in Income for Inferior Goods:
3. In the above schedule, note that, as the income of a consumer rises from Rs.5000 to Rs.6000, the quantity demanded of inferior goods decreases for any given price of inferior goods. For example, the given income is Rs.5000 and at the price of inferior goods Rs.150, the quantity demanded of inferior goods is 20. Whereas the given income is Rs.6000, at same price of inferior goods (i.e. 150), the quantity demanded for inferior goods is 18.
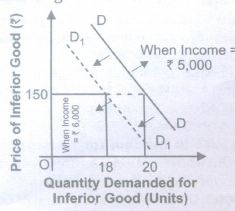
4. In the given diagram the demand curve for inferior goods when income is Rs.6000 lies to the left of that when income is Rs.5000. Hence, an increase in the income of a consumer shifts the demand curve for inferior goods to the left.
24.
The three central problems of an economyare:
(i) What to produce?
(a) What to produce refers to a problem in which decision regarding which goods and services should be produced is to be taken.
(b) Since its resources are limited, every economy has to decide what commodities are to be produced and in what quantities.
(c) The guiding principle for an economy here is to allocate resources in such a way that gives maximum aggregate utility to the society.
(ii) How to produce?
(a) How to produce refers to a problem in which decision regarding which technique of production should be used is made.
(b) Goods and services can be produced in two ways: by using labour intensive techniques, and by using capital-intensive techniques
(c) The guiding principle for an economy in such a case has to decide about the techniques of production on the basis of cost of production. Those techniques of production should be used which lead to the least possible cost per unit of commodity or service.
(iii) For whom to produce?
(a) For whom to produce refers to a problem in which decision regarding which category of people are going to consume a good, i.e., economically poor or rich.
(b) As we know, goods and services are produced for those who can purchase them or have the capacity to buy them.
(c) Capacity to buy depends upon how income is distributed among the factors of production. The higher the income, the higher will be the capacity to buy and vice versa. So, this is a problem of distribution.
(d) The guiding principle is that the economy must see here that important and urgent wants of its citizens are being satisfied for the maximum possible extent or not.
25.
26.
(b)
10
27.
(d)
Range
28.
(b)
Frequency
29.
(b)
11
30.
(d)
0.29
31.
(d)
S.D. of a series would be also multiplied by5.
32.
(c)
Cumulative frequency distribution
33.
(a)
General Purpose Table
34.
(d)
quantity will decrease.
35.
(a)
One-dimensional diagram
36.
(a)
Price = Marginal Cost
37.
(d)
all market forms
38.
(c)
Publication of Dat
39.
(b)
implies that consumer's wants will never be completely satisfied
40.
(b)
Mailed questionnaire method
41.
(b)
marginal revenue is equal to price
42.
(c)
producers plan to sell during a given time period at a given price.
43.
(a)
Price x quantity
44.
(a)
Cost of raw materials.
45.
(a)
At least one fixed factor of production and firms neither leaving nor entering the industry.
46.
(d)
upward-sloping to the right.
47.
(b)
1
48.
(a)
wants exceed the resources available to satisfy them
49.
(c)
Is tangent to an indifference curve
50.
Following steps need to be taken before data collection:
(a) Develop a complete plan for survey: It is important to draw a complete plan for a statistical survey before we start collecting data actually. We need to define the objective of the project should be clearly specified. On the basis of this objective, you will decide sources and methods of data collection and sample size. We also need to define our population precisely. If we are conducting a project on child labour, which area we are covering and how many households are being taken as a sample. At school level sample size should be between 30 to 50. You will have to plan three things.
(i) What data to be obtained (objective)
(ii) From whom data are to be obtained (Population)
(iii) By what methods the data are to be obtained-primary or secondary
(b) You also have to decide the expenditure to be incurred and time availability:
The expenditure and the time period will determine most of the subsequent steps to be taken.
(i) Decide whether to adopt census method or sample method: For conducting survey on any issue, the investigator has two options: sample and census. Which method will depend on budget, availability of time and accuracy requirement?
ii) Preparing Questionnaire: Designing the questionnaire is influenced by many considerations like number of questions to be included, language of questions, types of questions, ordering of the questions etc. It has been explained in detail in chapter-S developing a Questionnaire.
(iii) Mode of Distribution of Questionnaire: There are different ways in which questionnaire can be sent. It can be personal or by post or by e mail. In personal it can be filled either by respondent or enumerator. These methods have also been discussed in detail in the chapter-S.
(iv) Check the filled in forms for completeness and consistency: It is the last stage in collection of data. This stage comes when duly filled forms are returned by the respondents. Each questionnaire must be examined and edited if necessary.
51.
When this method is used to construct a price index number, first of all price relatives are obtained for the various items included in the index and then the average of these relatives is obtained using anyone of the averages i.e. mean or median etc. When ARITHMETIC MEAN is used for averaging the relatives the formula for computing the index is
P01=\(\frac { 1 }{ n } \sum { \left( \frac { { P }_{ 1 } }{ { P }_{ 0 } } \times 100 \right) } \)
When GEOMETRIC MEAN is used for averaging the relatives the formula for computing the index is P01 =Anti log\(\left[ \frac { 1 }{ n } \sum { log\left( \frac { { P }_{ 0 } }{ { P }_{ 1 } } \times 100 \right) } \right] \)
And price relative=\(\frac { { P }_{ 0 } }{ { P }_{ 1 } } \times 100\)
Merits: It is not affected by the units in which prices are quoted It gives equal importance to all the items and extreme items don't affect the index number.
The index number calculated by this method satisfies the unit test. Demerits: Since it is an unweighted average the importance of all items are assumed to be the same. The index constructed by this method doesn't satisfy all the criteria of an ideal index number. In this method one can face difficulties to choose the average to be used.
52.
Q1 = 27.5, Q3= 66
53.
(i) Range = Largest Value - Smallest Value
= 5090-1007= 4083
(ii)
| Class Interval | Frequency | More than CF |
| 1000-2000 | 33 | 50 |
| 2000-3000 | 11 | 17 |
| 3000-4000 | 3 | 6 |
| 4000-5000 | 2 | 3 |
| 5000-6000 | 1 | 1 |
(iii) (a) 33
(b) 6
(c) 19
54.
The equilibrium price remains same in the following cases:
(i) When increase in demand is equal to increase in supply.
(ii) When decrease in demand is equal to decrease in supply.
(iii) When demand increases and supply is perfectly elastic.
(iv) When demand decreases and supply is perfectly elastic.
(v) When supply increases and demand is perfectly elastic.
(vi) When supply decreases and demand is perfectly elastic.
55.
The difference between correlation and causation is that correlation is the mutual relation that exists between two or more things while causation is the fact that something causes an effect. The correlation between two variables does not imply that one is as a result of the other. Two or more variables considered to be related, in a statistical context, if their values change so that as the value of one variable increases or decreases so does the value of the other variable (although it may be in the opposite direction). For example, for the two variables "hours worked" and "income earned" there is a relationship between the two if the increase in hours worked is associated with an increase in income earned. If we consider the two variables "price" and "purchasing power", as the price of goods increases a person's ability to buy these goods decreases (assuming a constant income). But we cannot say that one is the cause of other.
56.
When information is presented over a period of time, it is called time series graph. In it, time (hour, day/date, week, month, year, etc.) is plotted along x-axis and the value of the variable (time series data) along y-axis. A line graph by joining these plotted points, thus, obtained is called arithmetic line graph (time series graph). It helps in understanding the trend, periodicity, etc. in a long term time series data. An example is given below:
57.
Following are the main objects of the tabulation or tabular presentation of statistical data:
It simplifies the complex data.
It facilitates comparison.
It helps to give better identity to the data. '
It provides a good means of arrangement.
58.
(i) New firms can enter the market, if found profitable. Similarly, inefficient firms already operating in the market are free to quit the market if they incur losses.
(ii) It is because of this feature that like perfect competition, monopolistic competition also gives rise to normal profit.
(iii) No firm receives abnormal profit in the long run as then new firms can emerge and old ones can expand output and adjust supply with changing demand.
59.
The producer will be in equilibrium when MR= MC. It occurs at 4 units of output where both MR and MC are equal to 7
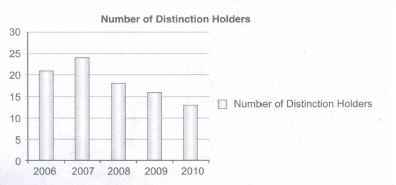
60.
| Year | 2006 | 2007 | 2008 | 2009 | 2010 |
| Number of distinction | 21 | 24 | 18 | 16 | 13 |
61.
There is an interesting story which is told to make fun of statistics. It is said that a family of four persons (husband, wife and two children) once set out to cross a river. The father knew the average depth of the river. So he calculated the average height of his family members. Since the average height of his family members was greater than the average depth of the river, he thought they could cross safely. Consequently some members of the family (children) drowned while crossing the river. Similarly, a person conducted a survey and found that the places where there were larger numbers of hospitals, death rates were higher. So, he concluded that hospitals are responsible for increasing death rates. Another example can be situation when you collect data on birth rate and rainfall. You find that the years when there was higher rainfall, birth rate was high and you conclude that rainfall is one of the causes of high birth rate. Therefore, we say that statistics are not substituted for common sense.
62.
Had there been no scarcity, there would have been no need for optimizing the resources. But the fact is that resources are scarce in relation to unlimited human wants and therefore, we need to optimize their utilization so as to maximize our utility level. It is used for decisions at individual as well as society level. Had there been no scarcity, there would have been no problem of making a choice. We need not make choice in case of abundant things. Therefore, it is right to say that scarcity and choice go together.
63.
In the given example, first we will calculate Price Elasticity of Good X.
| Original Quantity (Q)= 100 units | % Change in Price = -20% |
| New Quantity (Q1) = 250 units | Elasticity of Demand (ED) =? |
| Change in Quantity (DQ)= 150 units |
Percentage change m demand =\({\triangle Q\over Q}\times 100={150\over100}=150\%\)
Price Elasticity of Demand (ED)= \({\%Change\ in\ quantity\ demanded\over \% Change\ in\ Price}={150\%\over-20\%}\)
Price Elasticity of Demand (ED) = (-)7.5
Now, Price Elasticity of Good Y = (-) 7.5 (as both X and Y have same price elasticity). Let us now calculate % Rise in Demand for good Y
% Rise in Demand = ? % Change in Price = - 8%
Elasticity of Demand (ED) = (-)7.5
Price Elasticity of Demand (ED)= \({\%Change\ in\ quantity\ demanded\over \% Change\ in\ Price}\)
\((-)7.5={\%Change\ in\ quantity\ demanded\over -8\%}\)
Percentage rise in demand = 60%
Demand for Good Y will rise by 60%
64.
(a)
| Output | 0 | 1 | 2 | 3 | 4 | 5 | 6 | 7 | 8 | 9 | 10 |
| Price | 15 | 15 | 15 | 15 | 15 | 15 | 15 | 15 | 15 | 15 | 15 |
| TR | 0 | 15 | 30 | 45 | 60 | 75 | 90 | 105 | 120 | 135 | 150 |
(b)
| Output | 0 | 1 | 2 | 3 | 4 | 5 | 6 | 7 | 8 | 9 | 10 |
| Price | 17 | 17 | 17 | 17 | 17 | 17 | 17 | 17 | 17 | 17 | 17 |
| TR | 0 | 17 | 34 | 51 | 68 | 85 | 102 | 119 | 136 | 153 | 170 |
New TR curve Will be a steeper straight line as the one in perfect competition
65.
(i) A decrease in marginal revenue leads to total revenue increase at a diminishing rate. It can be explained with the help of following schedule:
| Units sold | MR(Rs) | TR=ΣMR |
|---|---|---|
| 1 | 10 | 10(10+0) |
| 2 | 8 | 18(10+8) |
| 3 | 6 | 24(18+6) |
| 4 | 4 | 28(24+4) |
| 5 | 2 | 30(28+2) |
(ii) An increase in marginal revenue leads to total revenue increase at an increasing rate. It can be explained with the help of following schedule:
| Units sold | MR(Rs) | TR=ΣMR |
|---|---|---|
| 1 | 10 | 10(10+0) |
| 2 | 12 | 22(10+12) |
| 3 | 14 | 36(22+14) |
| 4 | 16 | 52(36+16) |
| 5 | 19 | 71(52+19) |
66.
Sampling errors are more serious as they may be intentional and biased. Such errors are difficult to be detected and rectified. On the other hand, non sampling errors are clerical errors which can be rectified with greater caution and attention.
67.
| Output | TC (Given) | TFC (Given) | TVC = TC - TFC | AVC = \(\frac{TVC}{Output}\) | ATC = \(\frac{\Delta{TC}}{\Delta{Output}}\) |
|---|---|---|---|---|---|
| 1 | 23 | 18 | 5 | 5 | 5 |
| 2 | 27 | 18 | 9 | 4.5 | 4 |
| 3 | 30 | 18 | 12 | 4 | 3 |
68.
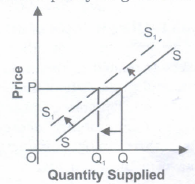
A decrease in supply means that producers now supply less at a given price level. The conditions are:
(a) Rise in the prices of remuneration of factors of production.
(b) Rise in the prices of other goods.
(c) When the technology becomes outdated.
(d) Change in the objective of producer (decrease supply at the same price).
(e) Taxation policy of government rises.
69.
(i) When Total Product increases at an increasing rate, Average Product also increases.
(i!) When Total Product increases at a diminishing rate, Average Product declines.
(iii) Since Total Product is always positive, Average Product also remains throughout positive.
70.
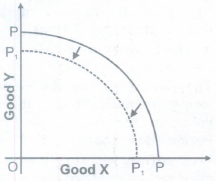
PPC of the economy will shift to the left from PP to P1P1. It happens because the number of possible combinations available with the economy has decreased due to destruction of resources in the economy.
71.
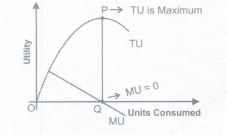
(i) When MU decreases, TU increases at a diminishing rate. (As shown in figure till consumption level OQ).
(ii) When MU is zero, TU is maximum at P.
(iii) When MU is negative, TU starts diminishing.
72.
| p | d1 | d2 | Market demand=d1+d2 |
|---|---|---|---|
| 1 | 9 | 24 | 33 |
| 2 | 8 | 20 | 28 |
| 3 | 7 | 18 | 25 |
| 4 | 6 | 16 | 22 |
| 5 | 5 | 14 | 19 |
| 6 | 4 | 12 | 16 |

11th Standard CBSE Syllabus & Materials
11th Standard CBSE
CBSE 11th Business Studies Forms of Business Organisation Sample Question Papers Study Material - QB365 Set A
NEW11th Standard CBSE
CBSE 11th Business Studies Business, Trade and Commerce Sample Question Papers Study Material - QB365 Set A
NEW11th Standard CBSE
CBSE 11th Physics Waves Sample Question Papers Study Material - QB365 Set A
NEW11th Standard CBSE
CBSE 11th Physics Kinetic Theory Sample Question Papers Study Material - QB365 Set A



CBSE 11th Standard CBSE Subjects
CBSE Standards










