
 100% FREE ACCESS
11th Standard Syllabus & Materials
11th Standard
TN 11th Tamil இயற்கை வேளாண்மை,சுற்றுச்சூழல் -செய்யுள் - மனோன்மணீயம் Important Questions And Answers Study Material - QB365 Set A
NEW11th Standard
TN 11th Tamil என்னுயிர் என்பேன் -துணைப்பாடம் - இசைத்தமிழர் இருவர் Important Questions And Answers Study Material - QB365 Set A
NEW11th Standard
TN 11th Tamil மொழி கலை -செய்யுள் - ஒவ்வொரு புல்லையும் Important Questions And Answers Study Material - QB365 Set A
NEW11th Standard
TN 11th Tamil பீடு பெற நில் - இலக்கணம் - பகுபத உறுப்புகள் Important Questions And Answers Study Material - QB365 Set A
NEW11th Standard
TN 11th Tamil பீடு பெற நில் - துணைப்பாடம் - வாடிவாசல் Important Questions And Answers Study Material - QB365 Set A
NEW11th Standard
TN 11th Tamil பீடு பெற நில் - செய்யுள் - குறுந்தொகை Important Questions And Answers Study Material - QB365 Set A

Published on: 01/07/2021
QB365 provides detailed and simple solution for every Creative Questions in class 11 Economics Subject. It will helps to get more idea about question pattern in every Creative questions with solution.
Download Tamil Nadu 11th Standard Economics question papers, model tests, one-mark questions, important questions, and public exam papers in PDF format. Free study materials and answer keys for TN State Board students.
Questions + Answers key
Take MCQ Economics Test1.
What are the Natural Resources in Indian Economy?
2.
What are the steps involved in Microsoft Power Point?
3.
What are the services in Tamil Nadu? Explain.
4.
Explain the theory of Consumer's surplus with the help of a table and a diagram.
5.
Explain how Self-Help Groups (SHGs) function in India.
6.
Explain the contribution of Amartya Kumar Sen towards the Economic development.
7.
Who was J.C. Kumarappa? Explain his rural economic development theories.
8.
Explain the Residual Claimant Theory of Wage.
9.
What are the different kinds of profit?
10.
How is the Marginal product of a factor expressed as? Explain.
11.
Explain the long run equilibrium of a firm and the Group equilibrium under Monopolistic competition.
12.
Define Total Revenue and Explain its behaviour when the price is constant and when the price is declining.
13.
What do you mean by stable equilibrium, particular equilibrium and general equilibrium? Explain.
14.
Explain the different types of utility.
15.
State and explain the Growth definition given by Paul Samuelson.
16.
Explain the wealth definition given by Adam Smith.
17.
What are the measures taken to remove Rural Indebtedness?
18.
Briefly explain the classification of markets.
19.
Explain briefly total cost with a suitable diagram.
20.
Bring out the relationship among TR, AR, MR curves and elasticity of demand.
21.
Explain various large scale industries and their development.
22.
Explain briefly Levels or degrees of Price Elasticity of Demand?
23.
What are this Achievement of Green Revolution?
24.
Changes in Tastes and fashions the demand for some goods and services is very susceptible to change in tastes and fashions?
25.
Describe the problems of British Rule on economic condition.
1.
Any stock or reserve that can be drawn from nature is a Natural Resource. The major natural resources are land, forest, water, mineral and energy. India is rich in natural resources, but majority of the Indians are poor. Nature has provided with diverse climate, several rivers for irrigation and power generation, rich minerals, rich forest and diverse soil.
(i) Land Resources: In terms of area India-ranks seventh in the world with a total area of 32.8 lakh sq. km. It accounts for 2.42% of total area of the world. In absolute terms India is really a big country. However, land-man ratio is not favourable because of the huge population size. According to Agricultural Census, the area operated by large holdings (10 hectares and above) has declined and area operated under marginal holdings (less than one hectare) has increased. This indicates that land is being fragmented and become in economic.
(ii) Forest Resources: India's forest cover in 2007 is 69.09 million hectare which constitutes 21.02 per cent of the total geographical area. Of this, 8.35 million hectare is very dense forest, 31.90 million hectare is moderately dense forest and the rest 28.84 million hectare is open forest.
2.
It is a software used to perform computer based presentation. Steps involved in making presentation:
(i) Click Start Menu
(ii) Click Program
(iii) Select Microsoft Power Point - Click.
(iv) New Power Point file will open, and then type the title and subtitle if wanted.
(v) A new slide can be inserted by 'click' on icon 'new slide' or using short key 'Ctrl + M'.
(vi) We can type the content, insert the table, pictures, movies, sounds, etc., with the content.
(vii) Tab 'Design' helps to design the slides (can select common design for all slides or separate slide for each slide).
(viii) Click icon slide show, one can run slide show either starting from the first slide or starting from the current slide.
The Power Point Presentation (PPT) facilitates the key points to be kept in memory and understand the particular topic. Recently, the smart class room teaching uses the PPT to deliver the information in an effective way to enhance the quality of teaching.
3.
Banking, insurance, energy, transport and communications fall under tertiary sector.i.e., services.
Banking: In Tamil Nadu, Nationalised banks account for 52% with 5,337 branches, Private Commercial Banks 30% (3,060) branches, State Bank of India and its associates 13(1,364), Regional Rural Banks 5% (537) branches and the remaining 22 foreign bank branches.
Education:
(a) School Education: Tamil Nadu is grouped among high Gross Enrolment Ratio (GER) States. It ranks third next only to Kerala (81%)and Himachal Pradesh (74%). The all India average is 43%and the world average is 59%.
(b) Higher Education: In Gross Enrolment Ratio under higher education (Tertiary level) Tamil Nadu continues to be at the top level well ahead of other states. The GER is 46.9% in Tamil Nadu which is far higher against national average and all other States.
Tamil Nadu has 59 Universities, 40 Medical colleges, 517 Engineering colleges, 2,260 Arts and Science colleges, 447 Polytechnics and 20 dental colleges. Tamil Nadu produces nearly four lakh engineering and polytechnic students every year, the highest in the country.
Educational Loans: As far as educational loans disbursed by Public Sector Banks under priority sector are concerned, 20.8% of the total amount was disbursed in Tamil Nadu between 2013-14 and 2015-16.
Health: Tamil Nadu has a three-tier health infrastructure comprising hospitals, primary health centres, health units, community health centres and sub-centres. As of March 2015, the State had 34 district hospitals, 229 sub-divisional hospitals, 1,254 primary health centres, 7,555 Sub-centres and 313 community health centres.
Communication: Maharashtra has the highest number of internet subscribers in the country at 29.47 million, followed by States like Tamil Nadu, Andhra Pradesh and Karnataka.
Transport: Tamil Nadu has a well established transportation system that connects all parts of the State.
(a) Road: There are 28 national highways in the State, covering a total distance of 5,036 km. The State has a total road length of 167,000 km, of which 60,628 km are maintained by Highways Department. It ranks second in India with a share of over 20% in total road projects under operation in the public-private partnership (PPP) model.
(b) Air: Tamil Nadu has four major international airports. Chennai International Airport is currently the third largest airport in India after Mumbai and Delhi. Other international airports in Tamil Nadu include Coimbatore International Airport, Madurai International Airport and Tiruchirapalli International Airport. It also has - domestic airports at Tuticorin, Salem, and Madurai which connect-several parts of the country.
(c) Ports: Tamil Nadu has three major ports; one each at Chennai, Ennore, and Tuticorin, as well as one intermediate port in Nagapattinam, and 23 minor port.
4.
Definition: Alfred Marshall defines consumer's surplus as, "the excess of price which a person would be willing to pay a thing rather than go without the thing, over that which he actually does pay is the economic measure of this surplus satisfaction. This may be called consumer's surplus".
Assumption:
(1) Marshall assunied that utility can be measured.
(2) The marginal utilities of money of the consumer remain constant.
(3) There are no substitutes for the commodity in question.
(4) The taste, income and character of the consumer do not change.
(5) Utility of one commodity does not depend upon the other commodities.
Explanation: The concept of consumer's surplus can be explained with the help of an example. Suppose a consumer wants to buy an apple.
He is willing to pay rs.4, rather than go without it and the actual price of the apple is rs.2. Hence the consumer's surplus is rs.2 (rs.4 - rs.2).
Thus, consumer's surplus is the difference between the price that a consumer is willing to pay (potential price) and what he actually pays. Therefore,
Consumer's surplus = What a person is willing to pay - What he actually pays.
OR
Consumer's surplus = Potential price - Actual price.
Mathematically, Consumer's surplus = TU - (P x Q)
where, TU = Total Utility, P = Price and Q = Quantity of the commodity
Assumption:
(1) Marshall assunied that utility can be measured.
(2) The marginal utilities of money of the consumer remain constant.
(3) There are no substitutes for the commodity in question.
(4) The taste, income and character of the consumer do not change.
(5) Utility of one commodity does not depend upon the other commodities.
Explanation:
The concept of consumer's surplus can be explained with the help of an example. Suppose a consumer wants to buy an apple. He is willing to pay Rs 4, rather than go without it and the actual price of the apple is Rs2. Hence the consumer's surplus is Rs2 Rs4 - Rs 2). Thus, consumer's surplus is the difference between the price that a consumer is willing to pay (potential price) and what he actually pays. Therefore,
Consumer's surplus = What a person is willing to pay - What he actually pays.
OR
Consumer's surplus = Potential price - Actual price.
Mathematically,
Consumer's surplus = TU - (P x Q)
where, TU = Total Utility, P = Price and Q = Quantity of the commodity
Consumer's Surplus
| Units of commodity(Apple) | Willingness to pay or potential price(Marginal Utility) | Actual Price | Consumer's Surplus Potential Price Actual Price |
| 1 2 3 4 5 |
6 5 4 3 2 |
2 |
6-2=4 5-2=3 4-2=2 3-2=1 2-2=0 |
| Total | 20 | 10 | 10 |
Where,
TU= Total Utility, P = Price and Q = Quantity of the commodity
The measurement of consumer's surplus is illustrated in the Table.
In the Table the consumer is willing to pay rupees 6, 5, 4, 3 and 2 for purchasing the successive units of apples.
Hence, he is willing to pay (potential Price Total Utility) ~20 for apples. But, he actually pays ~lQ ~2 x 5» for getting 5 apples. Hence,
Consumer's Surplus = Total Utility (Actual Price x units of Commodity)
= TU - (P x Q)
= 20 - (2 x 5)
= 20 - 10 = 10.
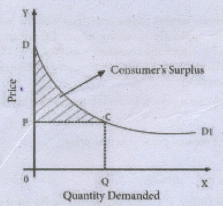
In the diagram, X axis shows the amount demanded and Y axis represents the price.\({ DD }_{ 1 }\) shows the utility which the consumer derives from the purchase of different amounts of commodity.
When price is OP, the amount demanded is OQ. Hence, actual price is OPCQ (OP x OQ). Potential Price (Total Utility) is ODCQ.
Therefore,
Consumer'Surplus = ODCQ - OPCQ
= PDC (the shaded area)
Criticism
(1) Utility cannot be measured, because utility is subjective.
(2) Marginal utility of money does not remain constant.
(3) Potential price is internal, it might be known to the consumer himself.
5.
Self-Help Groups (SHGs):
(a) Self Help Groups are informal voluntary association of poor people, from the similar socio-economic background, up to 20 women (average size is 14). They come together· for the purpose of solving their common problems through selfhelp and mutual help.
(b) The SHG promotes small savings among its members. They save small amounts Rs.10 to Rs.50 a month. The savings are kept with a bank. After saving regularly for a minimum of 6 months, they lend small amounts to their members for interest.
(c) Based on their performance, they are linkedwith the bank for further assistance under SHG Bank Linked Programme (SBLP) started in 1992. It is a holistic programme of micro-enterprises covering all aspects of self-employment, organization of the rural poor into self Help groups and their capacity building, planning of activity clusters, infrastructure build up, technology, credit and marketing.
(d) The main objective of this programme is to bring the beneficiaries above the poverty line by providing income generating assets to them through bank credit and government subsidy. NABARD estimates that there are 2.2 million SHGs in India, representing 33 million members that have taken loans from banks under its linkage program to date.
(e) The SHG Banking Linkage Programme since its beginning has been predominant in certain states, showing spatial preferences especially for the southern regions like Andhra Pradesh, Tamil Nadu, Kerala and Karnataka. These SHGs have helped the Banks to accumulate more funds
(f) Under NABARD SHG Linkage Programme, SHGs can borrow credit from bank on showing their successful track record of regular repayments of their borrowers k has been successful in the states like Andhra Pradesh, Tamil Nadu, Kerala and Karnataka during 2005-06. These States received approximately 60 per cent of SHG linkage credit (Taruna and Yadav, 2016).
(g) In 2009-10, the number of new SHGs having credit-linked with banks was 1.59 million and a bank loan of Rs.14,453 Crores was disbursed to these SHGs. Further, the number of SHGs which maintained savings accounts with banks at the end of March 2010 was 6.95 million.
6.
Contribution of Amartya Kumar Sen:
The Nobel citation refers to Sen's contributions to social choice theory, development economics, study on poverty and famines and concept of entitlements and capability development (1998).
(1) Poverty and Famines:
Sen's Poverty and Famines: An Essay on Entitlement and Deprivation" (1981) is both a theoretical and an applied work. In the book, several famines have been studied in the working of a general theoretical framework from an original angle. He examined various meanings of poverty and drew attention to the incidence of absolute and relative deprivation.
(2) Poverty and Inequality:
Sen has carried out massive work on poverty and inequality in India. Sen's major point has been that the distribution of income/ consumption among the persons below the poverty line is to be taken into account.
(3) The Concept of Capability:
The concept of capabilities developed by Sen has been cited as a better index of wellbeing than commodities or utilities. Capability, as defined by Sen, is the ability to transform Rawlsian primary goods to the achievement of well being.
(4) Entitlement:
Sen has included the concept of entitlement items like nutrition, food, medical and health care, employment, security of food supply in times of famine etc. He considered famine as arising out of the failure of establishing a system of entitlements.
(5) Choice of Technique:
Sen's 'Choice of Technique' was a research work where he argued that in a labour surplus economy, generation of employment cannot be increased at the initial stage by the adaptation of capital-intensive technique. Conclusively, Amartya Sen, more than just an economist, is an ethical philosopher. He is a lover of freedom and a humanist. He has focussed on the poor, viewing them not as objects of pity requiring charitable hand-outs, but as disempowered folk needing empowerment, education, health, nutrition, gender equality, safety net in times of distress; all are needed to empower people.
7.
J. C. Kumarappa:
Joseph Chelladurai Kumarappa was born on 4 January 1892 in Tanjavur, Tamil Nadu. A pioneer of rural economic development theories, Kumarappa is credited for developing economic theories based on Gandhism - a school of economic thought he coined "Gandhian Economics".
Gandhian Economics:
(i) J.C.Kumarappa strongly supported Gandhi's notion of village industries and promoted Village Industries Associations. Kumarappa worked to combine Christian and Gandhian values of "trusteeship", nonviolence and a focus on human dignity and development in place of materialism as the basis of his economic theories.
(ii) While rejecting socialism's emphasis on class war and force in implementation, he also rejected the emphasis on material development, competition and efficiency in free market economies.
(iii) Gandhi and Kumarappa envisioned an economy focused on satisfying· human needs and challenges: while rooting out socio-economic conflict, unemployment, poverty and deprivation.
(iv) Kumarappa worked as a Professor of economics at the Gujarat Vidyapith in Ahmedabad, while serving as the editor of Young India during the Salt Satyagraha.·
(v) He founded the All India Village Industries Association in 1935, and was imprisoned for more than a year during the Quit India movement.
(vi) He wrote during his imprisonment, Economy of Permanence: The Practice and Precepts of Jesus (1945) and Christianity: Its Economy and Way of Life (1945)
(vii) Several of Gandhi's followers developed a theory of environmentalism. Kumarappa took the lead in a number of relevant books in the 1930s and 1940s.
(viii) Historian Ramachandra Guha calls Kumarappa, "The Green Gandhian", portraying him as the founder of modem environmentalism in India.
(ix) Kumarappa worked for the Planning Commission of India and the Indian National Congress to develop national policies for agriculture and rural development.
(x) He also travelled to China, Eastern Europe and Japan on diplomatic assignments and to study their rural economic systems.
8.
Residual Claimant Theory of Wage:
(i) This theory was propounded by the American economist F.A.Walkar in 1875, in his book Political Economy.
(ii) According to this theory, wage is the residual portion after paying the remuneration of all the other three factors, namely, land, capital and organization.
(iii) Criticisms
(1) This theory does not explain the role of trade unions can secure higher wage for workers.
(2) Demand side of labour in the determination of wages needs to be considered.
9.
Kinds of profit:
(i) Monopoly Profit: Profit earned by the firm because of its monopoly control.
(ii) Windfall Profit: Some times, profit arises due to changes in price level. Profit is due to unforeseen factors.
(iii) Profit as functional reward: Just like rent, wage and interest, profit is earned by the entrepreneur for his entrepreneurial function.
10.
The marginal product of a factor is expressed as MPP, VMP and MRP.
(1) Marginal Physical Product (MPP)
The Marginal Physical Product of a factor is the increment in the total product obtained by the employment of an additional unit of that factor.
(2) Value of Marginal Product (VMP)
The Value of Marginal Product is obtained by multiplying the Marginal Physical Product of the factor by the price of product. Symbolically
VMP = MPP x Price
(3) Marginal Revenue Product (MRP)
The Marginal Revenue Product of a factor is the increment in the total revenue which is obtained by the employment of an additional unit of that factor,
MRP = MPP x MR
11.
Long-Run Equilibrium of the Firm and the Group Equilibrium:
In the short run a firm under monopolistic competition may earn super normal profit or incur loss. But in the long run, the entry of the new firms in the industry will wipe out the super normal profit earned by the existing firms. The entry of new firms and exit of loss-making firms will result in normal profit for the firms in the industry. In the long run, AR curve is more elastic or flatter, because plenty of substitutes are available. Hence, the firms will earn only normal profit.
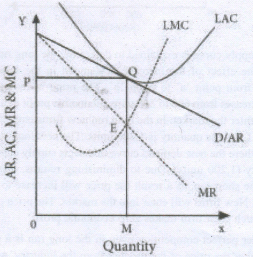
The only one condition. for equilibrium in the short run: MC = MR
The two conditions for equilibrium in the long run: MC = MR and AC = AR.
In the diagram equilibrium is achieved at point 'E'. The equilibrium output is 'OM' and the equilibrium price is 'OP'. The average revenue at the equilibrium output is 'MQ' and the average cost is also 'MQ'. Thus, in the long run under monopolistic competition, there is equilibrium when AR = AC and MC = MR. It means that a firm earns normal profit, AR is tangent to the Long Run Average Cost (LAC) curve at point 'Q'.
12.
Total Revenue:
Total revenue is the amount of income received by the firm from the sale of its products. It is obtained by multiplying the price of the commodity by the number of units sold.
TR = p x Q
where, TR denotes Total Revenue, P denotes Price and
Q denotes Quantity sold.
For example, a cell-phone company sold 100 cell-phones at the price of t500 each. TR is
Rs.50,000. (TR= 500 x 100 = 50,000).
Total Revenue - Constant Price
| Quantity sold (Q) |
Price (P) |
Total Revenue (TR) |
|
1 |
5 |
5 10 15 20 2 30 |
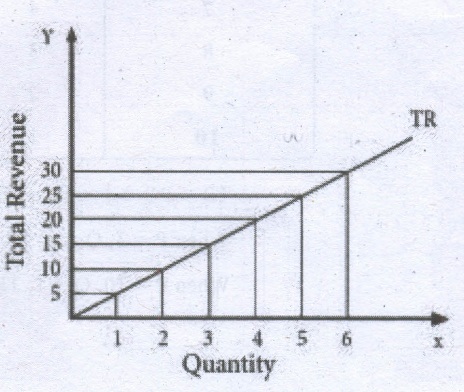
When price is constant, the behaviour of TR is shown in the table and the diagram, assuming P = 5. When P = 5; TR = PQ
When price is declining with increase in quantity sold. (Eg. Imperfect Competition on the goods market) the behaviour of TR is shown in the table and in the diagram. TR can be obtained from Demand function: If Q = 11-P, When P = 1, Q = 10
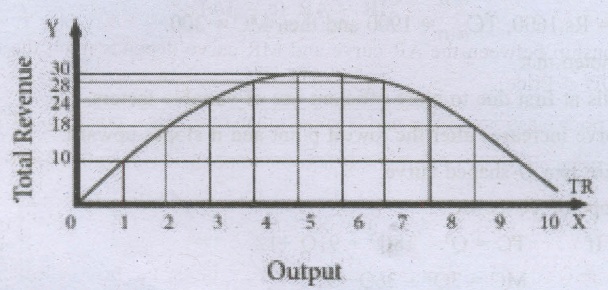
Total Revenue - Price declining
| Quantity sold (Q) | Price (P) | Total Revenue (TR) |
|
1 |
10 |
10 |
TR = PQ = 1 x 10 = 10
When P = 3, Q = 8, TR = 24
When P = 10, Q = 1, TR = 10
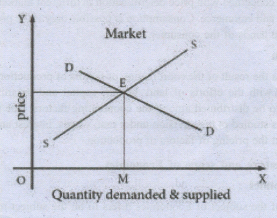
13.
(a) Stable Equilibrium
Prof. Stigler states that "equilibrium is a position from which there is no net tendency to move". Its absence is referred to as disequilibrium. Consumer's equilibrium occurs when he gets maximum satisfaction. The equilibrium of the producer occurs when he gets maximum profit. A resource is in equilibrium when it gets fully employed and gets its maximum payment. Thus, static equilibrium is based on given and constant prices, quantities, income, technology, population etc.
(b) Particular Equilibrium and General Equilibrium
An equilibrium, when it pertains to a single variable, may be called particular equilibrium. An equilibrium, on the other hand, when it relates to numerous variables or even the economy as a whole, may be called general equilibrium.
14.
Types of Utility: The following are the types of utility
(1) Form Utility: An individual consumer obtains utility from a good or service only when it is available in a particular form. Raw materials in their original form may not possess utility for a consumer. But in their changed forms as they become finished products, they provide utility to him. For example, cotton as a raw material may not possess utility for a consumer; but as it gets a new form as a cloth, it yields the consumer utility.
(2) Time Utility: A sick man derives time utility from blood not at the time of its donation, but only at the operation-time, i.e., when it is used.
(3) Place Utility: A student derives place utility from a book not at the place of its publication (production centre) but only at the place of his education (consumption centre).
(4) Service Utility: An individual consumer derives service utility from a service made available at the time when he most needs it. For example, clients obtain service utility from their lawyers, patients derive service utility from the doctors and so on.
(5) Possession Utility: When a student buys a book or dictionary from a bookseller, then only it gives utility.
(6) Knowledge Utility: It is the utility derived by having knowledge of a particular thing. Advertisement serves as a source of information on an object.
15.
Growth definition :
Samuelson Paul Samuelson defines Economics as "the study of how men and society choose, with or without the use of money, to employ scarce productive resources which could have alternative uses, to produce various commodities over time, and distribute them for consumption, now and in the future among various people and groups of society".
The major implications of this definition are as follows:
(a) Like Robbins, Samuelson states that the means are scarce in relation to unlimited ends and that such means could be put to alternative uses.
(b) Samuelson makes his definition dynamic by including the element of time in it. Therefore, his definition covers the theory of economic growth.
(c) Samuelson's definition is applicable also in a barter economy, where money is not used.
(d) His definition covers various aspects like production, distribution and consumption.
(e) Samuelson treats Economics as a social science, whereas Robbins regards it as a science of individual behaviour of all the definitions discussed above, the 'growth' definition stated by Samuelson appears to be the most satisfactory.
16.
Wealth Definition: Adam Smith
(i) Adam Smith (1723 - 1790), in his book "An Inquiry into Nature and Causes of Wealth of Nations" (1776) defines "Economics c the science of wealth".
(ii) He explains how a nation's wealth is created and increased. He considers that the individual in the society wants to promote his own gain and in this process, he is guided and led by an "invisible hand".
(iii) He states that every man is motivated by his self interest This means that each person works for his own good.
(iv) Smith favours the introduction of "division of labour" to increase the quantum of output.
(v) Severe competition in factories and society helps in bettering the product.
(vi) Supply force is very active and a commodity is made available to the consumers at the lowest price.
Criticism:
(vii) For Smith, Economics consists of 'wealth-getting' activities and 'wealth-spending' activities.
(viii) An undue emphasis is given to material wealth. Wealth is treated to be an end in itself.
(ix) This view leads him to ignore human welfare as an essential part of Economics. Smith gives his definition when religious and spiritual values are held high.
(x) Ruskin and Carlyle regard Economics as a 'dismal science', "pig science" etc. as it teaches selfishness which is against ethics.
17.
Several remedial measures have been introduced to reduce rural indebtedness.
i) It includes regulation of money lenders,
ii) Development of rural banks, Regional Rural Banks (RRBs), Micro Finance, Formation of Self Help Groups (SHGs), Primary Cooperative Banks and Land Development Banks, Crop Loan Schemes, Lead Bank Schemes
(iii) Micro units Development and Refinance Agency Bank(MUDRA),
(iv) Promotion of subsidiary occupation, off farm employment opportunities, skill development programmes
(v) The interest rate charged plus transaction cost for poor people and Self Help Groups are much higher as compared to that for rich people.
18.
Market: The term market refers to a system of exchange between the buyers and sellers of commodity that are carried out through correspondence, telephones, online, email, etc.
Classification of Markets: Market is of various kinds. They are classified:-
On the basis of Area:
The market is classified not only on its graphical spread, but also on the nature of the goods exchanged.
i) Local Market arises when production (or) services are sold and bought in the place of their production perishable and semidurable in nature. (ex-vegetable, fruits, etc.)
ii) Provincial Market arises when products (or) services are sold arid bought in a restricted circle. (ex-provincial newspaper)
iii) National Market arises when products and services are sold and bought throughout a country. (ex-Nation wide market for tea, coffee, cement, electrical goods, etc.)
iv) International Market arises when products (or) service are sold and bought at the world level. (ex-petrol, gold, etc.)
On the basis of Time:
Alfred Marshall classifies market on the basis of time. The time here refers to the nature of factors, such as fixed and variable factors used in the production process, and how the supply of products meets with varying demand situation in the determination of price of the products.
i) Very short period (or) market period.
ii) Short period market.
iii) Long period market.
iv) Very long period (or) a secular period market.
On the basis of Quantity:
i) whole-sale market is for bulk selling and buying of goods. The price is likely to below compared to retail ma kets. (clothing)
ii) Retails market is for selling (or) buying of commodities in small quantities. (vegetable)
On the basis of Competition:
i) Perfect competition.
ii) Imperfect competition market.
(a) Monopoly market.
(b) Monopolistic competition market.
(c) Duopoly market.
(d) Oligopoly market
19.
Total Cost:
Total cost means the sum total of all payments made in the production. It is also called as total cost of production.
TC = TFC + TYC
For example, when the total fixed cost is Rs.1000 and the total variable cost is Rs. 200 then the total cost is Rs.1200 (Rs.1000 + Rs.200)
IF TFC = 12 and
TYC = Q3 -18Q2 + 91Q
TC = 12 + Q3 - 18Q2 + 91Q
| Output (in unit) |
Total Fixed Cost (TFC) (in Rs) |
Total Variable Cost (TVC) (in Rs) |
Total Cost (TC) TFC+TVC (in Rs) |
| 0 | 1000 | 0 | 1000 |
| 1 | 1000 | 200 | 1200 |
| 2 | 1000 | 300 | 1300 |
| 3 | 1000 | 400 | 1400 |
| 4 | 1000 | 500 | 1500 |
| 5 | 1000 | 600 | 1600 |
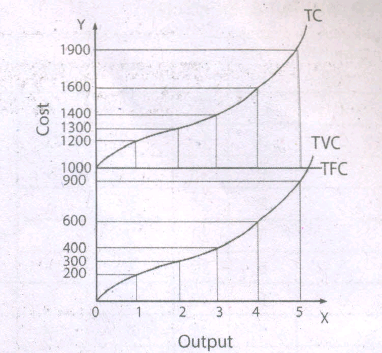
It is to be noted that,
a) The TC curve is obtained by adding TFC + TVC curves vertically.
b) TFC curve remains parallel to x-axis indicating a straight line.
c) TVC starts from the organ and move upwards as no variable cost is incurred at zero output.
d) When TFC + TVC are added, TC starts from TFC and move upwards.
e) TC curve lies above the TVC curve.
f) TVC and TC curves are the same shapes but beginning point is different.
20.
Relationship among TR, AR, MR Curves:
When marginal revenue is positive, total revenue rises, when MR is zero, the total revenue becomes maximum. When marginal revenue becomes negative, total revenue starts falling. When AR and MR both are falling, then MR falls at a faster rate than AR.
TR, AR, MR and Elasticity of Demand:
The relationship among AR, MR and elasticity of demand (e) is stated as follows.
MR = AR (e-i/e)
The relationship between the AR curve and MR curve depends upon the elasticity of AR curve (AR = DD = Price).
a) When price elasticity of demand is greater than one, MR is positive and TR is increasing.
b) When price elasticity of demand is less than one, MR is negative and TR is decreasing.
c) When price elasticity of demand is equal to one, MR is equal to zero and TR is maximum and constant.
It is to be noted that, the output range of 1 to 5 units, the price elasticity of demand is greater than one according to total out by method. Hence TR is increasing and MR is positive.
TR, AR, MR & Elasticity
| Quantity (Q) |
Price (P) |
TR | AR | MR | Elasticity |
| 0 | 11 | 0 | 11 | - | e > 1 |
| 1 | 10 | 10 | 10 | 10 | |
| 2 | 9 | 18 | 9 | 8 | |
| 3 | 8 | 24 | 8 | 6 | |
| 4 | 7 | 28 | 7 | 4 | |
| 5 | 6 | 30 | 6 | 2 | |
| 6 | 5 | 30 | 5 | 0 | e = 1 |
| 7 | 4 | 28 | 4 | -2 | e > 1 |
| 8 | 3 | 24 | 3 | -4 | |
| 9 | 2 | 18 | 2 | -6 | |
| 10 | 1 | 10 | 1 | -8 | |
| 11 | 0 | 0 | 0 | -10 |
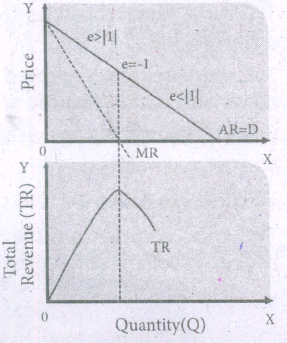
At the output range of 5 to 6 units, the price elasticity of demand is equal to one. Hence TR is maximum and MR equals to zero.
At the output range of 6 units to 10 units, the price elasticity of demand is less than unity. Hence TR is decreasing and MR is negative.
21.
Large Scale Industries:
The term "Large Scale Industries" refers to those industries which require large infrastructure, manpower and a huge influx of capital assets. The following are the major large scale industries in India.
Iron and Steel Industry:
i) First steel industry at Kulti near Jharia, West Bengal - Bengal Iron Works Company in 1870.
ii) First Large Scale Steel Plant TISCO at Jamshedpur in 1907 followed by IISCO at Burnpur in 1919. Both belong to Private Sector.
iii) The First Public Sector unit was "Vishveshvarava Iron and Steel Works" at Bhadrawati.
iv) Steel Authority of India Ltd. (SAIL) was established in 1974 and was made responsible for the development of the Steel industry.
v) Presently India is the eighth largest steel producing country in the world.
Cotton and Textile Industry:
i) Oldest industry of India and employs largest number of workers.
ii) 20% manufacturing value added and one third of total export earnings.
iii) The first Indian modernised cotton cloth mill established in 1818 at Fort Gloaster near Calcutta. The second mill named "Mumbai's Spinning and Weaving Co." was established in 1854 at Bombay by KGN Daber.
Sugar Industry:
i) Sugar Industry is the second larges industry among agricultural based industries in India.
ii) Maharashtra contributes over one third of the Indian total sugar output, followed closely by
Uttar Pradesh.
Fertiliser Industry:
India is the third largest producer of nitrogenous fertilisers in the world.
paper Industry:
i) The first mechanised paper mill was set up in 1812 at Serampur in West Bengal.
ii) The paper industry in India is ranked among the 15 top global paper industries.
Skill Industries:
i) India is the second largest (first-China) country in the world in producing natural silk.
ii) India enjoys the distinction of being only country producing all the five commercial varieties of silk - Mulberry, Tropical Iussat Oak Tussar, Eri and Muga.
Petroleum and Natural Gas:
i) First oil well was dug in India in 1889 at Digboi, Assam.
ii) For exploration purpose Oil and Natural Gas Commission (ONGC) was established in 1956 at Dehradun, Uttarakhand.
22.
Definition: The Price Elasticity of Demand is commonly known as the elasticity of demand which refers to the degree of responsiveness of demand to the change in the price of the commodity.
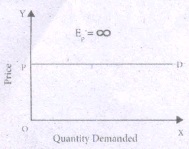
i. Perfectly Elastic Demand (Ep = \(\infty \)):
The demand is said to be perfectly elastic when a slight change in the price of a commodity causes an infinite. change in its quantity demanded. Such as, even a small rise in the price of a commodity can result in greater fall in demand even to zero. In some cases a little fall in the price can result in the increase in demand to infinity. In perfectly elastic demand the demand curve is a horizontal straight line parallel to x axis.
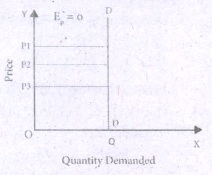
ii. Perfectly Inelastic Demand (Ep = 0)
When there is no change in the product due to the change in the price, then the demand is said to be perfectly inelastic. Here, the demand curve is a vertical straight line which shows that the demand remains unchanged irrespective of change in the price., i.e. quantity OQ remains unchanged at different prices, P1P 2, and P3.
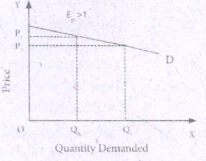
iii. Relatively Elastic Demand: (Ep > 1)
The demand is relatively elastic when the proportionate change in the demand for a commodity is greater than the proportionate change in Its price. Here, the demand curve is gradually sloping which shows that a proportionate change in quantity from 5 to 10 is greater than the proportionate change in the price from 11 to 10. Change in demand is: 10-5/5 x 100 = 100%
Change in price =10%. Hence, it is more elastic demand.
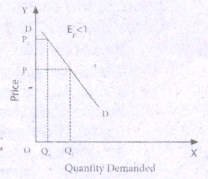
Relatively Inelastic Demand: (Ep < 1)
When the proportionate change in the demand for a product is less than the proportionate change in the price, the demand is said to be relatively inelastic. It is also called as the elasticity less than unity. Here the demand curve is steeply sloping, which shows that the change in the quantity from OQ0 to OQ1 is relatively smaller than the change in the price from OP1 to OP2.
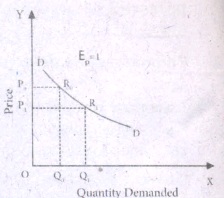
v. Unitary Elastic Demand (Ep = 1):
The demand is unitary elastic when the proportionate change in the price of a product results in the same propionate change in the quantity demand here the shape of the demand curve is a rectangular hyperbola, which shows that area under the curve is equal to one. Here OP0R 0Q 0= OP 1R 1Q 1.
23.
(i) The major achievement of the new strategy was to boost the production of major cereals viz., wheat and rice.
(ii) The green revolution was confined only to High Yielding Varieties (HYV) cereals, mainly rice, whar maize and jowar.
(iii) This Strategy was mainly directed to increase the production of commercial crops or cash crops such as sugarcane, cotton, Jute, Oilseeds and potatoes.
(iv) Per hectare productivity of all crops Had increased due to better seeds.
(v) Due to Multiple cropping and more use of chemical fertilizers the demand for labour increased.
24.
1. Changes in Tastes and Fashions
The demand for some goods and services is very susceptible to changes in tastes and fashions.
2. Changes in Weather: An unusually
dry summer results in a increase in the demand for cool drinks.
3. Taxation and Subsidy
If fresh taxes are levied or the existing rates of taxation on commodities are increased their prices go up. The subsidies will bring down the prices. Therefore taxes reduce demand and subsidies raise demand.
4. Changes in Expectations
Expectations also bring about a change in demand. Expectation of rise in price in future. results in increase in demand.
5. Changes in Savings
Savings and demand are inversely related.
6. State of Trade Activity:
During the periods of boom and prosperity, the demand for all commodities tends to increase. On the contrary, during times of depression there is a general slackening of demand.
7. Advertisement
In advanced capitalistic countries advertising is a powerful instrument increasing the demand in the market.
8. Changes in Income
An increase in family income may increase the demand for durables like video recorders and refrigerators. Equal distribution of income enables poor to get more income. As a result consumption level increases.
9. Change in Population
The demand for goods depends on the size of population. An increase in population tends to increase the demand for goods and a decrease in population.
25.
(i) During the British rule stunned the growth of Indian enterprise.
(ii) The economic policies of British checked and retarded capital formation in India.
(iii) Indian agriculture sector became stagnant and deteriorated.
(iv) The British rule in India led the collapse of handicraft industries.
(v) The drain of wealth financed capital development in Britain.

11th Standard Syllabus & Materials
11th Standard
TN 11th Tamil பீடு பெற நில் - செய்யுள் - காவடிச்சிந்து Important Questions And Answers Study Material - QB365 Set A
NEW11th Standard
TN 11th Tamil பீடு பெற நில் - உரைநடை - மலை இடப்பெயர்கள் : ஓர் ஆய்வு Important Questions And Answers Study Material - QB365 Set A
NEW11th Standard
TN 11th Tamil மாமழை போற்றுதும் - துணைப்பாடம் - யானை டாக்டர் Important Questions And Answers Study Material - QB365 Set A
NEW11th Standard
TN 11th Tamil மாமழை போற்றுதும் - செய்யுள் - ஐங்குறுநூறு Important Questions And Answers Study Material - QB365 Set A



Tamilnadu Stateboard 11th Standard Subjects

Maths

Commerce
Economics

Biology

Business Maths and Statistics

Accountancy

Computer Science

Physics

Chemistry
Maths
Biology
Economics
Physics
Chemistry

History
Business Maths and Statistics

Computer Science
Accountancy

Computer Applications
History
Computer Technology
Commerce
Computer Applications
Computer Technology

Tamil

English

French
Tamilnadu Stateboard Standards



