
 100% FREE ACCESS
7th Standard CBSE Syllabus & Materials
7th Standard CBSE
CBSE 7th Social Science Theme E - Understanding Market - New Sample Question Papers Study Material - QB365 Set A
NEW7th Standard CBSE
CBSE 7th Social Science Theme E - From Barter to Money - New Sample Question Papers Study Material - QB365 Set A
NEW7th Standard CBSE
CBSE 7th Social Science Theme D - The Constitution of India- An Introduction - New Sample Question Papers Study Material - QB365 Set A
NEW7th Standard CBSE
CBSE 7th Social Science Theme D - From the Rulers to the Ruled : Types of Governments - New Sample Question Papers Study Material - QB365 Set A
NEW7th Standard CBSE
CBSE 7th Social Science Theme B - The Age of Reorganisation - New Sample Question Papers Study Material - QB365 Set A
NEW7th Standard CBSE
CBSE 7th Social Science Theme B - The Rise of Empires - New Sample Question Papers Study Material - QB365 Set A

Published on: 05/03/2019
Data Handling Important Questions
Download CBSE Class 7th Standard CBSE Mathematics question papers, sample papers, important questions, and previous year solved papers in PDF format. Get free study materials, NCERT solutions, and exam preparation resources for Class 7th Standard CBSE Mathematics
Questions + Answers key
Take MCQ Mathematics Test
1.
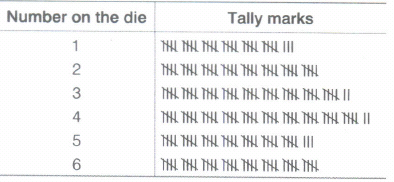
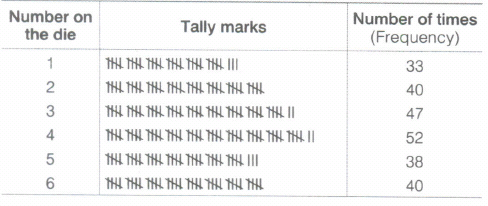
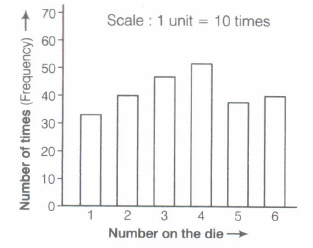
After threw a die 250 times and got the following table. Draw a bar graph for this data
2.
Use the following bar graph to answer the questions:
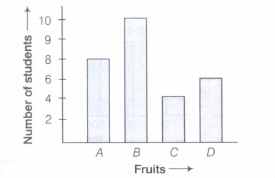
A = Orange; B = Mango; C = Grapes; D = Apple
Which is the least popular fruit among the students?
3.
The graph below shows the number of books sold by a bookstore in a week:
.png)
One which day was the most number of books sold?
4.
Consider this data collected from a survey of two towns
| Mobile Brands \(\rightarrow\) Town \(\downarrow\) |
Nokia | Samsung | Micromax |
| A | 1096 | 1200 | 875 |
| B | 820 | 1000 | 730 |
Which brand has least popularity in town B?
5.
Number of children in six different classes are given below:
| Class | Number of children |
|---|---|
| VI | 100 |
| VII | 120 |
| VIII | 130 |
| IX | 90 |
| X | 125 |
| XI | 110 |
Find the ratio of the number of students of Classes VI and XI
6.
Consider this data collected from a survey of a colony
| Favourite Sport | Cricket | Basket Ball | Swimming | Hockey | Athletics |
|---|---|---|---|---|---|
| Watching | 1240 | 470 | 510 | 430 | 250 |
| participating | 620 | 320 | 320 | 250 | 105 |
Draw a double bar graph choosing an appropriate scale. What do you infer from the bar graph?
7.
The bar graph given below shows the marks of students of a class in a particular subject
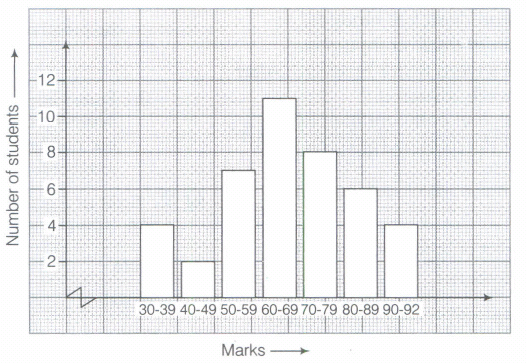
If 40 is the pass mark, then how many students have failed?
8.
The enrolment in a school during six consecutive years was as follows:
1555,1670,1750,2013,2540,2820
Find the mean enrolment of the school for this period
9.
Following table shows the points of each player scored in four games
| Players | Game | Game | Game | Game |
|---|---|---|---|---|
| 1 | 2 | 3 | 4 | |
| A | 14 | 16 | 10 | 10 |
| B | 0 | 8 | 6 | 4 |
| C | 8 | 11 | Did not play | 13 |
To find the mean number of points per game for C, would you divide the total points by 3 or by 4? Why?
10.
Organise the following marks in a class assessment,in a tabular form: 4, 6, 7, 5, 3, 5, 4, 5, 2, 6, 2, 5, 1, 9, 6, 5, 8, 4, 6, 7 - Which number is the highest?
11.
There are 6 iron-plates marked as \(\boxed { 1 } ,\boxed { 2 } ,\boxed { 3 } ,\boxed { 4 } ,\boxed { 5 } and\boxed { 6 } \)
One of them is to be taken out without seeing them. Find the probability of a plate marked \(\boxed { 3 } \) is taken out.
12.
Answer the following questions with the help of Example 1 bar graph:
If 40 is the pass marks, then name the subjects in which he got less than pass marks.
13.
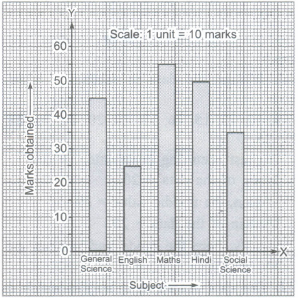
Following table shows the marks obtained in various subjects by Prabhat in an Examination Represent the given data on a bar graph
| Subject | General science | English | Maths | Hindhi | Social science |
| Marks obtained | 45 | 25 | 55 | 50 | 35 |
14.
Find the median of the data :
21,15, 6, 25, 18, 13, 20, 9, 8, 12
15.
Given below are the ages of 25 students of class VIII in a school. Prepare a discrete frequency distribution.
15, 16, 16, 14, 17, 17, 16, 15, 15, 16, 16, 17, 15, 16, 16, 14, 16, 15, 14, 15, 16, 16, 15, 14, 15
16.
Rahul scored the following number of runs in six innings:
34,37,47,49, 54, 61 Calculate the mean runs scored by him per inning.
17.
Find the mean of the first ten even natural numbers.
18.
A survey of 100 persons showed that 75 like cricket while 25 dislike it. One person is chosen at random. What is the probability that the chosen person - Dislike Criket
19.
There are 8 marbles in a bag. If the numbers from 1 to 8 are marked on each of them. Then, what is the probability of drawing a marble with number 2?
20.
The marks (out of 100) obtained by a group of students in a Science test are 85, 76, 90, 85, 39, 48, 56,95,81 and 75. Find the highest and the lowest marks obtained by the students.
21.
The cards bearing letter of the word "MATHEMATICS" are placed in a bag. A card is taken out from the bag without looking into the bag (at random).
(a) How many outcomes are possible when a letter is taken out of the bag at random?
(b) What is the probability of getting:
(i) M?
(ii) Any vowel?
(iii) Any consonant?
(iv) X?
22.
The results of pass percentage of Class X and XII in C.B.S.E.examination for 5 years are given in the following table:
| year | X | XI |
| 1994-95 | 90 | 95 |
| 1995-96 | 95 | 80 |
| 1996-97 | 90 | 85 |
| 1997-98 | 80 | 90 |
| 1998-99 | 98 | 95 |
Draw bar graphs to represent the data.
23.
Find atleast 5 numbers between \(\frac{1}{2}\) and \(\frac{1}{3}\)
24.
Age (in years) of 6 children of two groups are recorded as below
| Age(in years) | |
|---|---|
| Group A | Gropu B |
| 7 | 7 |
| 7 | 9 |
| 9 | 11 |
| 8 | 12 |
| 10 | 12 |
| 10 | 12 |
(a) Find the mode and range for each group.
(b) Find the range and mode, if the two groups are combined together
25.
Sale of Mathematics and Hindi books in the years 1999, 2000, 2001 and 2002 are given below:
| Years | 1999 | 2000 | 2001 | 2002 |
|---|---|---|---|---|
| Mathematics | 450 | 400 | 410 | 540 |
| Hindi | 490 | 480 | 540 | 610 |
Can you say that the demand for Mathematics book rose faster?
26.
Number of children in six different classes are given below:
| Class | Number of children |
| 6 | 400 |
| 7 | 350 |
| 8 | 320 |
| 9 | 280 |
| 10 | 225 |
| 11 | 200 |
In how many classes is the number of childern less than 500?
2
4
5
6
27.
Sale of Mathematics and English books in the year 2005, 2006, 2007 and 2008 are given below:
| Years | Mathematics | English |
| 2005 | 200 | 1000 |
| 2006 | 300 | 250 |
| 2007 | 400 | 200 |
| 2008 | 500 | 500 |
In which year is the difference in the sale minimum?
2008
2007
2006
2005
28.
Read the following bar graph and answer the question
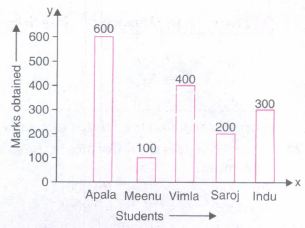
How many girls have got marks more than 100?
2
3
4
1
29.
Read the following bar graph and answer the question
The difference between maximum and minimum marks is
100
200
400
500
30.
A coin is tossed. What is the probability of getting tail?
1
\(\frac { 1 }{ 2 } \)
2
0
31.
The number of tourists visiting a historical place in a week is shown in the following table
| Day | Number of tourists |
| Monday | 65 |
| Tuesday | 72 |
| Wednesday | 98 |
| Thursday | 84 |
| Friday | 60 |
| Saturday | 108 |
| Sunday | 160 |
The sum of the number of tourists visiting on Sunday and Friday is
160
60
220
100
32.
The number of tourists visiting a historical place in a week is shown in the following table
| Day | Number of tourists |
| Monday | 65 |
| Tuesday | 72 |
| Wednesday | 98 |
| Thursday | 84 |
| Friday | 60 |
| Saturday | 108 |
| Sunday | 160 |
On which day is the number of tourists minimum?
Friday
Monday
Thursday
Saturday
33.
The mean of 1, 4, 1, 2, 0, 1, 5, 4, 2, 2 is:
11
2.2
2
5
34.
Range of data is equal to:
highest value + lowest value
highest value - lowest value
highest value x lowest value
highest value -i- lowest value
35.
In a school, only 2 out of 5 students can participate in quiz. What is the chance that a student picked at random makes it to the competition?
20%
40%
50%
30%
36.
The median of the data 40, 50, 99, 68, 98, 60, 94 is
40
60
68
99
37.
Which of the following is the mean of first five natural numbers?
2
3
4
5
38.
The money saved by a student during first six days of a week are Rs. 46, Rs. 24, Rs 29, Rs 27, Rs. 4 and Rs 42. Find the average saving per day.
42
39
35
36
39.
The median of the data 2, 16, 29, 88, 49, 99,16,4,37 is
16
29
99
88
40.
For a given data there be ___________more than one mode. [can/cannot]
1.
To draw a bar graph of given data, first we make a frequency table, which is as follows
2.
Clearly, from the bar graph, grapes is liked by 4 students. So, the least popular fruit among the students is grapes.
3.
Saturday
4.
Micromax
5.
10:11
6.
Required 'double bar graph' is shown below
.png)
It is inferred that more people prefer cricket and less athletics
7.
If 40 is the pass mark, then students who getting less than 40 marks have failed. Hence, from the bargraph we can see students getting marks between 30-39 have failed i.e. 4 students have failed
8.
Given, the enrolment of a school during six consecutive years
1555,1670,1750,2013,2540,2820
Now, sum of enrolments
= 1555 + 1670 + 1750 + 2013 + 2540 + 2820 = 12348
Number of years = 6
\(\therefore\) Mean enrolment of the school for this period
= \(\frac { sum\quad of\quad enrolments }{ number\quad of\quad years } =\frac { 12348 }{ 6 } =2058\)
Hence, the mean enrolment of the school for this period is 2058.
9.
To find the mean number of points per game for C, we divide the total points by 3, because C did not play 3rd game.
10.
The frequency table is shown below.
| Marks | Tally Marks | Number of students (Frequency) |
|---|---|---|
| 1 | I | 1 |
| 2 | II | 2 |
| 3 | I | 1 |
| 4 | III | 3 |
| 5 | IIII | 5 |
| 6 | IIII | 4 |
| 7 | II | 2 |
| 8 | I | 1 |
| 9 | I | 1 |
| Total | 20 |
It is clear from the table that, the highest number = 9
11.
Total number of plates = 6
i.e. The total number of outcomes = 6
.. Probability of the plate \(\boxed { 3 } \) is taken out. \({ P }_{ \boxed { 3 } }=\frac { 1 }{ 6 } \)
12.
He obtained less than pass marks in English and Social Science
13.
Let us start the scale at 0. The greatest value in the data is 55, therefore we can end the scale at the value greater than 55 (such as at 60). Since all the bars would lie between °and 60, therefore we choose the scale such that the distance between °and 60 is neither too long nor too small. Here, the most appropriate scale is '1 unit for 10 marks'. We draw the bar graph as follows:
14.
Arranging in ascending order:
6,8,9,12,13,15,18,20,21,25
Since number of observations is even, the median is given by finding the average or mean of the two middle most observations:
So, median \(=\frac{13+15}{2}=\frac{28}{2}=14\)
15.
Frequency distribution of ages of 25 students:
| Age | Tally marks | Frequency |
| 14 | IIII | 4 |
| 15 |  |
8 |
| 16 |  |
10 |
| 17 | III | 3 |
| Total | 25 |
16.
Rahul score runs per inning are as follows: 34,37,47,49,54,61
\(Mean=\frac{Sum\ of\ the\ data}{Number\ of\ data}\)
\(=\frac{34+37+47+49+54+61}{6}\)
\(=\frac{282}{6}=47\)
17.
First ten even natural numbers = 2, 4, 6,8,10, 12, 14, 16, 18,20
\(mean=\frac { sum\ of\ all\ obsevations }{ number\ of\ observations } \)
Sum of all observations = 2 + 4 + 6 + 8 + 10+ 12 +14+16+18+ 20=110
\(\therefore\) Mean = \(\frac { 110 }{ 10 } =11\)
18.
\(\frac { 1 }{ 4 } \)
19.
Total number of marbles = 8, Total number of possible outcomes = 8
\(\therefore\) P(drawing marble with number 2) = \(\frac { Number\ of\ favourble\ outcomes }{ Number\ of\ possible\ outcomes } =\frac { 1 }{ 8 } \)
20.
Given, marks obtained by a group of students in a Science test
85,76,90,85,39,48,56,95,81,75
On rearranging the marks in ascending order, we get
39,48,56,75,76,81,85,85,90,95
It is clear from the ascending order of marks that, highest marks = 95 and lowest marks = 39
21.
(a) There are 11 outcomes namely M, M, A, A, T, T, H, E,I, C, S.
(b) (i) Probability of getting \('M'=\frac{2}{11}\)
(ii) Probability of getting a vowel \(=\frac{4}{11}\)
(iii) Probability of getting a consonant \(=\frac{7}{11}\)
(iv) Probability of getting \(X=0=\frac{0}{11}\)
22.
We go through the following steps to construct the bar graphs:
(a) We draw two lines perpendicular to each other on a graph paper and call them horizontal and vertical axes as shown in Fig. below :
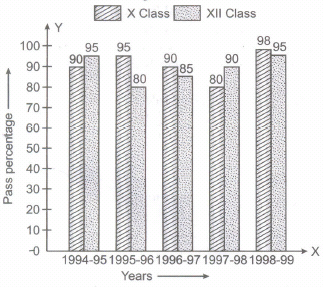
(b) Along the horizontal axis, we mark the 'years' and along the vertical axis, we mark the 'pass percentage.
(c) We choose a suitable scale to determine the heights of bars. Here, we choose the scale as 1 big division to represent 10.
(d) First we draw the bars for Class X results and then bars for Class XII results for different years.
Bars for X and XII class results are shaded separately and the shading is shown in the top right comer of the graph paper.
23.
Given numbers are \(\frac{1}{2}\) and \(\frac{1}{3}\)
1st number=\(\frac { Sum\ of\ given\ numbers }{ Number\ of\ digits } =\frac { \frac { 1 }{ 2 } +\frac { 1 }{ 3 } }{ 2 } =\frac { \frac { 3+2 }{ 6 } }{ 2 } \)
=\(\frac { 5 }{ 6\times 2 } =\frac { 5 }{ 12 } \)
=\(\frac { 5 }{ 6\times 2 } =\frac { 5 }{ 12 } \)
=\(\frac { 1 }{ 2 } >\frac { 5 }{ 12 } >\frac { 1 }{ 3 } \)
2nd number=\(\frac { Given\ number+1st\ number }{ 2 } \)
=\(\frac { \frac { 1 }{ 2 } +\frac { 5 }{ 12 } }{ 2 } =\frac { \frac { 6+5 }{ 12 } }{ 2 } =\frac { 11 }{ 12\times 2 } =\frac { 11 }{ 24 } \)
\(\frac { 1 }{ 2 } >\frac { 11 }{ 24 } >\frac { 5 }{ 12 } >\frac { 1 }{ 3 } \)
Similarly, 3rd number=\(\frac { \frac { 5 }{ 12 } +\frac { 1 }{ 3 } }{ 2 } =\frac { \frac { 5+4 }{ 12 } }{ 2 } =\frac { 9 }{ 12\times 2 } =\frac { 9 }{ 24 } \)
\(\frac { 1 }{ 2 } >\frac { 11 }{ 24 } >\frac { 5 }{ 12 } >\frac { 9 }{ 24 } >\frac { 1 }{ 3 } \)
4th number=\(\frac { \frac { 5 }{ 12 } +\frac { 11 }{ 24 } }{ 2 } =\frac { \frac { 10+11 }{ 24 } }{ 2 } =\frac { 21 }{ 24\times 2 } =\frac { 21 }{ 48 } \)
\(\frac { 1 }{ 2 } >\frac { 11 }{ 24 } >\frac { 21 }{ 48 } >\frac { 5 }{ 12 } >\frac { 9 }{ 24 } >\frac { 1 }{ 3 } \)
5th number=\(\frac { \frac { 5 }{ 12 } +\frac { 9 }{ 24 } }{ 2 } =\frac { \frac { 10+9 }{ 24 } }{ 2 } =\frac { 10+9 }{ 24\times 2 } =\frac { 19 }{ 48 } \)
\(\frac { 1 }{ 2 } >\frac { 11 }{ 24 } >\frac { 21 }{ 48 } >\frac { 5 }{ 12 } >\frac { 19 }{ 48 } >\frac { 9 }{ 24 } >\frac { 1 }{ 3 } \)
Hence 5 numbers between \(\frac { 1 }{ 2 } \) and \(\frac { 1 }{ 3 } \)are \(\frac { 11 }{ 24 } ,\frac { 21 }{ 48 } ,\frac { 5 }{ 12 } ,\frac { 19 }{ 48 } \) and \(\frac { 9 }{ 24 } \)
24.
From the given table, age of children in group A
=7yr,7yr,9yr,8yr, 10yr, 10yr
Age of children in group 8
= 7yr , 9yr, 11 yr, 12yr, 12yr, 12yr
(a) Mode in group A = 7 yr and 10 yr
( \(\because\) 7 y rand 10 yr occurs 2 times)
Range in group A = Maximum value - Minimum value
=10-7=3
Mode in group 8= 12 yr
Range in group 8=12 -7 = 5
(b) If both groups are combined together 7, 7, 7, 9, 9,11,8, 12, 10, 12, 10, 12
Mode = 7 and 12 [\(\because\) 7 and 12 occurs 3 times]
Range = Maximum value - Minimum value
=12-7=5
25.
On the basis of given data, we can draw the following double bar graph:
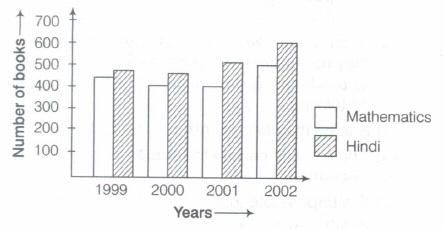
The demand of Mathematics subject books rose from 1999 to 2002
= 540-450=90
The demand of Hindi subject books rose from 1999 to 2002
= 610 - 490 =120 books
\(\because\) 120 > 90
So, the demand of Hindi books rose faster than Mathematics books.
26.
In each class, number of students < 500
27.
2008 ⟶500 - 500 = 0
28.
200, 300, 400, 500⟶ 4.
29.
600 -100 = 500
30.
A coin has two faces
31.
(c)
220
32.
Friday⟶60.
33.
(b)
2.2
34.
(b)
highest value - lowest value
35.
(b)
40%
36.
(c)
68
37.
(b)
3
38.
39.
(b)
29
40.
()
can

7th Standard CBSE Syllabus & Materials
7th Standard CBSE
CBSE 7th Social Science Theme B - New Beginnings : Cities and States - New Sample Question Papers Study Material - QB365 Set A
NEW7th Standard CBSE
CBSE 7th Social Science Theme A - Climates of India - New Sample Question Papers Study Material - QB365 Set A
NEW7th Standard CBSE
CBSE 7th Social Science Theme A - Geographical Diversity of India - New Sample Question Papers Study Material - QB365 Set A
NEW7th Standard CBSE
CBSE 7th Science Earth, Moon and the Sun - New Sample Question Papers Study Material - QB365 Set A



CBSE 7th Standard CBSE Subjects
CBSE Standards




