
 100% FREE ACCESS
7th Standard CBSE Syllabus & Materials
7th Standard CBSE
CBSE 7th Social Science Theme E - Understanding Market - New Sample Question Papers Study Material - QB365 Set A
NEW7th Standard CBSE
CBSE 7th Social Science Theme E - From Barter to Money - New Sample Question Papers Study Material - QB365 Set A
NEW7th Standard CBSE
CBSE 7th Social Science Theme D - The Constitution of India- An Introduction - New Sample Question Papers Study Material - QB365 Set A
NEW7th Standard CBSE
CBSE 7th Social Science Theme D - From the Rulers to the Ruled : Types of Governments - New Sample Question Papers Study Material - QB365 Set A
NEW7th Standard CBSE
CBSE 7th Social Science Theme B - The Age of Reorganisation - New Sample Question Papers Study Material - QB365 Set A
NEW7th Standard CBSE
CBSE 7th Social Science Theme B - The Rise of Empires - New Sample Question Papers Study Material - QB365 Set A

Published on: 24/09/2019
Data Handling
Download CBSE Class 7th Standard CBSE Mathematics question papers, sample papers, important questions, and previous year solved papers in PDF format. Get free study materials, NCERT solutions, and exam preparation resources for Class 7th Standard CBSE Mathematics
Questions + Answers key
Take MCQ Mathematics Test
1.
The population of four major cities in India in a particular year is given below:
| City | Mumbai | Kolkata | Delhi | Chennai |
| Number of students | 120 | 130 | 150 | 80 |
Construct a bar graph to represent the above data.
2.
The following table shows the weight of 12 Players:
| Weight (in kg) | 48 | 50 | 52 | 54 | 58 |
|---|---|---|---|---|---|
| number of players | 4 | 3 | 2 | 2 | 1 |
Find the mode and mean weight.
3.
The mean marks of seven students are 55. The marks of 6 students are 52, 54, 55, 53, 56 and 54. Find the marks of seventh student
4.
A survey of 150 girls showed that 63 like tea while 87 dislike it. Out of these girls,C?r1e girl is chosen at random. What is the~obability that the chosen girls (i) like tea? (ii) dislike tea?
5.
Observe the following data:
| Government School, Chandpur | ||
|---|---|---|
| Daily Attendance | Date: 15.04.2009 | |
| Class | Total Students | Number of students present on that day |
| VI | 90 | 81 |
| VII | 82 | 76 |
| VIII | 95 | 91 |
| IX | 70 | 65 |
| X | 63 | 61 |
(a) Draw a double bar graph choosing an appropriate scale. What do you infer from the bar graph?
(b) Which class has the maximum number of students?
(c) In which class, the difference of total students and number of students present is minimum?
(d) Find the ratio of number of students present to the total number of students of Class IX,
(e) What percent of students of Class VI were absent?
6.
Study the double bar graph shown below and answer the questions that follow:
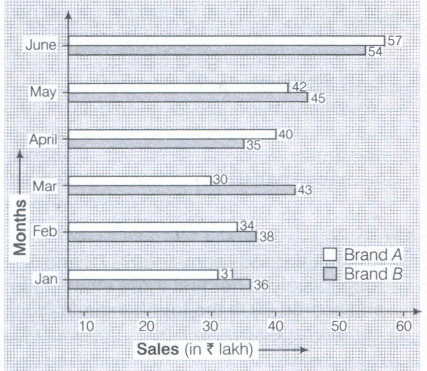
(a) What information is represented by the above double bar graph?
(b) In which month, sales of brand A decreased as compared to the previous month?
(c) What is the difference in sales of both the brands for the month of June?
(d) Find the average sales of brand 8 for the six months,
(e) List all months for which the sales of brand 8 was less than that of brand A.
(f) Find the ratio of sales of brand A as compared to brand 8 for the month of January.
7.
Study the bar graph given below and answer the questions that follow:
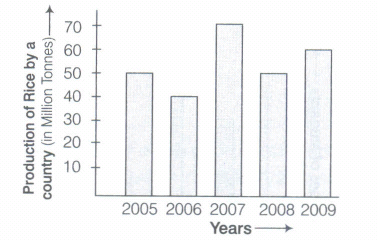
(a) What information does the above bar graph represent?
(b) In which year was production the least?
(c) After which year was the maximum rise in the production?
(d) Find the average production of rice during the 5 years.
(e) Find difference of rice productions between the years 2006 and 20'08.
8.
Number of children in six different classes are given below. Represent the data on a bar graph
| Class | Number of children |
| V | 125 |
| VI | 110 |
| VII | 100 |
| VIII | 95 |
| IX | 90 |
| X | 70 |
(a) Find the average number of children in the classes.
(b) Find the ratio of student of Class VI to the students of Class VIII
9.
The mean of 10 observations was calculated as 40. It was detected on rechecking that the value of 45 was wrongly copied as 15. Find the correct mean.
10.
Sale of Mathematics and Hindi books in the years 1999, 2000, 2001 and 2002 are given below:
| Years | 1999 | 2000 | 2001 | 2002 |
|---|---|---|---|---|
| Mathematics | 450 | 400 | 410 | 540 |
| Hindi | 490 | 480 | 540 | 610 |
In which year was the difference in the sale of the two subjects books least?
1.
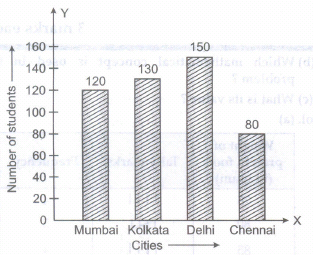
To construct the bar graph representing the given data, we follow the following steps:
(a) We take a graph paper and draw two mutually perpendicular lines OX and OY.
(b) Along the horizontal line OX, we mark 'cities' and along the vertical line, we mark the 'population'.
(c) Along the axis OX, we choose equal suitable width of each bar. The gap between the bars is chosen same.
(d) Choose a suitable scale to determine the heights of the bars, according to the availability of space.
Here, we choose 1 big division to represent 20 lakh population.
(e) Calculate the height of various bars as follows:
The height of the bar for Mumbai \(=\frac{120}{20}=\) 6 big divisions
The height of the bar for Kolkata \(=\frac{130}{20}=\) 6.5 big divisions
The height of the bar for Delhi \(=\frac{150}{20}=\) 7.5 big divisions
The height of the bar for Chennai \(=\frac{80}{20}=\) 4 big divisions
(f) Now, we draw the bars as shown in Fig. below and at the top of each bar we write the population of the corresponding city.
2.
Mode = 48 kg, Mean = 51 kg
3.
61
4.
i) \(\frac { 21 }{ 50 } \)
ii) \(\frac { 29 }{ 50 } \)
5.
A double bar graph is shown below
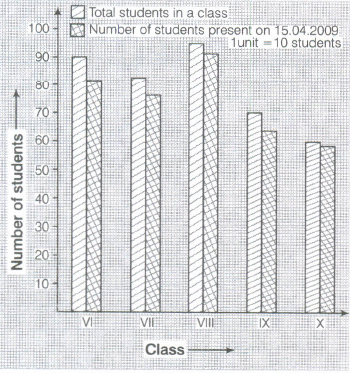
We infer from the bar graph that maximum number of students were absent in Class VI on 15.04.2009 whereas minimum number of students were absent in Class X
(b) Clearly, class VIII has maximum number of students, i.e. 95.
(c) The difference of total number of students and number of students present is minimum for Class X, i.e. 63 - 62 = 1.
(d) Number of students present in Class IX = 65 Total number of students = 70
Hence, required radio = \(\frac { 65 }{ 70 } =\frac { 13 }{ 14 } \)or 13:14
(e) Total number of students in Class VI = 90
Number of students present in Class VI = 81
Number of students absent = 90 - 81 = 9
= \(\frac { number\quad of\quad absent\quad students }{ total\quad number\quad of\quad students } \times 100\)
= \(\frac { 9 }{ 90 } \times 100=10%\) %
6.
(a) The above double bar graph compares the sale of brands A and 8during the months of January to June.
(b) We can clearly see from the double bar graph that sales for brand A reduced in the month of March compared to that of February.
(c) Sales of brand A in June = Rs. 57 lakh
and sales of brand 8 in June = Rs. 54 lakh
Difference in sales = 57 - 54 = Rs. 3 lakh
(d) Average sales of brand 8
=\(\frac { total\ sales\ of\ brand\ b\ in\ sin\ months\ from\ january\ to\ june }{ 6 } \)
= \(\frac { 36+38+43+35+45+54 }{ 6 } \)
= \(\frac { 251 }{ 6 } \) Rs.41.83 lakh
(e) We can clearly see from the double bar graph that sales of brand 8is less than sales of brand A in the month of April and June
(f) Sales of brand A in January = 31
and sales of brand 8 in January = 36
Required ratio = \(\frac { 31 }{ 36 } \)or 31:36
7.
After studying the bar graph, we have
Production of rice in 2005 = 50 million tonne
Production of rice in 2006 = 40 million tonne
Production of rice in 2007 = 70 million tonne
Production of rice in 2008 = 50 million tonne
Production of rice in 2009 = 60 million tonne
(a) From above calculation, the bar graph shows
the production of rice in million tonne by a
country during years 2005 to 2009.
(b) The production of rice in 2006 was the least
40 million tonne.
(c) The maximum production of rice was in 2007.
.The production rose after 2006.
(d) For average production Average = \(\frac { sum\ of\ observations }{ number\ of\ observations } \)
Sum of productions = 50 + 40 + 70 + 50 + 60 = 270
Average = \(\frac { 270 }{ 5 } \) = 54.4 million tonne
(e) Production in 2006 = 40 million tonne
Production in 2008 = 50 million tonne.
Difference = 50 - 40 = 10 million tonne.
8.
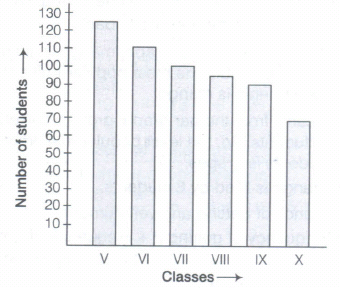
(a) For average number of children,
The sum of given number of children
= 125 + 110 + 100 + 95 + 90 + 70 = 590
average/mean \(=\frac { sum\ of\ osbervations }{ number\ of\ observations } \)
= \(\frac { 590 }{ 6 } =98.33=98\)
Hence, average number of children in each class is 98.
(b) Ratio = \(\frac { 110 }{ 95 } =\frac { 22 }{ 19 } \)
Hence, ratio is 22 : 19
9.
As per the given information, mean of 10 observations is 40.
\(\therefore\) Mean \(=\frac { sum\ of\ all\ observations }{ number\ of\ observations } \)
\(\Rightarrow\) 40 = \(\frac { sum\ of\ all\ observations }{ 10 } \)
Sum of all observations = 40 x 10 = 400
But this is incorrect sum. Since, one observation was copied wrongly.
Correct sum = Incorrect sum - Incorrect observation + Correct observation
= 400 - 15 + 45 = 430
correct mean \(=\frac { Correct\ sum }{ number\ of\ observations } =\frac { 430 }{ 10 } =43\)
10.
On the basis of given data, we can draw the following double bar graph:
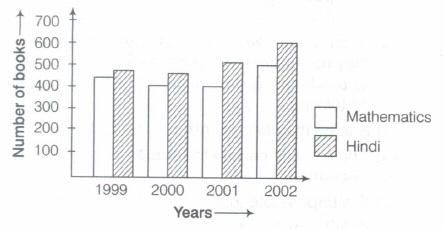
The difference in the sales of the two subjects books
In the year 1999, 490 - 450 = 40
In the year 2000, 480 - 400 = 80
In the year 2001, 540 - 410 = 130
In the year 2002,610 - 540 = 70
The difference in the sale of the two subjects books is least in the year 1999

7th Standard CBSE Syllabus & Materials
7th Standard CBSE
CBSE 7th Social Science Theme B - New Beginnings : Cities and States - New Sample Question Papers Study Material - QB365 Set A
NEW7th Standard CBSE
CBSE 7th Social Science Theme A - Climates of India - New Sample Question Papers Study Material - QB365 Set A
NEW7th Standard CBSE
CBSE 7th Social Science Theme A - Geographical Diversity of India - New Sample Question Papers Study Material - QB365 Set A
NEW7th Standard CBSE
CBSE 7th Science Earth, Moon and the Sun - New Sample Question Papers Study Material - QB365 Set A



CBSE 7th Standard CBSE Subjects
CBSE Standards




