
 100% FREE ACCESS
10th Standard CBSE Syllabus & Materials
10th Standard CBSE
CBSE 10th Social Science ECO - Globalisation and the Indian Economy - New Model Questions Papers Study Material - QB365 Set A
NEW10th Standard CBSE
CBSE 10th Social Science ECO - Money and Credit - New Model Questions Papers Study Material - QB365 Set A
NEW10th Standard CBSE
CBSE 10th Social Science ECO - Sectors of the Indian Economy - New Model Questions Papers Study Material - QB365 Set A
NEW10th Standard CBSE
CBSE 10th Social Science ECO - Development - New Model Questions Papers Study Material - QB365 Set A
NEW10th Standard CBSE
CBSE 10th Social Science PS - Outcomes of Democracy - New Model Questions Papers Study Material - QB365 Set A
NEW10th Standard CBSE
CBSE 10th Social Science PS - Gender, Religion and Caste - New Model Questions Papers Study Material - QB365 Set A

Published on: 22/05/2021
QB365 Provides the updated CASE Study Questions for Class 10 Maths, and also provide the detail solution for each and every case study questions . Case study questions are latest updated question pattern from NCERT, QB365 will helps to get more marks in Exams
Download CBSE Class 10th Standard CBSE Maths question papers, sample papers, important questions, and previous year solved papers in PDF format. Get free study materials, NCERT solutions, and exam preparation resources for Class 10th Standard CBSE Maths
Questions + Answers key
Take MCQ Maths Test
1.
An inspestor in an enforcement squad of electricity department visit to a locality of 100 families and record their monthly consumption of electricity, on the basis of family members, electronic items in the house and wastage of electricity, which is summarise in the following table.
| Monthly Consumption (in kwh) |
0-100 | 100-200 | 200-300 | 300-400 | 400-500 | 500-600 | 600-700 | 700-800 | 800-900 | 900-1000 |
| Number of families | 2 | 5 | x | 12 | 17 | 20 | y | 9 | 7 | 4 |

Based on the above information, answer the following questions.
(i) The value of x + y is
| (a) 100 | (b) 42 | (c) 24 | (d) 200 |
(ii) If the median of the above data is 525, then x is equal to
| (a) 10 | (b) 8 | (c) 9 | (d) none of these |
(iii) What will be the upper limit of the modal class?
| (a) 400 | (c) 650 | (b) 600 | (d) 700 |
(iv) The average monthly consumption of a family of this locality is approximately
| (a) 520 kwh | (b) 522 kwh | (c) 540 kwh | (d) none of these |
(v) If A be the assumed mean, then A is always
| (a) > (Actual mean) | (b) < (Actual Mean) |
| (c) = (Actual Mean) | (d) can't say |
2.
A group of 71 people visited to a museum on a certain day. The following table shows their ages.
| Age (in years) | Number of persons |
| Less than 10 | 3 |
| Less than 20 | 10 |
| Less than 30 | 22 |
| Less than 40 | 40 |
| Less than 50 | 54 |
| Less than 60 | 71 |
Based on the aboxe information, answer the following questions.
(i) If true class limits have been decided by making the classes of interval 10, then first class must be
| (a) 5-15 | (b) 0-10 |
| (c) 10-20 | (d) none of these |
(ii) The median class for the given data will be
| (a) 20-30 | (b) 10-20 | (c) 30-40 | (d) 40-50 |
(iii) The cumulative frequency of class preceding the median class is
| (a) 22 | (b) 13 | (c) 25 | (d) 35 |
(iv) The median age of the persons visited the museum is
| (a) 30 years | (b) 32.5 years | (c) 34 years | (d) 37.5 years |
(v) If the price of a ticket for the age group 30-40 is Rs 30, then the total amount spent by this age group is
| (a) Rs 360 | (b) Rs 420 | (c) Rs 540 | (d) Rs 340 |
3.
Transport department of a city wants to buy some Electric buses for the city. For which they wants to analyse the distance travelled by existing public transport buses in a day.
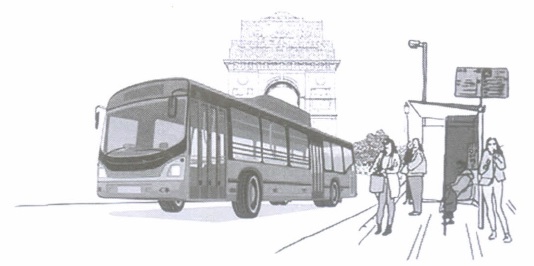
The following data shows the distance travelled by 60 existing public transport buses in a day.
| Daily distance travelled (in km) | 200-209 | 210-219 | 220-229 | 230-239 | 240-249 |
| Number of buses | 4 | 14 | 26 | 10 | 6 |
Based on the above information, answer the following questions.
(i) The upper limit of a class and lower limit of its succeeding class is differ by
| (a) 9 | (b) 1 | (c) 10 | (d) none of these |
(ii) The median class is
| (a) 229.5-239.5 | (b) 230-239 | (c) 220-229 | (d) 219.5-229.5 |
(iii) The cumulative frequency of the class preceding the median class is
| (a) 14 | (b) 18 | (c) 26 | (d) 10 |
(iv) The median of the distance travelled is
| (a) 222 km | (b) 225 km | (c) 223 km | (d) none of these |
(v) If the mode of the distance travelled is 223.78 km, then mean of the distance travelled by the bus is
| (a) 225 km | (b) 220 km | (c) 230.29 km | (d) 224.29 km |
4.
On a particular day, National Highway Authority ofIndia (NHAI) checked the toll tax collection of a particular toll plaza in Rajasthan.
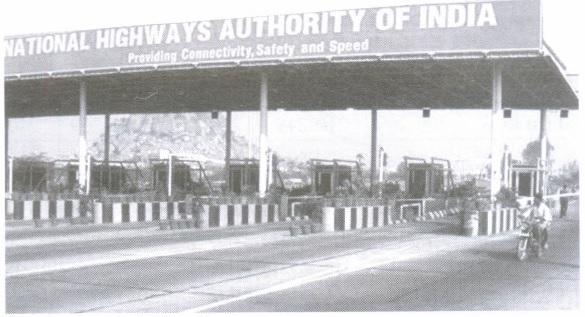
The following table shows the toll tax paid by drivers and the number of vehicles on that particular day.
| Toll tax (in Rs) | 30-40 | 40-50 | 50-60 | 60-70 | 70-80 |
| Number of vehicles | 80 | 110 | 120 | 70 | 40 |
Based on the above information, answer the following questions.
(i) If A is taken as assumed mean, then the possible value of A is
| (a) 32 | (b) 42 | (c) 85 | (d) 55 |
(ii) If xi's denotes the class marks and fi's denotes the deviation of assumed mean (A) from xi's, then the minimum value of |di| is
| (a) -200 | (b) -100 | (c) 0 | (d) 100 |
(iii) The mean of toll tax received. by NHAI by assumed mean method is
| (a) Rs 52 | (b) Rs 52.14 | (c) Rs 52.50 | (d) Rs 53.50 |
(iv) The mean of toll tax received by NHAI by direct method is
| (a) equal to the mean of toll tax received by NHAI by assumed mean method |
| (b) greater than the mean of toll tax received by NHAI by assumed mean method |
| (c) less than the mean of toll tax received by NHAI by assumed mean method |
| (d) none of these |
(v) The average toll tax received by NHAI in a day, from that particular toll plaza, is
| (a) Rs 21000 | (b) Rs 21900 | (c) Rs 30000 | (d) none of these |
5.
As the demand for the products grew, a manufacturing company decided to hire more employees. For which they want to know the mean time required to complete the work for a worker. The following table shows the frequency distribution of the time required for each worker to complete a work.
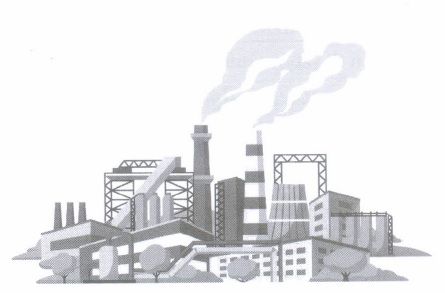
| Time (in hours) | 15-19 | 20-24 | 25-29 | 30-34 | 35-39 |
| Number of workers | 10 | 15 | 12 | 8 | 5 |
Based on the above information, answer the following questions.
(i) The class mark of the class 25-29 is
| (a) 17 | (b) 22 | (c) 27 | (d) 32 |
(ii) If xi's denotes the class marks and fi's denotes the corresponding frequencies for the given data, then the value of \(\sum x_{i} f_{i}\) equals to
| (a) 1200 | (b) 1205 | (c) 1260 | (d) 1265 |
(iii) The mean time required to complete the work for a worker is
| (a) 22 hrs | (b) 23 hrs | (c) 24 hrs | (d) none of these |
(iv) If a worker works for 8 hrs in a day, then approximate time required to complete the work for a worker is
| (a) 3 days | (b) 4 days | (c) 5 days | (d) 6 days |
(v) The measure of central tendency is
| (a) Mean | (b) Median | (c) Mode | (d) All of these |
1.
We have the following table:
| Class interval | Frequency | Cumulative frequency |
| 0-100 | 2 | 2 |
| 100-200 | 5 | 7 |
| 200-300 | x | 7+ x |
| 300-400 | 12 | 19 + x |
| 400-500 | 17 | 36 + x |
| 500-600 | 20 | 56 + x |
| 600-700 | y | 56 + x + y |
| 700-800 | 9 | 65 + x + y |
| 800-900 | 7 | 72 + x + y |
| 900-1000 | 4 | 76 + x + y |
| Total | 76 + x + y |
(i) (c): Here, it is given that total frequency = 100
\(\therefore\) 76 + x + y = 100 \(\Rightarrow\) x + y = 24
(ii) (c): Here \(\frac{N}{2}=\frac{100}{2}=50\)
Also, median = 525
\(\therefore\) Median class is 500-600.
\(\text { Now, median }=l+\left(\frac{N / 2-c . f .}{f}\right) \times h \)
\(\Rightarrow 525=500+\left(\frac{50-(36+x)}{20}\right) \times 100 \)
\(\Rightarrow 5=50-36-x \Rightarrow x=9\)
(iii) (b) : Since, maximum frequency is 20, so modal class is 500 - 600. Hence, upper limit of modal class is 600.
(iv) (b) : Since, x + y = 24 \(\Rightarrow\) y = 24 - 9 = 15
Required average consumption
\(\begin{aligned}
& 50 \times 2+150 \times 5+250 \times 9+350 \times 12+450 \times 17 \\
=& \frac{+550 \times 20+650 \times 15+750 \times 9+850 \times 7+950 \times 4}{100} \\
=& \frac{52200}{100}=522 \mathrm{kwh}
\end{aligned}\)
(v) (d)
2.
(i) (b): The age of any person is a positive number, so the first class must be 0 - 10.
(ii) (c):
Let us consider the following table:
| Age (in years) | Class interval (xi) | Frequencies (fi) | Cumulative frequency (c.f) |
| Less than 10 | 0-10 | 3 | 3 |
| Less than 20 | 10-20 | 10-3=7 | 10 |
| Less than 30 | 20-30 | 22-10-12 | 22 |
| Less than 40 | 30-40 | 40-22-18 | 40 |
| Less than 50 | 40-50 | 54-40=14 | 54 |
| Less than 60 | 50-60 | 71-54=17 | 71 |
Here, N = 71, therefore \(\frac{N}{2}=35.5\)
Now, the class interval whose cumulative frequency is
just greater than 35.5 is 30-40.
\(\therefore\) Median class = 30-40
(iii) (a): Clearly, the cumulative frequency of the class
preceding the median class is 22.
(iv) (d): Median \(=l+\left(\frac{\frac{N}{2}-\varsigma . f .}{f}\right) \times h\)
\(=30+\left(\frac{35.5-22}{18}\right) \times 10=30+13.5 \times \frac{10}{18}=30+7.5=37.5\)
Thus, the median age of the persons visited the
museum is 37.5 years
(v) (c): Number of persons, whose age lying in 30-40 = 18
\(\therefore\) Total amount spent by people of this group
= Rs (30 x 18) = Rs 540
3.
(i) (b): The upper limit of a class and the lower class of its succeeding class differ by 1.
(ii) (d) : Here, class intervals are in inclusive form. So, we first convert them in exclusive form. The frequency distribution table in exclusive form is as follows:
| Class interval | Frequency (fi) | Cumulative frequency (c.f) |
| 199.5-209.5 | 4 | 4 |
| 209.5-219.5 | 14 | 18 |
| 219.5-229.5 | 26 | 44 |
| 229.5-239.5 | 10 | 54 |
| 239.5-249.5 | 6 | 60 |
\(\text { Here, } \Sigma f_{i} \text { i.e., } N=60 \)
\(\Rightarrow \frac{N}{2}=30\)
Now, the class interval whose cumulative frequency is
just greater than 30 is 219.5 - 229.5.
\(\therefore\) Median class is 219.5 - 229.5.
(iii) (b): Clearly, the cumulative frequency of the class preceding the median class is 18
(iv) (d): Median \(=l+\left[\frac{\frac{N}{2}-c . f .}{f}\right] \times h\)
\(=219.5+\left(\frac{30-18}{26}\right) \times 10 \)
\(=219.5+\frac{12 \times 10}{26}=219.5+4.62=224.12\)
\(\therefore\) Median of the distance travelled is 224.12 km
(v) (d): We know, Mode = 3 Median - 2 Mean
\(\therefore \quad \text { Mean }=\frac{1}{2}(3 \text { Median }-\text { Mode }) \)
\(=\frac{1}{2}(672.36-223.78)=224.29 \mathrm{~km}\)
4.
Let us consider the following table:
| Class | Class marks (xi) | di=xi-A | Frequency (fi) | fi di |
| 30-40 | 35 | -20 | 80 | -1600 |
| 40-50 | 34 | -10 | 110 | -1100 |
| 50-60 | 55 = A | 0 | 120 | 0 |
| 60-70 | 65 | 10 | 70 | 700 |
| 70-80 | 75 | 20 | 40 | 800 |
| Total | \(\Sigma f_{i}=420\) | \(\sum f_{i} d_{i}=1200\) |
(i) (d): Clearly, the possible values of assumed mean (A) are 35, 45, 55, 65, 75.
(ii) (c): The values of |di| are 0, 10,20
Thus, the minimum value of |di| is 0.
(iii) (b): Required Mean \(=A+\frac{\sum f_{i} d_{i}}{\sum f_{i}}=55-\frac{1200}{420}\)
= Rs 52.14.
(iv) (a): Mean by direct and assumed mean method are always equal.
(v) (d): Average toll tax received by a vehicle = Rs 52.14 Total number of vehicles = 420
\(\therefore\) Average toll tax received in a day = Rs (52.14 x 420) = Rs 21898.80
5.
(i) (c): Class mark of class 25 - 29
\(=\frac{25+29}{2}=\frac{54}{2}=27\)
(ii) (d): Let us consider the following table:
| Class | Class mark (xi) | Frequency (fi) | = xi fi |
| 15-19 | 17 | 10 | 170 |
| 20-24 | 22 | 15 | 330 |
| 25-29 | 27 | 12 | 324 |
| 30-34 | 32 | 8 | 256 |
| 34-39 | 37 | 5 | 185 |
| Total | \(\Sigma f_{i}=50\) | \(\sum x_{i} f_{i}=1265\) |
\(\therefore \quad \operatorname{Mean}(\bar{x})=\frac{\sum x_{i} f_{i}}{\sum f_{i}}=\frac{1265}{50}=25.3\)
Thus, the mean time to complete the work for a worker
= 25.3 hrs = 3 days
(iii) (d)
(iv) (a)
(v) (d): We know the measure of central tendency are mean, median and mode.

10th Standard CBSE Syllabus & Materials
10th Standard CBSE
CBSE 10th Social Science PS - Federalism - New Model Questions Papers Study Material - QB365 Set A
NEW10th Standard CBSE
CBSE 10th Social Science PS - Power Sharing - New Model Questions Papers Study Material - QB365 Set A
NEW10th Standard CBSE
CBSE 10th Social Science GEO - Manufacturing Industries - New Model Questions Papers Study Material - QB365 Set A
NEW10th Standard CBSE
CBSE 10th Social Science GEO - Minerals and Energy Resources - New Model Questions Papers Study Material - QB365 Set A



NCERT Books

Syllabus

Exam Pattern

Sample Question Papers

Previous year Question Papers

Important Notes

MCQ Practice test

NCERT Exemplers

Case study Questions

Image Based Questions

Passage based Questions

HOT Questions

Value Based Questions

Model Questions Papers
NCERT ( Book Back ) Questions

Assertion and Reason
Important Questions And Answers

CBSE 10th Standard CBSE Subjects
CBSE Standards



