
 100% FREE ACCESS
11th Standard CBSE Syllabus & Materials
11th Standard CBSE
CBSE 11th Economics PART-A - Presentation of Data - New Sample Question Papers Study Material - QB365 Set A
NEW11th Standard CBSE
CBSE 11th Economics PART-A - Organisation of Data - New Sample Question Papers Study Material - QB365 Set A
NEW11th Standard CBSE
CBSE 11th Economics PART-A - Collection of Data - New Sample Question Papers Study Material - QB365 Set A
NEW11th Standard CBSE
CBSE 11th Economics PART-A - Introduction to Economics and Statistics - New Sample Question Papers Study Material - QB365 Set A
NEW11th Standard CBSE
CBSE 11th Business Studies International Trade Sample Question Papers Study Material - QB365 Set A
NEW11th Standard CBSE
CBSE 11th Business Studies Evolution and Fundamentals of Business Sample Question Papers Study Material - QB365 Set A

Published on: 11/09/2019
Correlation
Download CBSE Class 11th Standard CBSE undefined question papers, sample papers, important questions, and previous year solved papers in PDF format. Get free study materials, NCERT solutions, and exam preparation resources for Class 11th Standard CBSE undefined
Questions + Answers key
Take MCQ Biology Test
1.
If precisely measured data are available the simple correlation coefficient is
More accurate than rank correlation coefficient
Less accurate than rank correlation coefficient
As accurate as rank correlation coefficient
2.
If rxy is zero, the variable X and Y are
Linearly Related
Not Linearly Related
Independent
3.
If rxy is positive the relation X and Y is of the type:
When Y increase, X increases
When Y decreases, X decreases
When Yincreases, X does not change
4.
2 judges mark the performances given by 7 contestants in a talent competition
| Contestant | A | B | C | D | E | F | G |
|---|---|---|---|---|---|---|---|
| Judge 1 | 14 | 17 | 12 | 9 | 15 | 10 | 11 |
| Judge 2 | 10 | 9 | 13 | 14 | 8 | 15 | 12 |
Find rank Correlation.
5.
Calculate 'R' from the following data.
| Student No. : | 1 | 2 | 3 | 4 | 5 | 6 | 7 | 8 | 9 | 10 |
|---|---|---|---|---|---|---|---|---|---|---|
| Rank in Maths : | 1 | 3 | 7 | 5 | 4 | 6 | 2 | 10 | 9 | 8 |
| Rank in Stats : | 3 | 1 | 4 | 5 | 6 | 9 | 7 | 8 | 10 | 2 |
6.
If r = 0.6 and n = 64 find out the probable error of the coefficient of correlation.
7.
Draw the scatter diagram and interpret it:
| X: | 34 | 36 | 37 | 8 | 39 | 40 | 42 | 45 | 50 |
|---|---|---|---|---|---|---|---|---|---|
| Y: | 3 | 1 | 8 | 7 | 6 | 2 | 4 | 0 | 2 |
8.
Draw the scatter diagram and interpret it:
| X: | 90 | 80 | 70 | 60 | 50 | 40 | 30 | 20 | 10 |
|---|---|---|---|---|---|---|---|---|---|
| Y: | 10 | 20 | 30 | 40 | 50 | 60 | 70 | 80 | 90 |
9.
Interpret the values of r as 1, - 1 and 0.
10.
Measure the height of your classmates. Ask them the height of their bench mates. Calculate the coefficients of correlation, Interpret the result.
11.
Collect the price of five vegetables from your local market every day for a week. Calculate their correlation coefficients. Interpret the results.
12.
Can r lie beyond + 1 and - 1 depending on the type of data?
13.
Why is correlation preferred to covariance as a measure of association?
14.
Calculate correlation coefficient between X and Y and comment on their relationship.
| X | -3 | -2 | -1 | 1 | 2 | 3 |
| Y | 9 | 4 | 1 | 1 | 4 | 9 |
15.
Calculate the coefficient of correlation between the height of fathers in inches and (X) and their sons (Y).
| X | 64 | 66 | 57 | 67 | 68 | 69 | 70 | 72 |
| Y | 67 | 56 | 65 | 68 | 72 | 72 | 69 | 71 |
1.
(a)
More accurate than rank correlation coefficient
2.
(b)
Not Linearly Related
3.
(a)
When Y increase, X increases
4.
| Judge 1 | 14 | 17 | 12 | 9 | 15 | 10 | 11 | |
|---|---|---|---|---|---|---|---|---|
| Judge 2 | 10 | 9 | 13 | 14 | 8 | 15 | 12 | |
| Judge 1 rank | 5 | 7 | 4 | 1 | 6 | 2 | 3 | |
| Judge 2 rank | 3 | 2 | 5 | 6 | 1 | 7 | 4 | |
| d | 2 | 5 | -1 | -5 | 5 | -5 | -1 | |
| d2 | 4 | 25 | 1 | 25 | 25 | 25 | 1 | \(\sum\)d2 = 106 |
So rs = 1 - \(\frac { 6\sum { { d }^{ 2 } } }{ n({ n }^{ 2 }-1) } \)= 1 - \(\frac { 6\times 106 }{ 7(49-1) } \) = 1 - \(\frac { 636 }{ 7\times 48 } \)
1 - 1.89 = 0.89
High positive correlation.
5.
| Student No. | Rank in Maths(R1) | Rank in Stats (R2) |
R1 - R2 |
(R1 - R2) |
|---|---|---|---|---|
| 1 | 1 | 3 | -2 | 4 |
| 2 | 3 | 1 | 2 | 4 |
| 3 | 7 | 4 | 3 | 9 |
| 4 | 5 | 5 | 0 | 0 |
| 5 | 4 | 6 | -2 | 4 |
| 6 | 6 | 9 | -3 | 9 |
| 7 | 2 | 7 | -5 | 25 |
| 8 | 10 | 8 | 2 | 4 |
| 9 | 9 | 10 | -1 | 1 |
| 10 | 8 | 2 | 6 | 36 |
| N = 10 | SD = 0 | SD2 = 96 |
Calculation of R :
R = \(\frac { 6\sum { { D }^{ 2 } } }{ N({ N }^{ 2 }-1) } \) = 1 - \(\frac { 6(96) }{ 10(100-1) } \) = 0.4181
6.
P.E. = 0.6745\(\left[ \frac { 1-{ r }^{ 2 } }{ \sqrt { n } } \right] \)= 0.6745 \(\frac { 1-(-0.6{ ) }^{ 2 } }{ \sqrt { 64 } } \) = \(\frac { 0.6745-0.64 }{ 8 } \) = 0.57
7.
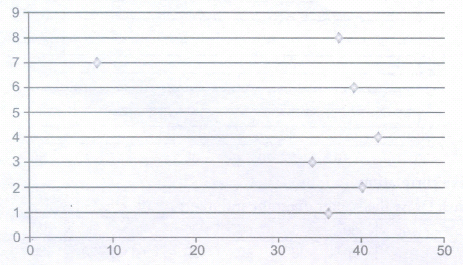
Zero correlation
8.
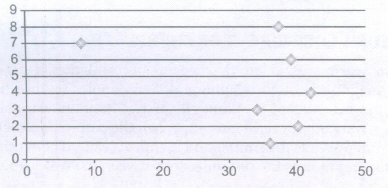
Perfect Negative Correlation
9.
(a) r = 1 means it is perfect positive correlation.
(b) r = - 1means there is perfect negative correlation.
(c) r = 0 means there is no correlation.
10.
For this, we should collect the data. There after we can use any of the following method to find correlation:
(a) Scatter plot
(b) Karl Pearson's coefficient .ofcorrelation. This method is preferable but relatively difficult.
11.
For this we should collect the data. Thereafter we can use any of the following methods to find correlation:
(a) Scatter plot
(b) Karl Pearson's coefficient of correlation, This method is preferable but relatively difficult.
12.
The coefficient of correlation lies between ± 1. If it lies beyond, ± 1, then the relationship between variables is not linear. It is .non linear. Therefore, while interpreting such a value, we must remember, it must have some errors or mistakes
13.
The sign of covariance between X and Y determines the sign of the correlation coefficient. The standard deviations are always positive. When covariance is zero, correlation is also zero. Correlation is preferred to covariance as a measure of association because:
(a) It tells about positive, negative, or zero correlation i.e. no linear correlation.
(b) As well as, r is independent of change of origin and change of scale of measurements.
14.
| X | X2 | Y | Y2 | XY |
| -3 | 9 | 9 | 81 | -27 |
| -2 | 4 | 4 | 16 | -8 |
| -1 | 1 | 1 | 1 | -1 |
| 1 | 1 | 1 | 1 | 1 |
| 2 | 4 | 4 | 16 | 8 |
| 3 | 9 | 9 | 81 | 27 |
| Total \(\sum \)X = -2 | \(\sum \)X2=28 | \(\sum\)Y=28 | \(\sum\)Y2=196 | \(\sum\)XY = 0 |
r = \(\frac { n(\sum xy)-(\sum x)(\sum y) }{ \sqrt { n(\sum x2-(\sum x)2[n\sum y2-(\sum y)2] } } \)
r = \(\frac { 6(0)-(-2)\times (28) }{ \sqrt { 6(28)-({ -2) }^{ 2 }(6(196)-{ (28) }^{ 2 } } } \)
r = \(\frac { -56 }{ \sqrt { 52\times 392 } } \)
r = \(\frac { -56 }{ \sqrt { 20384 } } \)
15.
| X | Y | dx | dy | dx2 | dy2 | dx dy |
| 65 | 67 | -2 | -1 | 4 | 1 | 2 |
| 66 | 56 | -1 | -12 | 1 | 144 | 12 |
| 57 | 65 | -10 | -3 | 100 | 9 | 30 |
| 67 | 68 | 0 | 0 | 0 | 0 | 0 |
| 68 | 72 | +1 | +4 | 1 | 16 | 4 |
| 69 | 72 | +2 | +4 | 4 | 16 | 8 |
| 70 | 69 | +3 | +1 | 9 | 1 | 3 |
| 72 | 71 | +5 | +3 | 25 | 9 | 15 |
| Total | \(\sum\)dx = -2 | \(\sum\)dy - = -4 | \(\sum\)dx2 = 149 | \(\sum\)dy2=196 | \(\sum\)dxdy=70 |

11th Standard CBSE Syllabus & Materials
11th Standard CBSE
CBSE 11th Business Studies Forms of Business Organisation Sample Question Papers Study Material - QB365 Set A
NEW11th Standard CBSE
CBSE 11th Business Studies Business, Trade and Commerce Sample Question Papers Study Material - QB365 Set A
NEW11th Standard CBSE
CBSE 11th Physics Waves Sample Question Papers Study Material - QB365 Set A
NEW11th Standard CBSE
CBSE 11th Physics Kinetic Theory Sample Question Papers Study Material - QB365 Set A



CBSE 11th Standard CBSE Subjects
CBSE Standards










