
 100% FREE ACCESS
11th Standard CBSE Syllabus & Materials
11th Standard CBSE
CBSE 11th Economics PART-A - Presentation of Data - New Sample Question Papers Study Material - QB365 Set A
NEW11th Standard CBSE
CBSE 11th Economics PART-A - Organisation of Data - New Sample Question Papers Study Material - QB365 Set A
NEW11th Standard CBSE
CBSE 11th Economics PART-A - Collection of Data - New Sample Question Papers Study Material - QB365 Set A
NEW11th Standard CBSE
CBSE 11th Economics PART-A - Introduction to Economics and Statistics - New Sample Question Papers Study Material - QB365 Set A
NEW11th Standard CBSE
CBSE 11th Business Studies International Trade Sample Question Papers Study Material - QB365 Set A
NEW11th Standard CBSE
CBSE 11th Business Studies Evolution and Fundamentals of Business Sample Question Papers Study Material - QB365 Set A

Published on: 30/09/2019
Cost
Download CBSE Class 11th Standard CBSE undefined question papers, sample papers, important questions, and previous year solved papers in PDF format. Get free study materials, NCERT solutions, and exam preparation resources for Class 11th Standard CBSE undefined
Questions + Answers key
Take MCQ Biology Test
1.
Suppose that a firm's TFC is Rs.100 and MC schedule of the firm is the following:
| Output(Units) | 1 | 2 | 3 | 4 | 5 | 6 | 7 |
|---|---|---|---|---|---|---|---|
| MC(Rs.) | 10 | 20 | 30 | 40 | 50 | 60 | 70 |
(i) Is the MC curve U-shaped?
(ii) Derive AVC schedule. Will the AVC curve be U-shaped? Discuss why or why not?
2.
A firm's fixed cost is 2000. Compute TVC, AVC, TC and ATC from the following table.
| Output(Units) | 1 | 2 | 3 | 4 | 5 | 6 | 7 |
|---|---|---|---|---|---|---|---|
| MC(Rs.) | 2000 | 1500 | 1200 | 1500 | 2000 | 2700 | 3500 |
3.
Complete the following table if AFC of one unit of production is Rs. 60.
| Output | 1 | 2 | 3 | 4 | 5 | 6 | 7 | 8 |
|---|---|---|---|---|---|---|---|---|
| TC | 90 | 105 | 115 | 120 | 135 | 160 | 200 | 260 |
| TVC | ||||||||
| TFC | ||||||||
| AVC | ||||||||
| AFC | ||||||||
| ATC | ||||||||
| MC |
4.
Why does difference between ATC and AVC decrease with increase in level of output? Explain.
5.
Why does the difference between Average Total Cost and Average Variable Cost decrease with an increase in the level of output? Can these two be equal at some level of output? Explain.
6.
Calculate TC and AVC of a firm at each given level of output from its cost schedule.
| Output | 1 | 2 | 3 | 4 | 5 | 6 |
|---|---|---|---|---|---|---|
| AFC | 60 | 30 | 20 | 15 | 12 | 10 |
| MC(Rs.) | 32 | 30 | 28 | 30 | 35 | 43 |
7.
The total fixed cost of a firm is Rs.12. Given below is its marginal cost schedule. Calculate total cost and average variable cost for each given level of output.
| Output | 1 | 2 | 3 | 4 | 5 | 6 |
|---|---|---|---|---|---|---|
| Marginal Cost(Rs.) | 9 | 7 | 2 | 4 | 8 | 12 |
8.
A firm's SMC schedule is shown in the following table. The total fixed cost of the firm is Rs. 100 Find the TVC, TC, AVC and SAC schedules of the firm.
| Q | SMC |
|---|---|
| 0 | - |
| 1 | 500 |
| 2 | 300 |
| 3 | 200 |
| 4 | 300 |
| 5 | 500 |
| 6 | 800 |
9.
The following table gives the total cost schedule of a firm. It Is also given that the average fixed cost at 4 units of output is Rs. 5. Find the TVC, TFC. AVC, AFC, SAC and SMC schedules of the firm for the corresponding values of output.
| Q | TC |
|---|---|
| 1 | 50 |
| 2 | 65 |
| 3 | 75 |
| 4 | 95 |
| 5 | 130 |
| 6 | 185 |
10.
The following table shows the total cost schedule of a firm. What is the total fixed cost schedule of this firm? Calculate the TVC, AFC, AVC, SAC and SMC schedules of the firm.
| Q | TC |
|---|---|
| 0 | 10 |
| 1 | 30 |
| 2 | 45 |
| 3 | 55 |
| 4 | 70 |
| 5 | 90 |
| 6 | 120 |
1.
(i) MC curve is not U-shaped.
(ii)
| Output (Units) | 1 | 2 | 3 | 4 | 5 | 6 | 7 |
|---|---|---|---|---|---|---|---|
| TFC (Given) | 100 | 100 | 100 | 100 | 100 | 100 | 100 |
| MC (Given) | 10 | 20 | 30 | 40 | 50 | 60 | 70 |
| TVC=\(\sum\)MC | 10 | 30 | 60 | 100 | 150 | 210 | 280 |
| AVC=\(\frac{TVC}{Output}\) | 10 | 15 | 20 | 25 | 30 | 35 | 40 |
AVC curve will not be U-shaped because AVC data does not show operation of law of variable proportion.
2.
| Output (Units) | 1 | 2 | 3 | 4 | 5 | 6 | 7 |
|---|---|---|---|---|---|---|---|
| MC (Given) | 2000 | 1500 | 1200 | 1500 | 2000 | 2700 | 3500 |
| TFC (given) | 2000 | 2000 | 2000 | 2000 | 2000 | 2000 | 2000 |
| TVC=\(\sum\)MC | 2000 | 3500 | 4700 | 6200 | 8200 | 10900 | 14400 |
| TC=TFC+TVC | 4000 | 5500 | 6700 | 8200 | 10200 | 12900 | 16400 |
| ATC=\(\frac{TC}{Output}\) | 4000 | 2750 | 223.3 | 2050 | 2040 | 2150 | 2342.9 |
| AVC=\(\frac{TVC}{Output}\) | 2000 | 1750 | 1566.7 | 1550 | 1640 | 1816.7 | 2057.1 |
3.
| Output | 1 | 2 | 3 | 4 | 5 | 6 | 7 | 8 |
|---|---|---|---|---|---|---|---|---|
| TFC (Given) | 60 | 60 | 60 | 60 | 60 | 60 | 60 | 60 |
| TC (given) | 90 | 105 | 115 | 120 | 135 | 160 | 200 | 260 |
| TVC = TC - TFC | 30 | 45 | 55 | 60 | 75 | 100 | 140 | 200 |
| AVC=\(\frac{TVC}{Output}\) | 30 | 22.5 | 18.3 | 15 | 15 | 16.7 | 20 | 25 |
| AFC=\(\frac{TFC}{Output}\) | 60 | 30 | 20 | 15 | 12 | 10 | 8.6 | 7.5 |
| ATC=\(\frac{TC}{Output}\) | 90 | 52.5 | 38.3 | 30 | 27 | 26.7 | 28.6 | 32.5 |
| MC=\(\frac{\Delta{TC}}{\Delta{Output}}\) or \(\frac{\Delta{TVC}}{\Delta{Output}}\) | 30 | 15 | 10 | 5 | 15 | 25 | 40 | 60 |
4.
As, we know the difference between Average Total Cost and Average Variable Cost is average fixed cost (AFC = ATC- AVC) and AFC always decreases with the increase in output. It can be explained with the help of the following diagram and schedule
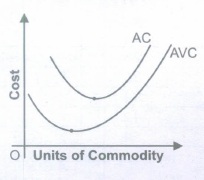
It can be seen from the above diagram that there is a huge gap between AC and AVC with the starting of production. The gap between them decreases with the increase in production.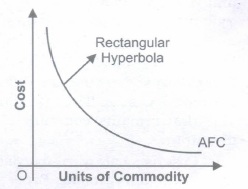
It is so because the gap between AC and AVC is AFC and AFC always decreases with the increase in production. The point to be remembered is that AVC can never touch AC curve because AFC cannot be Zero.
| Units of commodity | TFC | AFC |
|---|---|---|
| 0 | 60 | - |
| 1 | 60 | 60 |
| 2 | 60 | 30 |
| 3 | 60 | 20 |
| 4 | 60 | 15 |
| 5 | 60 | 12 |
5.
As, we know the difference between Average Total Cost and Average Variable Cost is average fixed cost (AFC = ATC- AVC) and AFC always decreases with the increase in output. It can be explained with the help of the following diagram and schedule.
It can be seen from the above diagram that there is a huge gap between AC and AVC with the starting of production. The gap between them decreases with the increase in production.
It is so because the gap between AC and AVC is AFC and AFC always decreases with the increase in production. The point to be remembered is that AVC can never touch AC curve because AFC cannot be Zero.
| Units of commodity | TFC | AFC |
|---|---|---|
| 0 | 60 | - |
| 1 | 60 | 60 |
| 2 | 60 | 30 |
| 3 | 60 | 20 |
| 4 | 60 | 15 |
| 5 | 60 | 12 |
6.
| Output | AFC (Given) | TFC = AFC x Output | MC | TVC=\(\sum\)MC | AVC\(\frac{TVC}{Output}\) | TC=TFC+TVC |
|---|---|---|---|---|---|---|
| 1 | 60 | 60 | 32 | 32 | 32 | 92 |
| 2 | 30 | 60 | 30 | 62 | 31 | 122 |
| 3 | 20 | 60 | 28 | 90 | 30 | 150 |
| 4 | 15 | 60 | 30 | 120 | 30 | 180 |
| 5 | 12 | 60 | 35 | 155 | 31 | 215 |
| 6 | 10 | 60 | 43 | 198 | 33 | 258 |
7.
| Output | MC (Given) | TVC = \(\sum\)MC | TFC | TC = TFC + TVC | AVC\(\frac{TVC}{Output}\) |
|---|---|---|---|---|---|
| 1 | 9 | 9 | 12 | 21 | 9 |
| 2 | 7 | 16 | 12 | 28 | 8 |
| 3 | 2 | 18 | 12 | 30 | 6 |
| 4 | 4 | 22 | 12 | 34 | 5.5 |
| 5 | 8 | 30 | 12 | 42 | 6 |
| 6 | 12 | 42 | 12 | 54 | 7 |
8.
| Q | SMC (given) |
TFC (given) |
TVC=\(\sum { MC } \) | TC=TFC+TVC | AVC= \(\frac{TVC}{Output}\) | SAC= \(\frac{TC}{Output}\) |
| 0 | - | 100 | 0 | 100 | - | - |
| 1 | 500 | 100 | 500 | 600 | 500 | 600 |
| 2 | 300 | 100 | 800 | 900 | 400 | 450 |
| 3 | 200 | 100 | 1000 | 1100 | 333.33 | 366.67 |
| 4 | 300 | 100 | 1300 | 1400 | 325 | 350 |
| 5 | 500 | 100 | 1800 | 1900 | 360 | 380 |
| 6 | 800 | 100 | 2600 | 2700 | 433.33 | 450 |
9.
| Q | TC (given) |
TFC |
AFC= \(\frac{TFC}{Output}\) | TVC = TC-TFC | AVC= \(\frac{TVC}{Output}\) | SAC= \(\frac{TC}{Output}\) | SMC=\(\frac{\Delta{TC}}{\Delta{Output}}\) OR \(\frac{\Delta{TVC}}{\Delta{Output}}\) |
|---|---|---|---|---|---|---|---|
| 1 | 5 | 20 | 2 | 30 | 30 | 50 | 30 |
| 2 |
65 |
20 | 10 | 45 | 22.5 | 32.5 | 15 |
| 3 | 75 | 20 | 6.67 | 55 | 18.33 | 25 | 10 |
| 4 | 95 | 20 | 5(given) | 75 | 18.75 | 23.75 | 20 |
| 5 | 130 | 20 | 4 | 110 | 22 | 26 | 35 |
| 6 | 185 | 20 | 3.33 | 165 | 27.5 | 30.83 | 55 |
10.
The total fixed cost will be the same at all the levels of output ranging from zero to six. For zero output, total cost is Rs.10. At zero output, total variable cost will be zero. Hence, Rs.10 represents total fixed cost at all levels of output.
| Q | TC (given) |
TFC |
AFC= \(\frac{TFC}{Output}\) |
TVC= TC-TFC | AVC= \(\frac{TVC}{Output}\) | SAC= \(\frac{TC}{Output}\) | SMC=\(\frac{\Delta{TC}}{\Delta{Output}}\) OR \(\frac{\Delta{TVC}}{\Delta{Output}}\) |
|---|---|---|---|---|---|---|---|
| 0 | 10 | 10 | - | 0 | - | - | - |
| 1 | 30 | 10 | 10 | 20 | 20 | 30 | 20 |
| 2 | 45 | 10 | 5 | 35 | 17.5 | 22.5 | 15 |
| 3 | 55 | 10 | 3.33 | 45 | 15 | 18.33 | 10 |
| 4 | 70 | 10 | 2.5 | 60 | 15 | 17.5 | 15 |
| 5 | 90 | 10 | 2 | 80 | 16 | 18 | 20 |
| 6 | 120 | 10 | 1.67 | 110 | 18.33 | 20 | 30 |

11th Standard CBSE Syllabus & Materials
11th Standard CBSE
CBSE 11th Business Studies Forms of Business Organisation Sample Question Papers Study Material - QB365 Set A
NEW11th Standard CBSE
CBSE 11th Business Studies Business, Trade and Commerce Sample Question Papers Study Material - QB365 Set A
NEW11th Standard CBSE
CBSE 11th Physics Waves Sample Question Papers Study Material - QB365 Set A
NEW11th Standard CBSE
CBSE 11th Physics Kinetic Theory Sample Question Papers Study Material - QB365 Set A



CBSE 11th Standard CBSE Subjects
CBSE Standards










