
 100% FREE ACCESS
11th Standard CBSE Syllabus & Materials
11th Standard CBSE
CBSE 11th Economics PART-A - Presentation of Data - New Sample Question Papers Study Material - QB365 Set A
NEW11th Standard CBSE
CBSE 11th Economics PART-A - Organisation of Data - New Sample Question Papers Study Material - QB365 Set A
NEW11th Standard CBSE
CBSE 11th Economics PART-A - Collection of Data - New Sample Question Papers Study Material - QB365 Set A
NEW11th Standard CBSE
CBSE 11th Economics PART-A - Introduction to Economics and Statistics - New Sample Question Papers Study Material - QB365 Set A
NEW11th Standard CBSE
CBSE 11th Business Studies International Trade Sample Question Papers Study Material - QB365 Set A
NEW11th Standard CBSE
CBSE 11th Business Studies Evolution and Fundamentals of Business Sample Question Papers Study Material - QB365 Set A

Published on: 01/11/2019
Download CBSE Class 11th Standard CBSE undefined question papers, sample papers, important questions, and previous year solved papers in PDF format. Get free study materials, NCERT solutions, and exam preparation resources for Class 11th Standard CBSE undefined
Questions + Answers key
Take MCQ Biology Test
1.
There are 80 students in a class whose average marks in Statistics are 65. There are two sections in the class. In one section there are fifty students whose average marks are 62. Find the average marks of other section.
2.
How does the procedure of drawing a histogram is differ when class intervals are unequal in comparison to equal class intervals in a frequency table?
3.
From the data given below, find median.
| Wages | No. of workers |
| Less than 10 | 50 |
| Less than 20 | 35 |
| Less than 30 | 25 |
| Less than 40 | 20 |
| Less than 50 | 18 |
| Less than 60 | 10 |
4.
Find median from the data given below:
| Wages (per hour): | 20 | 25 | 30 | 35 | 40 | 45 | 50 |
| Number of Workers: | 5 | 7 | 6 | 10 | 5 | 4 | 4 |
5.
How is the law of diminishing marginal utility applied with regard to education/ knowledge?
6.
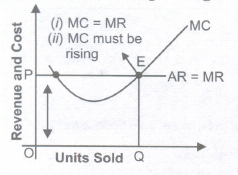
What is price line under perfect competition?
7.
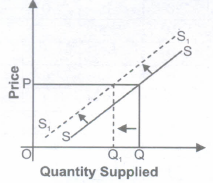
How does the imposition of a unit tax affect the supply curve of a firm?
8.
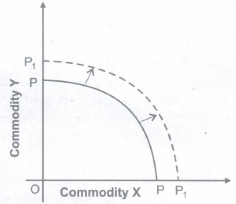
What will be the impact of recently launched 'Clean India Mission' (Swachh Bharat Mission) on the Production Possibilities curve of the economy and why?
9.
Let the production function of a firm be Q = \({ 5L }^{ \frac { 1 }{ 2 } }{ K }^{ \frac { 1 }{ 2 } }\)Find out the maximum possible output that the firm can produce with 100 units of Land 100 units of K.
10.
Why does SMC curve cut AVC curve at the minimum point of AVC curve?
11.
State the central problems of an economy.
12.
Consider the demand curve D(P) = 10 - 3p. What is the elasticity at price 5/3?
13.
What do you mean by complements? Give examples of two goods which are complements of each other.
14.
Discuss the subject matter of economics.
1.
| Section A | Section B | Combined | |
|---|---|---|---|
| Mean | 62 | ? | 65 |
| Number of items | 50 | 30 | 80 |
\(\overline { x } 12=\frac { { N }_{ 1 }\overline { x } 1+{ N }_{ 2 }\overline { x } 2 }{ { N }_{ 1 }+{ N }_{ 2 } } \)
65 = \(\frac { (62+50)+(Y\times 30) }{ 80 } \)
30Y = 2494
Y = 2490/30 = 83
2.
In case of equal class interval simply we draw the frequencies of equal width but when class intervals are unequal these frequencies need to be adjusted. It will be clear from the example given below:
| Class | Frequency | Adjusted Frequency |
| 0-10 | 3 | 3 |
| 10-30 | 4 | 2 |
| 30-60 | 6 | 2 |
| 60-100 | 4 | 1 |
3.
| Wages (class interval) | No. of workers | Cumulative Frequency (Less than type) |
| 10-20 | 15=50-35 | 15 |
| 20-30 | 10=35-25 | 25 |
| 30-40 | 5=25-20 | 30 |
| 40-50 | 2=20-18 | 32 |
| 50-60 | 8=18-10 | 40 |
| 60 and above | 10=10 | 50 |
Median=size of \(\frac{N}{2}\) Item
Median=size of \(\frac{50}{2}=50\) item 25th item lies in 20-30
We can find median by using the formula equal to
\(Median=l_1+\frac{(\frac{N}{2}-C)}{f}(i)\)
I1 = 20; f = 10; \(\frac{N}{2}=25\)
C=10;i=10
\(Median=20+\frac{25-15}{8}(10)=28.625\)
4.
| Wages (per Hour) | Number of workers | Cumulative Frequency |
| 20 | 5 | 5 |
| 25 | 7 | 12 |
| 30 | 6 | 18 |
| 35 | 10 | 28 |
| 40 | 5 | 33 |
| 45 | 4 | 37 |
| 50 | 4 | 41 |
Median = size of \(\frac{N+1}{2}\)
size of \(\frac{41+1}{2}=Item\)
Item 19 to 28 have a value equal to 35. Therefore, median = 35.
5.
In this case the law of diminishing marginal utility will not apply because every effort to get education/ knowledge increases the utility.
Value: Analytic
6.
(l) The price line shows the relationship between the market price and a competitive firm's output level.
(il) The vertical height of the price line is equal to the market price as shown in the given figure.
7.
(i) A unit tax is a tax that the government imposes per unit sale of output.
(ii) For example, suppose that the unit tax imposed by the government is Rs.3. Then, if the firm produces and sells 20 units of the goods, the total tax that the firm must pay to the government is
20 x 3 = 60.
(iii) So, if the unit tax increases, the firm's cost of production increases which will shift the supply curve leftward.
8.
Cleanliness reduces chances of people falling ill and, thus ensure better health. This, in turn, will reduce forced absenteeism from work, raise efficiency level and thus raise country's production potential. Rise in potential shifts PP curve to the right.
9.
Q = \({ 5L }^{ \frac { 1 }{ 2 } }{ K }^{ \frac { 1 }{ 2 } }\) (given)
Q = 5 x \({ 100 }^{ \frac { 1 }{ 2 } }{ 100 }^{ \frac { 1 }{ 2 } }\)
Q = 5 x 10 x 10 = 500 units
So, the maximum possible output(Q) = 500 units.
10.
(i) It happens because when AVC falls, SMC is less than AVC.
(ii) When AVC starts rising, SMC is more than AVC.
(iii) So, it is only when AVC is constant and at its minimum point, that SMC is equal to AVC. Therefore, SMC curve cuts AVC curve at its minimum point.
11.
The central problems of an economy are:
(i) What to produce and in what quantity?
(ii) How to produce?
(iii) For whom to produce?
12.
Given Q = 10 - 3P.
When P = \({5\over3},Q=10-3\times{5\over3}=5\)
Differentiating Q with respect to P,
we get,
We know,\({\triangle Q\over \triangle P}=-3\)
\(ED={\triangle Q\over \triangle P}\times {P\over Q}=-3\times{5/3\over 5}\)
\(=-3\times{5\over3}\times{1\over5}=[-]1\)
Negative Sign of ED indicates that inverse relationship between price and quantity demanded.
PED = 1 [Unitary elastic demand].
13.
(i) Complementary goods are those which are useless in the absence of other goods and which are demanded jointly.
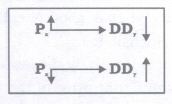
(ii) There would always exist an inverse relationship between price of complementary goods and demand for given commodity.
(iii) It means, with a rise in price of complementary goods, the demand for given commodity falls and vice-versa.
(iv) For example pen and refill, tea and sugar are complements to each other.
14.
(i) The subject matter of economics includes microeconomics and macroeconomics.
(ii) Microeconomics, studies the behaviour of individual economic units of an economy like households, firms, individual consumers and producers etc. It does not study the economy as a whole.
(iii) Macroeconomics is the part of economic theory that studies the economy as a whole, such as national income, aggregate employment, general price level, aggregate consumption, aggregate investment, etc.

11th Standard CBSE Syllabus & Materials
11th Standard CBSE
CBSE 11th Business Studies Forms of Business Organisation Sample Question Papers Study Material - QB365 Set A
NEW11th Standard CBSE
CBSE 11th Business Studies Business, Trade and Commerce Sample Question Papers Study Material - QB365 Set A
NEW11th Standard CBSE
CBSE 11th Physics Waves Sample Question Papers Study Material - QB365 Set A
NEW11th Standard CBSE
CBSE 11th Physics Kinetic Theory Sample Question Papers Study Material - QB365 Set A



CBSE 11th Standard CBSE Subjects
CBSE Standards










